Cumulative Delta MT5
- 지표
-
Evgeny Shevtsov
 Indicators for volume trading :
Volume profile,
Classic profile,
Clusters chart,
Demand and supply levels,
Demand and supply diagram,
Cumulative delta.
Indicators for probabilistic analysis :
Monte Carlo predictor,
Neural predictor. - 버전: 3.6
- 업데이트됨: 9 11월 2024
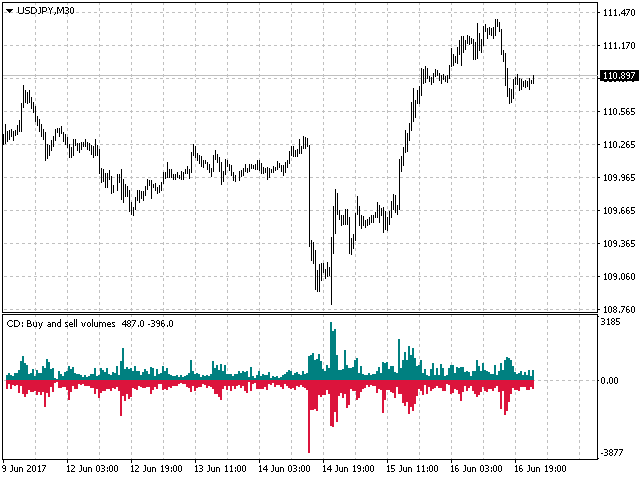
The indicator analyzes the volume scale and splits it into two components - seller volumes and buyer volumes, and also calculates the delta and cumulative delta.
The indicator does not flicker or redraw, its calculation and plotting are performed fairly quickly, while using the data from the smaller (relative to the current) periods.
The indicator operation modes can be switched using the Mode input variable:
- Buy - display only the buyer volumes.
- Sell - display only the seller volumes.
- BuySell - display only the buyer and seller volumes in two separate scales.
- Delta - the mode of difference (delta) between the buyer volumes and seller volumes.
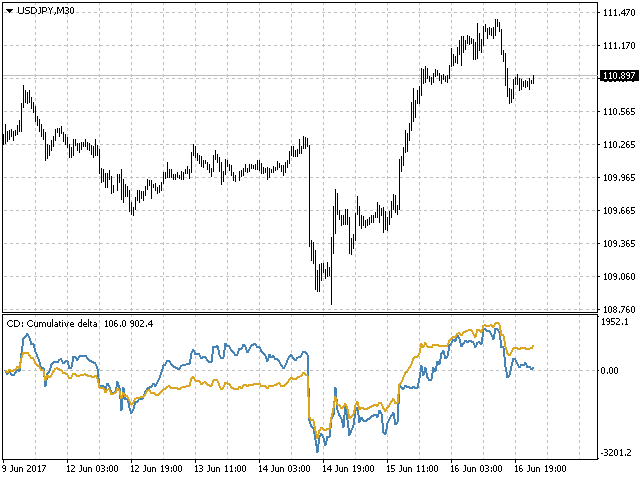
- CumDelta - cumulative delta mode.
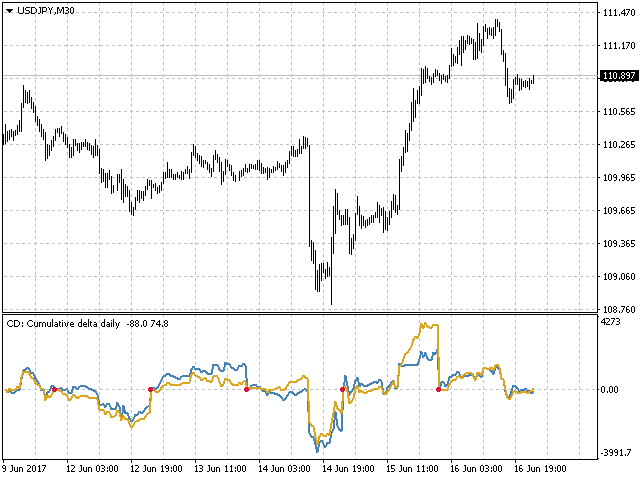
- CumDeltaDaily - cumulative delta mode with zeroing the balance at the beginning of each day.
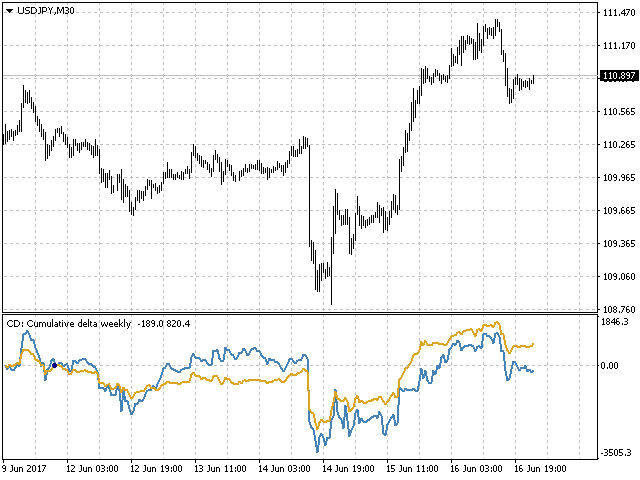
- CumDeltaWeekly - cumulative delta mode with zeroing the balance at the beginning of each week.
- DemandAndSupply - display the supply and demand diagram.
Full recalculation of data is performed once per minute, when a new candle opens on the M1 timeframe, or in case of a user activity, namely, when scrolling the chart deeper into the history, when changing the time scale of the chart or when changing the current timeframe.
By default, the initial reference point is the very first candle from the left border of the chart window. The reference point can be changed using the BarsLimit input variable.
The indicator works with both real volumes and tick volumes. The required scale can be selected in the indicator properties using the Volumes input variable, which sets the Tick or Real modes.
In case the data from any of the volume scales or the data on any of the periods required in calculations is missing, the indicator generates a corresponding message.


thanks for such an amazing tools , useful and intelligence!