Price Alert Line Indicator MT4

The "One-Click" Breakout Monitor

Never Miss a Breakout Again.

Price Alert Line is designed for traders who need speed and simplicity. Instead of navigating complex menus to set price alerts, this tool places a button directly on your chart. With a single click, you can deploy a horizontal line that monitors price action and alerts you immediately when the price crosses it.

New Feature (Smart UI): The control buttons now automatically adapt to match your line colors. If you set your resistance line to Red, the button turns Red. If you set support to Blue, the button turns Blue. Instant visual clarity.

[ Get the MT5 Version Here ] 


Key Features

1. One-Click Deployment A convenient button allows you to instantly draw or delete the alert line. No right-clicking, no typing prices.

2. Smart Placement When you click "Draw Line", the indicator automatically places the line at the Open Price of the current 5-Minute Candle. (You can then drag it anywhere you want).

3. Instant Audio Alerts You will hear a sound alert immediately when the Bid price crosses the line (Up or Down).

4. Dual Line Capability Need to bracket price? Enable the Second Alert Line in settings. You will get two independent buttons on your screen to monitor Support and Resistance simultaneously.

5. Smart Visuals The buttons are color-coded to match their specific lines. You always know exactly which line you are controlling.


Input Parameters

Alert Settings

  • Alert Sound File: The name of the .wav sound file to play (e.g., "alert2.wav").

Line 1 Settings (Bottom Button)

  • Line Color: Color of the horizontal alert line.

  • Note: The control button will automatically match this color.

Line 2 Settings (Top Button)

  • Show Second Button?: Set to true to enable a second independent alert line.

  • Line 2 Color: Color of the second alert line.

  • Note: The second button will automatically match this color.

Button Layout

  • Button Text: Customize the "Draw" and "Delete" labels.

  • Button Text Color: Color of the text inside the button.

  • Button X / Y: Adjust the position on the screen to fit your template.

How It Works

  1. Draw: Click the button. A line appears instantly.

  2. Monitor: The indicator watches the price on every tick.

  3. Alert: If price touches the line, the sound plays.

  4. Reset: Click the button again (now labeled "Delete Line") to remove it.


Trading Scenario

You see a resistance level at 1.0550. You don't want to stare at the screen for hours. Simply click "Draw Line", drag it to 1.0550, and go get a coffee. When the price hits it, the alarm sounds, and you rush back to trade the breakout.

추천 제품
XFibo Auto Fibonacci
Welinton Dos Reis Goncalves
5 (1)
Use with disciplined risk management. Fibonacci entry system based on the golden zone 38.2 - 61.8 where the entry is confirmed at 23.6 with indications of Take Profit 3:1. Automatically plotted Fibonacci contains retracement and expansion Fibonacci in a single indicator. Up to 77% win rate with this system. FTMO challenge pass with 0.50% risk and 1.50% R:R.
Fibonacci Trend Marker
Grigoriy Malychenko
Fibonacci Trend Marker   — is a trend indicator that analyzes the behavior of the current candle relative to the High-Low (HL) range of previous candles using Fibonacci retracement levels. It visually tracks trend strength, signaling potential weakening or reversal through a change in candle color. Features: Designed for trend-focused traders, it helps quickly identify trend changes based on Fibonacci levels. Effective on any timeframe with sufficient market volatility, when a sequence of 3–5 c
Fibonacci Retracement EA is a fully automated MT4 Expert Advisor that trades Forex using the most reliable and time-tested tool in technical analysis – Fibonacci retracement and extension levels . This EA continuously scans the market for swing highs and swing lows , plots Fibonacci levels (38.2%, 50%, 61.8%, 76.4%), and enters trades when price retraces into key zones with candlestick confirmation. It then manages trades automatically with Stop Loss, Take Profit, breakeven, trailing stop, and m
Volume Profile Chart
Makarii Gubaydullin
가격 수준별 거래 시각화. 계산 기간을 자유롭게 설정할 수 있습니다: 두 개의 수직선 사이 또는 고정된 시간 간격. 히스토그램 수준은 상대적입니다: 더 넓은 막대는 더 많은 거래량을 의미합니다. 분포의 극단값은 지지선과 저항선 수준으로 사용될 수 있습니다. 모든 스타일, 크기 및 색상을 사용자 지정할 수 있습니다. 다기능 유틸리티 : 66개 이상의 기능 포함  |   질문이 있으면 저에게 연락하세요  |  MT5 버전 지표 설정에서 다음을 구성할 수 있습니다: 히스토그램 스타일: 시각 모드:  막대   /   선   /  외곽선   /   방향   (각 수준에서 우세한 가격 방향에 따라 색상이 결정되는 막대)。 히스토그램 위치:  차트 경계   /   시간 범위 내   /   시간 범위 외 : 왼쪽 / 오른쪽。 2개의 히스토그램 색상。 히스토그램   너비。 히스토그램 크기 (% 차트   너비 )。 계산 설정: 범위 경계 유형:  차트 2선 사이   /  지정된 최근 분   / 
Paid release: Dynamic Speed Decay Trailing Stop MT4 is a paid MetaCoderStore indicator. Use the product comments for setup questions, feature requests, and feedback for future updates. Dynamic Speed Decay Trailing Stop MT4 is an EA-driven trailing-stop engine based on the exponential decay logic from our VolumeImpulse EA. It does not create entry signals. Your strategy supplies the trade direction, entry time, entry price, and initial risk, then this indicator calculates the adaptive trailing st
Candle Timer MT4 Zakirulbd
Mohammad Zakirul Haque
Zakirulbd Candle Timer V7   Professional trader utilities. Minimal design. Maximum clarity. Zakirulbd Candle Timer V7 is a professional MT5 indicator designed to display the remaining time of the current candle directly on your chart in a clean, distraction-free format. One of the most common frustrations among traders is not knowing exactly how much time remains before a candle closes. Many traders moving from other platforms actively look for a reliable candle countdown timer before fully ado
FREE
NO REPAINT ADVANCED CHART PATTERN INDICATOR By definition, a price ( chart)  pattern is a recognizable configuration of price movement that is identified using a series of  trendlines  and/or curves. When a price pattern signals a change in trend direction, it is known as a reversal pattern; a continuation pattern occurs when the trend continues in its existing direction following a brief pause. Advanced Chart Pattern Tracker is designed to find the MOST ACCURATE patterns. A special script is a
Leo Fibonacci
Dmitriy Zaytsev
The indicator is designed for determining Fibonacci levels. Does not repaint/redraw The blue level shows the zero Fibonacci value (it is also the Pivot level) Red levels show calculated Fibonacci levels (used as a rollback or reversal point) Automatic period detection (periods can be entered manually) Adjustable display calculation method. Settings BarsHistory - the number of bars to be used to display the indicator. Method - method of calculation. AutoPeriod - automated period calculation (true
Quick Drawing MT4
Robby Suhendrawan
Quick Drawing MT4 – 최고의 원클릭 차트 작성 도구 (100% 무료) 단순한 직사각형이나 추세선을 그리기 위해 기본 MetaTrader 4 메뉴를 계속 탐색하는 데 지치셨습니까? 정밀함과 속도에 의존하는 트레이더(특히 프라이스 액션, 스마트 마돈 세력 개념(SMC), 인너 서클 트레이더(ICT), 공급 및 수요(SND), 지지 및 저항(SNR) 트레이더)에게는 매 순간이 중요합니다. 차트 표시는 번거로운 일이 아니라 매끄러워야 합니다. Quick Drawing 은 기술 분석을 강화하도록 설계된 가볍고 고도로 사용자 정의 가능하며 엄격하게 효율적인 온차트 툴바입니다. 단 한 번의 클릭으로 화면 정중앙에 완벽하게 서식 지정된 직사각형과 추세선을 즉시 생성하여 관심 영역(POI)으로 드래그할 준비를 할 수 있습니다. 오더 블록(OB), 공정 가치 갭(FVG), 구조 이탈(BOS), 성격 변화(CHoCH), 유동성 공백(Liquidity Voids) 및 주요 SND/SNR 영
FREE
Fibonacci calculator is used with Elliot Waves, it can generate remarkable results. A trader could use these levels or ratios to find high probability trades with very small stop loss. You may also use these ratios to find Elliott Waves extensions and to book profit near those levels. For Elliot Wave experts, Fibonacci calculator is a highly useful tool that can assist them in calculating Fibonacci extension and retracement levels for the market price. The indicator proves itself as a useful one
Historical Pivot Zones
Luke Anthony Caras
Historical Pivot Zones is a clean support and resistance indicator for MetaTrader 4. The indicator automatically draws important price zones from previous market ranges, helping you see where price may react, reject, break out, or continue. Instead of manually marking higher-timeframe levels every day, Historical Pivot Zones gives you a structured map directly on your chart. It is designed for traders who use support and resistance, range levels, market structure, breakouts, pullbacks, and price
Axiom FVG and OB Mt4
Miguel Angel Leon Yanez
AXIOM FVG + Order Block Pro v4.1 MetaTrader 5용 전문 ICT 및 SMC 기관 트레이딩 지표. 개요 AXIOM FVG + Order Block Pro는 ICT 및 SMC 방법론을 기반으로 Fair Value Gaps와 Order Blocks를 감지하는 재도색 없는 지표입니다. 기관 활동이 발생할 가능성이 높은 수요와 공급 영역을 식별합니다. 주요 기능 모든 시간 프레임에서 구성 가능한 최소 크기와 실시간 완화 추적을 통한 Fair Value Gap 감지. 임펄스 확인 및 구성 가능한 캔들 수를 통한 Order Block 감지. 시장 구조와 일치하는 추세 컨텍스트, 최근 고점과 저점 근처의 유동성 감지, 런던, 뉴욕 및 아시아 세션에 대한 Killzone 세션 필터, 0.5에서 10까지의 독점 영역 강도 점수 알고리즘을 포함한 프리미엄 필터. 컨플루언스 감지는 FVG가 Order Blocks와 겹치는 시점을 식별하여 고확률 영역에 강도 점수를 추가합니
Wa Candle Timer MT4
Wachinou Lionnel Pyrrhus Sovi Guidi
5 (1)
Wa Candle Timer MT4는 MT4 차트에서 다음 캔들이 형성되기까지 남은 시간을 표시하는 강력하고 사용자 친화적인 지표입니다. 이 도구는 트레이더가 캔들 마감 시간을 인식하고 더 나은 거래 결정을 내릴 수 있도록 도와줍니다. 이제 사용자 정의 비율에 도달했을 때 알림 기능도 지원합니다. 주요 기능:   현재 캔들의 카운트다운 표시   남은 시간이 설정한 비율보다 작아지면 색상 변경   3.00 버전에서 추가됨: 지정된 비율에 도달 시 알림 제공   글꼴 및 색상 완전 커스터마이징 가능   거래의 시간 관리 및 정밀도 향상   사용자 설정 항목:   1️⃣ 임계값 이상일 때의 색상   2️⃣ 임계값 이하일 때의 색상   3️⃣ 글꼴 크기   4️⃣ 글꼴 스타일   5️⃣ 알림 트리거 비율 설정 (예: 80%, 90%, 95%) 이 인디케이터는 정확한 타이밍이 중요한 트레이더들에게 매우 유용하며, 거래 전략을 향상시키는 데 도움을 줍니다.
FREE
The Grid Inside
Luiz Octavio Vidal Lacerda De Godoy
5 (1)
The Grid Inside works on a counter trend mode, automatically opens a new order when it hits the price target due to the Fibonacci levels at 23.6 and 73.6. If the price goes the wrong way it opens another order with a calculated lot and position. All the positions are closed when it reaches the target profit defined on settings. As TGI does not use stop loss, I don't recommend you put on your account more than you can afford to lose, the higher the timeframe safer it gets. Once an order is trigge
-- 간단하지만 효과적입니다. 역전 지표 - 무엇인가요? 슈퍼트렌드(SuperTrend) 논리와 지수 곡선 기술을 결합한 추세 추종 오버레이 지표입니다. 추세 방향을 감지하고 차트에 동적 채널을 그리며, 추세가 반전될 때 실시간 알림을 보냅니다. 어떻게 작동하나요? 지표는 ATR과 슈퍼트렌드 계수를 사용해 지수형 기준선을 계산합니다. 가격이 이 기준선 위나 아래로 마감되면 추세 반전이 확인됩니다. 녹색 화살표는 매수 추세 시작을, 빨간색 화살표는 매도 추세 시작을 표시합니다. 주요 기능: ATR 기반 동적 채널을 적용한 지수 추세 기준선 녹색/적색으로 구분된 추세선 및 채워진 채널 추세 반전 시 매수/매도 화살표 신호 내장 알림: 팝업, 푸시 알림, 이메일, 소리 중복 알림 방지 (바당 하나의 알림) 완전 커스터마이징 가능: 색상, 선 두께, 화살표 크기, 채널 폭 지연 없는 깔끔한 차트 오버레이 입력값: 지수 추세율, 슈퍼트렌드 계수, ATR 기간, 채널 폭 토글 기능
FREE
Forex Minor MT4
Sivakumar Subbaiya
Forex Minor — 30-Engine Confluence Trading Desk for MT4 MT5 Version:  https://www.mql5.com/en/market/product/194414 A full trading dashboard on one chart — 30 indicators, one verdict, one entry plan. Product Description Stop switching between fifteen indicators. Let one desk do the reading for you. Forex Minor   is not another line on your chart — it's a complete trading workstation built directly on top of MetaTrader 4. It replaces your cluttered chart with a clean, professional HUD (heads-up
Projection Trend
Tatiana Savkevych
Projection Trend - a Forex arrow indicator without redrawing does not change its signals when the market situation changes, does not adjust to the chart. The signals given by him are unambiguous. Traders build a trading system that provides good signals 80-90% of the time. The indicator showing the points of entry and exit from the market with arrows is able to bring results not only in the Forex market, but also when working with binary options. You can buy it and install it in MetaTrader you
Clever Trend Swing Levels
Carlos Forero
4.22 (9)
Description: The indicator measures, through the zigzag indicator, the levels of trend or correction. It shows in the chart the levels of each low or high detected. KEY LINKS:   How to Install  –  Frequent Questions  -  All Products  How is this indicator useful? This indicator determines, depending on Zigzag parameter if a trend is beginning, developing, or ending This indicator determines the direction of the trend Components Levels as positive or negative numbers, depending on the direction
FREE
VaviStar is an indicator based on trend retracements determined by ZigZag segments. It is theorized, and statistics confirm, that stocks react to certain retracement levels. Many use Fibonacci retracement levels (23.6%, 38.2%, 61.8%). It is assumed that once the price goes beyond the 61.8% retracement, we can already speak of a trend reversal. This indicator allows you to comfortably chart a segment of the ZigZag with the relative operating levels chosen. With a reversal mindset , you can use it
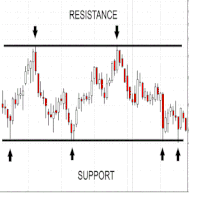
This indicators automatically draws the Support and resistances levels for you once you've dropped it on a chart.  It reduces the hustle of drawing and redrawing these levels every time you analysis prices on a chart. With it, all you have to do is dropped it on a chart, adjust the settings to your liking and let the indicator do the rest.  But wait, it gets better; the indicator is absolutely free!  Get the new and improved version here:  https://youtu.be/rTxbPOBu3nY Parameters Time-frame  -> T
FREE
SWING DETECTOR WITH RSI AND FIBONACCI Structural Swing Points + Fibonacci Retracement + RSI Overlay -------------------------------------------------- FREE INDICATOR Identify swings. See Fibonacci levels. Check RSI. All in one free indicator. -------------------------------------------------- WHAT THIS INDICATOR DOES This indicator automatically detects structural swing highs and lows using configurable depth and deviation filtering. It connects swings with trend lines, overlays standard
FREE
Mood
Gevorg Hakobyan
This indicator is designed for trend trading and it helps in determining the best entry points. To identify the points, it is necessary to follow the signal line. Once the line crosses the zero level upwards - buy, and when it crosses downwards - sell. In addition to the signal line, the indicator also displays the so-called market "mood" in real time in the form of a histogram. The indicator works on all timeframes and with all instruments. The indicator operation required the Moving Average in
Ratio market
Aleksandr Krokhalev
4.41 (17)
Volatility under control. The indicator shows the optimal depth for setting goals within the day and on the average trend. It also builds pivot zones for the estimated correction depth. As an accompaniment, the key levels of the structure are displayed for several timeframes. Classical volatility indicators ATR & ADX on fixed timeframes are used for calculation. The calculation takes into account the spread, and if the market is slightly volatile, you will see a warning about the risk. You can c
FREE
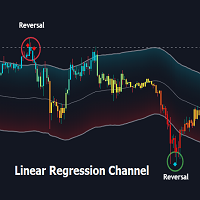
Overview: The Linear Regression Channel Indicator is a versatile tool designed for Metatrader to help traders visualize price trends and potential reversal points. By calculating and plotting linear regression channels, bands, and future projections, this indicator provides comprehensive insights into market dynamics. It can highlight overbought and oversold conditions, identify trend direction, and offer visual cues for future price movements. Key Features: Linear Regression Bands: (   fig
Trend Line Channel
David Muriithi
3.85 (13)
This indicators automatically draws the Trend Channels for you once you've dropped it on a chart.  It reduces the hustle of drawing and redrawing these levels every time you analysis prices on a chart. With it, all you have to do is dropped it on a chart, adjust the settings to your liking and let the indicator do the rest.  Get an alternative version of this indicator here:   https://youtu.be/lt7Wn_bfjPE For more free stuff visit:  https://abctrading.xyz Parameters 1) Which trend do you want t
FREE
This indicator is the mql version of the   Linear Regression Candles   indicator. Find out more here:  https://www.mql5.com/en/users/rashedsamir/seller There are many linear regression indicators out there, most of them draw lines or channels, but this one actually draws a chart.This script includes features such as linear regression for open, high, low, and close prices, signal smoothing with simple or exponential moving averages. I welcome your suggestion for improving the indicator. To incre
FREE
Major Support and Resistance Indicator
Ahmad Ar Abedalaziz Alazaizeh
This indicator filters the Zigzag indicator to calculate the main support and resistance levels. Variables minimum gap between peaks : is the distance (GAP) between the peaks of the Zigzag peaks sensitivity : Minimum number of nearby peaks look back: it means that it has to test the last 50 peaks in the Zigzag object name perfix: a prefix for level’s line name on chart
FREE
BB & RSI Candle Color: Technical Analysis Indicator on MetaTrader 4 The "BB & RSI Candle Color" indicator is a powerful technical analysis tool designed for MetaTrader 4 traders looking for an effective visual representation of market conditions. Created by 13 Crow Trading Club, this indicator combines the popular Bollinger Bands and the Relative Strength Indicator (RSI) to provide clear and accurate visual signals. This indicator offers three key aspects: Candle Color: Normal candles are displa
FREE
Pivot levels Auto V1
Hafis Mohamed Yacine
What Is a Pivot Point? A pivot point is a technical analysis indicator, or calculations, used to determine the overall trend of the market over different time frames. The pivot point itself is simply the average of the intraday high and low, and the closing price from the previous trading day. On the subsequent day, trading above the pivot point is thought to indicate ongoing bullish sentiment, while trading below the pivot point indicates bearish sentimen How to Use Pivot Points The very ess
Transition Trend
Tatiana Savkevych
The Transition Trend indicator shows the points of potential market reversal. The indicator's smart algorithm detects the trend, filters out market noise and generates entry signals and exit levels. Simple, visual and efficient trend detection. Uses just one parameter for settings. The indicator does not redraw and does not lag. You can set up message alerts as sound or email. Works on all currency pairs and all timeframes. Ready-made trading system.
이 제품의 구매자들이 또한 구매함
Trend SniperX MT4
Sarvarbek Abduvoxobov
5 (5)
Trend Sniper X 는 트레이더가 명확하고 정확하게 트렌드 방향과 잠재적 반전 지점을 포착할 수 있도록 돕는 MetaTrader 5 전용 멀티 타임프레임 추세 추종 지표입니다. MT5 버전 링크: https://www.mql5.com/en/market/product/181101 가격 안내: 현재 가격은 프로모션 할인가이며, 향후 업데이트 및 새 기능 출시 시 인상될 수 있습니다. Code2Profit 채널 멀티 타임프레임 분석으로 시장을 정복하세요! Trend Sniper X로 승률을 극대화하는 방법: 핵심 규칙 및 세션 팁 기술 사양 플랫폼 MetaTrader 5 지표 유형 멀티 타임프레임 추세 지표 작동 타임프레임 모든 차트 타임프레임 (상위 타임프레임 M1–MN1 독립 선택 가능) 주요 종목 외환(Forex), 골드(XAUUSD) 및 기타 CFD 추천 계좌 모든 계좌 유형 시각화 컬러 추세 캔들 (매수/매도/약세/변화) + 매수/매도 화살표 추가 모듈 세션 마켓 박스 (
Zoryk Gold mt4
Reda El Koutbane
5 (3)
ZORYK — MetaTrader 4용 XAUUSD 전문 신호 및 트레이드 플래닝 시스템 이런 경험이 있을 것입니다. 골드를 분석하고 진입을 기다린 뒤 마침내 포지션을 열었지만 가격이 곧바로 반대 방향으로 움직입니다. 너무 일찍 청산하거나 Stop Loss를 옮기거나 몇 초 동안 망설입니다. 그 후 시장은 내가 없이도 처음 예상했던 목표까지 정확히 움직입니다. 문제는 항상 방향이 아니었습니다. 진짜 문제는 불확실성이었습니다. 정확한 진입 위치를 몰랐습니다. 어느 지점에서 원래의 트레이드 아이디어가 무효가 되는지 몰랐습니다. 가까운 수익을 확보해야 할지 더 큰 움직임을 기다려야 할지 판단하기 어려웠습니다. 현재 setup이 정말 강한지 아니면 단지 새로운 거래를 억지로 찾고 있는지도 확신하기 어려웠습니다. 골드는 매우 빠르게 움직입니다. 명확한 계획이 없다면 좋은 분석도 몇 초 만에 나쁜 결정으로 바뀔 수 있습니다. ZORYK는 이 문제를 해결하기 위해 개발되었습니다.
M1 Sniper
Oleg Rodin
4.97 (30)
M1 SNIPER 는 사용하기 쉬운 거래 지표 시스템입니다. M1 시간대에 맞춰 설계된 화살표 지표입니다. 이 지표는 M1 시간대 스캘핑을 위한 단독 시스템으로 사용할 수 있으며, 기존 거래 시스템의 일부로도 사용할 수 있습니다. 이 거래 시스템은 M1 시간대 거래용으로 특별히 설계되었지만, 다른 시간대에도 사용할 수 있습니다. 원래는 XAUUSD와 BTCUSD 거래를 위해 이 방법을 설계했지만, 다른 시장 거래에도 유용하다는 것을 알게 되었습니다. 이 지표의 신호는 추세 방향과 반대로 거래될 수 있습니다. 저는 지표의 신호를 활용하여 양방향으로 거래할 수 있도록 돕는 특별한 거래 기법을 알려드립니다. 이 방법은 특별한 동적 지지선과 저항선 가격 영역을 활용하는 것을 기반으로 합니다. 구매하시면 M1 SNIPER 화살표 지표를 바로 다운로드하실 수 있습니다. 또한, 아래 스크린샷에 표시된 Apollo Dynamic SR 지표는 M1 SNIPER 도구를 사용하는 모든 사용자에게 무료로
Tokyo mt4 Indicator
Vasiliy Strukov
5 (9)
Tokyo Indicator는 추세 방향, 잠재적 거래 신호 및 시장 상황을 명확하고 시각적으로 보여줍니다. 색상으로 구분된 계단식 추세선은 강세 구간(파란색)과 약세 구간(자홍색)을 명확히 구별해 줍니다. 추세가 전환될 때 나타나는 방향성 화살표는 잠재적인 매수 및 매도 기회를 강조하여 보여줍니다. 통합 대시보드는 현재 신호, 시장 성향(bias), 모멘텀, 변동성, 신호 품질 등의 정보를 한눈에 파악할 수 있도록 구성되어 있습니다. 이를 통해 트레이더는 별도의 패널을 오갈 필요 없이 가격 움직임(price action)과 지표의 데이터를 동시에 분석할 수 있습니다. 깔끔한 차트 화면과 간결한 시장 개요를 제공하는 Tokyo Indicator는 체계적인 추세 분석과 거래 결정을 지원합니다. 모든 시간대와 다양한 자산(특히 금)에서 활용할 수 있습니다. 추세 방향, 잠재적 거래 신호 및 시장 상황을 명확하고 시각적으로 보여줍니다. 색상으로 구분된 계단식 추세선은 강세 구간(파란색)
PRO Renko System
Oleg Rodin
5 (31)
PRO Renko System 은 RENKO 차트 거래를 위해 특별히 고안된 매우 정확한 거래 시스템입니다. 이것은 다양한 거래 상품에 적용될 수있는 보편적 인 시스템입니다. 체계는 효과적으로 당신에게 정확한 반전 신호에 접근을 주는 소위 시장 소음을 중화합니다. 이 표시기는 사용하기가 매우 쉽고 신호 생성을 담당하는 매개 변수가 하나만 있습니다. 당신은 쉽게 당신의 선택의 어떤 무역 계기에 공구를 적응시킬 수 있고 renko 막대기의 크기. 나는 항상 당신이 내 소프트웨어로 수익성있게 거래 할 수 있도록 추가 지원을 제공 할 준비가되어 있습니다! 나는 당신에게 행복하고 수익성있는 거래를 기원합니다! 구매 후 저에게 연락하십시오! 내 렌코 차트 생성기를 보내드립니다. 또한 내 개인 권장 사항 및 시스템의 다른 모듈을 무료로 공유 할 것입니다!
Currency Strength Wizard
Oleg Rodin
4.85 (61)
통화 강도 마법사는 성공적인 거래를 위한 올인원 솔루션을 제공하는 매우 강력한 지표입니다. 표시기는 여러 시간 프레임의 모든 통화 데이터를 사용하여 이 또는 해당 외환 쌍의 힘을 계산합니다. 이 데이터는 특정 통화의 힘을 확인하는 데 사용할 수 있는 사용하기 쉬운 통화 지수 및 통화 전력선의 형태로 표시됩니다. 필요한 것은 거래하려는 차트에 표시기를 부착하는 것뿐입니다. 표시기는 거래하는 통화의 실제 강세를 보여줍니다. 지표는 또한 추세와 거래할 때 유리하게 사용할 수 있는 구매 및 판매 거래량 압력의 극한값을 보여줍니다. 지표는 또한 피보나치에 기반한 가능한 대상을 보여줍니다. 표시기는 PUSH 알림을 포함한 모든 유형의 알림을 제공합니다. 구매 후 연락주세요. 나는 당신과 거래 팁을 공유하고 당신에게 무료로 훌륭한 보너스 지표를 줄 것입니다! 나는 당신에게 행복하고 유익한 거래를 기원합니다!
Atomic Analyst
Issam Kassas
5 (14)
Atomic Analyst — MetaTrader 4 제품 문의, 설정 안내 또는 기술 지원이 필요하면 MQL5에서 직접 메시지를 보내 주세요. 이 인디케이터는 복잡한 시장 계산을 단순한 시각적 신호, 색상 표시 캔들, 추세 판독, 손절 레벨 및 여러 익절 구간으로 변환하여 트레이더가 빠르게 이해하고 실제 시장 상황에서 사용할 수 있게 합니다. 주요 거래 용도: 스캘핑 및 인트라데이 거래: 빠른 의사결정, 명확한 화살표, 알림, 캔들 색상 및 구조화된 진입/청산 구간을 위해 설계되었습니다. 데이 트레이딩 및 스윙 트레이딩: 추세 방향, 강도, 모멘텀 및 다중 시간대 분석을 사용하여 더 큰 시장 움직임을 따라갈 수 있도록 돕습니다. 주요 기능: • Price Action, 강도 및 모멘텀 분석 • 다중 시간대 추세 스캐너 • 전체 추세 비율 계산 • 매수 및 매도 화살표 • 손절 및 여러 익절 레벨 • 최대 5개의 피보나치 기반 익절 레벨 • 트레일링 스톱 로직 • 추세 및 모멘텀
Smart Trend Trading System
Issam Kassas
4.8 (10)
Smart Trend Trading System은 추세 정보, 진입·청산 신호, 가격 수준을 하나의 차트에 표시하는 MetaTrader 4용 지표입니다. 이 시스템은 추세 감지, 반전 구간, Smart Cloud, 트레일링 스톱 로직, 지지와 저항, 캔들 색상 표시, 알림, 다중 시간대 분석 등 10개 이상의 트레이딩 도구 를 하나의 시스템으로 결합합니다. 이 시스템은 다양한 시장 상황에서 거래를 돕도록 설계되었습니다: 추세장: 주요 추세를 식별하고, 되돌림을 감지하며, 모멘텀을 따라가고, 손절 가이드와 트레일링 스톱 옵션을 사용해 더 깔끔한 진입 지점을 찾습니다. 횡보장: 박스권 시장 상황을 감지하고, 반응 구간을 식별하며, 가격이 중요한 레벨에서 반응할 때 더 명확한 신호를 받을 수 있습니다. 스캘핑 및 인트라데이 거래: 빠른 신호, 캔들 색상, 알림, 다중 시간대 확인을 사용하여 단기 거래 결정을 지원합니다. 주요 기능: • 10개 이상의 인디케이터를 하나의 트레이딩 시스
Scalper Vault
Oleg Rodin
5 (40)
Scalper Vault는 당일 매매(intraday trading)에서 일관된 성과를 내고자 하는 트레이더를 위해 설계된, 강력하고 모든 기능을 갖춘 트레이딩 시스템입니다. 이 고정밀 지표는 외환(Forex) 및 바이너리 옵션 트레이더 모두에게 기관급 분석을 제공하는 독립적인 종합 트레이딩 시스템 역할을 합니다. 구매 후 저에게 연락해 주시면, 트레이딩 팁과 함께 특별한 보너스를 제공해 드립니다! Scalper Vault는 추측에 의존하거나 복잡한 수동 분석을 할 필요를 없애주며, 사용하기 쉬운 트레이딩 기법을 통해 오직 매매 실행에만 집중할 수 있도록 돕습니다. 정확한 추세 추종 신호: 핵심 알고리즘이 시장 구조를 분석하여, 지배적인 시장 추세 방향과 일치하는 고확률 신호만을 제공함으로써 잘못된 진입을 획기적으로 줄여줍니다. 정밀한 고점 및 저점 탐지: 시장의 움직임이 소진되는 지점을 스캔하여 잠재적인 반전 구간을 식별합니다. 간(Gann) 이론 기반의 매수/매도 구간: 수학적
Neuro Poseidon MT4
Daria Rezueva
4.74 (46)
Neuro Poseidon is a new indicator by Daria Rezueva. It combines precise trading signals with adaptive TP/SL levels - creating best possible trades as a result! Message me and get  Neuro Poseidon Assistant  as a gift to automize your trading process! What makes it stand out? 1. Proven profitability on all assets and timeframes 2. Only confirmed BUY and SELL signals present on the chart 3. Adaptive TP & SL levels generated by the software for each trade 4. Easy to understand - suitable for all
Gann Made Easy
Oleg Rodin
4.84 (173)
Gann Made Easy 는 mr.의 이론을 사용하여 최고의 거래 원칙을 기반으로 하는 전문적이고 사용하기 쉬운 Forex 거래 시스템입니다. W.D. 간. 이 표시기는 Stop Loss 및 Take Profit Levels를 포함하여 정확한 BUY 및 SELL 신호를 제공합니다. PUSH 알림을 사용하여 이동 중에도 거래할 수 있습니다. 구매 후 거래 방법 안내 및 유용한 추가 지표를 무료로 받으시려면 저에게 연락주세요! 아마도 Gann 거래 방법에 대해 이미 여러 번 들었을 것입니다. 일반적으로 Gann의 이론은 초보자 거래자뿐만 아니라 이미 거래 경험이 있는 사람들에게도 매우 복잡한 것입니다. Gann의 거래 방식은 이론적으로 적용하기 쉽지 않기 때문입니다. 나는 그 지식을 연마하고 Forex 지표에 최고의 원칙을 적용하기 위해 몇 년을 보냈습니다. 표시기는 적용하기가 매우 쉽습니다. 차트에 첨부하고 간단한 거래 권장 사항을 따르기만 하면 됩니다. 지표는 지속적으로 시장 분석
Liquidity Scalper System
Stanislav Konin
5 (1)
Liquidity Scalper System: 인디케이터 형식의 유동성 기반 트레이딩 시스템입니다. 대부분의 인디케이터는 화살표만 보여주고, 손절을 어디에 둘지, 목표가 어디인지, 신호를 믿어도 되는지는 트레이더가 스스로 판단해야 합니다. Liquidity Scalper System은 거래의 전체 주기를 다룹니다. 유동성 풀을 찾고, 돌파 시 신호를 주며, Entry, Stop Loss와 세 개의 목표를 즉시 계산하고, 패널에 통계와 새로운 데이터에 대한 검증 결과를 표시합니다. 설정은 시스템이 스스로 선택하고 매일 업데이트합니다. 작동 방식 1. 시스템이 유동성 풀을 찾습니다. 시장 참여자들의 스톱 주문이 쌓여 있는 레벨입니다. 2. 가격이 풀을 돌파하고 그 돌파가 움직임의 강도(필요 시 거래량)로 확인되면 차트에 BUY 또는 SELL 화살표가 나타납니다. 3. Entry, Stop Loss, TP1, TP2, TP3 레벨이 영역 채우기와 함께 즉시 그려집니다. 4. 오른쪽에 유
SR Liquidity
Oleg Rodin
5 (2)
SR Liquidity 는 시장 유동성이 집중되고 가격이 가장 강력하게 반응하는 숨겨진 구간을 포착하도록 설계된 트레이딩 지표입니다. 이러한 특수 유동성 구간은 강력한 지지 및 저항선 역할을 하며, 시장 반전 가능성이 가장 높은 지점을 명확하게 보여주는 지도가 되어 줍니다. SR Liquidity는 일반적인 지지 및 저항선을 단순히 그리는 대신, 실제 가격 움직임을 분석하여 매수 및 매도 압력이 집중되는 구간을 포착합니다. 이러한 구간은 실질적인 시장의 흐름을 주도하는 유동성 풀(liquidity pools)에 해당합니다. 이 지표는 해당 구간을 차트에 직접 시각화하여, 가격 반응이 실제로 나타나기 전에 이를 미리 예측할 수 있도록 돕습니다. 즉, 가격 추세가 전환될 가능성을 사전에 파악하게 해주는 것입니다. 결과적으로 이 지표는 가공되지 않은 가격 움직임(price action)을 시장의 핵심 가격대, 다시 말해 추세 전환점이 될 수 있는 지점들을 보여주는 명확하고 실용적인 로드맵
AW Prime Oscillator
AW Trading Software Limited
5 (1)
두 개의 오실레이터의 조합. 첫 번째 항목은 진입점을 표시하고 두 번째 항목은 현재 추세를 표시합니다. 표시기는 두 가지 모드의 화살표로 오실레이터 신호를 표시할 수 있습니다. 모든 빠른 오실레이터 신호 또는 현재 추세 방향의 신호만 표시할 수 있습니다. 다중 시간대 패널과 세 가지 유형의 신호 알림이 있습니다. 이익: 일일 및 스캘핑 거래에 적합 추세 필터링 간단하고 민감한 설정 다중 시간대 패널 Advisor에 통합하는 데 적합합니다. 모든 기호 및 기간에서 작동합니다. 세 가지 유형의 알림 MT5 version ->  HERE  / Problem solving ->  HERE 지표 전략 표시기는 두 개의 서로 다른 오실레이터로 구성됩니다. 느린 추세선(두꺼움) - 지표의 고수준이 위에서 아래로 교차하면 하락세 지표이고, 낮은 수평 수준(지표의 낮은 수준)이 아래에서 위로 교차하면 하락 추세 지표입니다. 상승 경향. 또한, 하단 영역에서 느린 선을 발견하면 현재 추세가 하락세임을
CRT Candle Range Theory HTF MT4 - Ultimate CRT Indicator: 고급 ICT 개념 및 Malaysian SnR 트레이딩 시스템 가장 진보된 Candle Range Theory 지표로 마켓 메이커의 발자취를 마스터하십시오. Ultimate CRT Indicator를 사용하여 Smart Money Concepts(SMC)의 진정한 힘을 발휘하고 기관처럼 정확하게 거래하십시오. 진지한 트레이더를 위해 독점적으로 제작된 이 지표는 ICT Concepts(Inner Circle Trader)의 핵심 기둥인 매우 효과적인 Candle Range Theory(CRT)를 자동화하고 Malaysian Support and Resistance(SnR) 진입 방법과 FVG(Imbalance) 영역의 치명적인 정밀도로 이를 강화합니다. MT4 또는 MT5에서 Forex, Crypto 또는 지수를 거래하든 이 알고리즘은 시장 소음을 제거하고 가짜 돌파(fakeout)
Top Bottom Tracker MT4
Rodrigo Arana Garcia
탑 바텀 트래커는 시장 추세를 분석하고 추세의 고점과 저점을 감지할 수 있는 정교한 알고리즘을 기반으로 하는 지표입니다 / MT5 버전 . 가격은 500$에 도달할 때까지 점진적으로 상승합니다. 다음 가격 --> $99 특징 다시 칠하지 않음 이 표시기는 새 데이터가 도착해도 값을 변경하지 않습니다 거래 쌍 모든 외환 쌍 기간 모든 기간 파라미터 ==== 인디케이터 구성 ==== 구성 매개 변수 // 40 (값이 높을수록 신호가 적지만 더 정확한 신호가 제공됩니다) 상위 레벨 값 // 80 (상단 수평선의 값) 하단 레벨 값 // 20 (하단 수평선 값) 인디케이터 계산 막대 수 // 3000 (인디케이터를 계산할 막대 수). 값 0은 모든 막대에 대해 인디케이터를 계산합니다) ==== 알람 구성 ==== 팝업 알림 // 참(터미널에서 알람) 이메일 알림 // 참(이메일로 알람 전송) 알람 시간 간격 // 10 (분 단위의 알람 간격) 경고
Cycles Predictor
Martin Eshleman
Cycles Predictor Indicator This indicator uses past market cycles to predict future price movements. The indicator scans through past data and considers  combinations  of cycles. When cycles  coincide  at the same future date/time then it is considered a valid future prediction. The predictions are drawn as vertical lines on the right side of the chart in the future. A prediction will often result in type of candle (ex. bull or bear) and/or a reversal point (ex. bottom or top) forming at this ex
Break and Retest Hunter MT4 is a powerful MetaTrader 5 indicator designed to automatically identify support and resistance levels, breakout structures, and potential retest opportunities in real time. Bonus Indicator: After purchasing Break and Retest Hunter , contact me to receive Trade Indicator Assistant EA completely free as a bonus utility. $65 for the next 10 copies . Next price is $120.  Combining adaptive market analysis, clear BUY/SELL signals, Fibonacci-based profit targets, and a pre
GoldRush Trend Arrow Signal
Kirk Lee Holloway
5 (2)
GoldRush 트렌드 화살표 신호 GoldRush 트렌드 화살표 신호 지표는 XAU/USD 시장에서 고속 단기 스캘핑 트레이더를 위해 설계된 정밀한 실시간 트렌드 분석을 제공합니다. 1분 시간대에 특화되어 설계된 이 도구는 명확한 진입점을 표시하는 방향성 화살표를 제공하여 스캘퍼들이 변동성이 높은 시장 환경에서도 자신 있게 거래할 수 있도록 합니다. 이 지표는 PRIMARY 및 SECONDARY 경고 화살표로 구성됩니다. PRIMARY 신호는 추세 방향의 변화를 나타내는 흰색과 검은색 방향성 화살표이며, SECONDARY 신호는 PRIMARY 화살표가 지시하는 방향을 확인하고 잠재적인 거래 진입점을 표시하는 파란색과 빨간색 화살표입니다. 참고: 추세 방향이 변경된 후 PRIMARY 경고 화살표가 단 하나만 표시될 경우, 다수의 SECONDARY 파란색/빨간색 화살표가 표시될 수 있음을 유의해야 합니다. SECONDARY 신호는 신호 기준을 충족하는 어떤 캔들 이후에도 표시
ForexTrendMT4
Andriy Sydoruk
5 (1)
ForexTrendMT4 Indicator: A Reliable Tool for Market Tracking The ForexTrendMT4 indicator offers reliable market trend tracking, filtering out sudden fluctuations and market noise. This tool helps identify trends and signals favorable entry points into the market using arrows. It is suitable for both scalping on shorter timeframes and long-term trading strategies. Based on the principles of technical analysis, ForexTrendMT4 takes into account the cyclical nature of the market. Key Features and A
CRT Multi-Timeframe Market Structure & Liquidity Sweep Indicator Non-Repainting | Multi-Asset | MT5 Version Available MT5 Version:   https://www.mql5.com/en/market/product/162075 Full User Guide — explains what each feature does and why:   https://www.mql5.com/en/blogs/post/767525 Quick Start User Guide  — explains how to configure and in what order:  https://www.mql5.com/en/blogs/post/767540 Indicator Overview CRT Ghost Candle HTF Fractal is a complete institutional-grade market structure too
Super Signal – Skyblade Edition 전문가용 노리페인트 / 노래그 트렌드 신호 시스템, 뛰어난 승률 제공 | MT4 / MT5용 1분, 5분, 15분과 같은 낮은 타임프레임에서 가장 좋은 성능을 보입니다. 핵심 기능: Super Signal – Skyblade Edition은 추세 매매를 위해 설계된 스마트 신호 시스템입니다. 이 시스템은 다중 필터 로직을 활용하여, 명확한 방향성과 실질적인 모멘텀이 수반된 고품질 추세만을 감지합니다. 이 시스템은 고점 또는 저점을 예측하지 않으며 , 다음 세 가지 조건이 모두 충족될 때만 신호를 발생시킵니다: 명확한 추세 방향 강화되는 모멘텀 건전한 변동성 구조 또한, 시장 세션 기반의 유동성 분석을 통해 신호의 신뢰성과 타이밍을 더욱 향상시킵니다. 신호 특성: 모든 화살표 신호는 100% 리페인트 없음 / 지연 없음 신호가 한 번 발생하면 고정되며, 깜빡이거나 사라지지 않음 차트 상의 시각적 화살표, 정보 패널, 팝업 알
Advanced Currency Strength28 Indicator
Bernhard Schweigert
4.91 (659)
현재 40% 할인 초보자 또는 전문가 트레이더를 위한 최고의 솔루션! 이 지표는 우리가 독점 기능과 새로운 공식을 통합했기 때문에 독특하고 고품질이며 저렴한 거래 도구입니다. 단 하나의 차트로 28 Forex 쌍의 통화 강도를 읽을 수 있습니다! 새로운 추세 또는 스캘핑 기회의 정확한 트리거 포인트를 정확히 찾아낼 수 있기 때문에 거래가 어떻게 개선될지 상상해 보십시오. 사용 설명서: 여기를 클릭  https://www.mql5.com/en/blogs/post/697384 그것이 첫 번째, 원본입니다! 쓸모없는 지망생 클론을 사지 마십시오. 더 스페셜  강력한 통화 모멘텀을 보여주는 하위 창의 화살표 GAP가 거래를 안내합니다! 기본 또는 호가 통화가 과매도/과매도 영역(외부 시장 피보나치 수준)에 있을 때 개별 차트의 기본 창에 경고 표시가 나타납니다. 통화 강도가 외부 범위에서 떨어질 때 풀백/반전 경고. 교차 패턴의 특별 경고 추세를 빠르게 볼 수 있는 다중 시간
Volume Orderflow Profile
Suvashish Halder
5 (2)
Introducing Volume Orderflow Profile , a versatile tool designed to help traders visualize and understand the dynamics of buying and selling pressure within a specified lookback period. Perfect for those looking to gain deeper insights into volume-based market behavior! MT5 Version -  https://www.mql5.com/en/market/product/122657 The indicator gathers data on high and low prices, along with buy and sell volumes, over a user-defined period. It calculates the maximum and minimum prices during this
Smart Price Action Concepts
Issam Kassas
4.56 (16)
Smart Price Action Concepts — MetaTrader 4 제품 문의, 설정 안내 또는 기술 지원이 필요하면 MQL5에서 직접 메시지를 보내 주세요. 기능: • Smart Money Concepts SMC • Inner Circle Trading ICT • Price Action PA 및 Institutional Trading IT • 실시간 시장 구조와 swing structure highs and lows (HH HL LL LH) • 실시간 internal and swing supply and demand order blocks • Premium Equilibrium 및 Discount Zones • 2가지 옵션의 자동 Fibonacci 감지: 현재 swing 또는 이전 swing • Equal highs 및 equal lows 패턴 • Break of Structure BOS 알림 • Change of Character CHoCH 알림 • 상위 시간대 BoS
True Direction Oscillator
Muhammad Elbermawi
4.85 (364)
또는 (TDO) "순수 모멘텀 "의 원리를 사용하여 가격 변화율을 측정하는 지수입니다. 유가 증권 가격이 10에서 15로 상승하면 가격 변동률은 150%이지만 15에서 10으로 다시 하락하면 가격 변동률은 33.3%에 불과합니다. 이것이 "가격 변화율"(ROC) 또는 "모멘텀"과 같은 기술적 분석 지표가 내림차순에 제공된 것보다 상승하는 가격 움직임에 대해 더 높은 수치를 제공하는 이유입니다. TDO는 트레이더가 모멘텀을 올바르게 읽을 수 있도록 이 문제를 수정합니다. 중요한 정보 TDO 사용자 매뉴얼: https://www.mql5.com/en/blogs/post/717970 TDO FAQ : https://www.mql5.com/en/blogs/post/722015 TDO 비디오 라이브러리: https://www.mql5.com/en/blogs/post/722018 TDO 전문가 고문 예: https://www.mql5.com/en/blogs/post/731141 TDO
Trend Lines PRO
Roman Podpora
5 (2)
트렌드 라인즈 프로       이 지표는 시장이 실제로 어떤 방향으로 전환되는지 파악하는 데 도움이 됩니다. 실제 추세 반전 지점과 주요 시장 참여자들이 다시 진입하는 지점을 보여줍니다. 보시다시피       BOS 라인       복잡한 설정이나 불필요한 노이즈 없이 더 높은 시간대의 추세 변화와 주요 레벨을 확인할 수 있습니다. 신호는 차트에 다시 그려지지 않고 캔들이 마감된 후에도 계속 표시됩니다. VERSION MT 5   -   RFI LEVELS PRO   표시기   와 결합할 때 최대 잠재력을 발휘합니다. 지표가 보여주는 내용: 실제 변화       추세(BOS 라인) 한 번 신호가 나타나면 그 신호는 계속 유효합니다! 이는 신호를 발생시킨 후 변경될 수 있는 리페인팅 방식의 지표와 중요한 차이점입니다. 리페인팅 방식의 지표는 잠재적으로 자금 손실로 이어질 수 있습니다. 이제 더욱 높은 확률과 정확도로 시장에 진입할 수 있습니다. 또한 화살표가 나타난 후 목표가(익절)
현재 30% 할인 ! 초보자 또는 전문가 트레이더를 위한 최고의 솔루션! 이 대시보드 소프트웨어는 28개의 통화 쌍에서 작동합니다. 2가지 주요 지표(Advanced Currency Strength 28 및 Advanced Currency Impulse)를 기반으로 합니다. 전체 Forex 시장에 대한 훌륭한 개요를 제공합니다. 고급 통화 강도 값, 통화 이동 속도 및 모든(9) 시간대의 28 Forex 쌍에 대한 신호를 보여줍니다. 추세 및/또는 스캘핑 기회를 정확히 파악하기 위해 차트의 단일 지표를 사용하여 전체 시장을 볼 수 있을 때 거래가 어떻게 개선될지 상상해 보십시오! 잠재적인 거래를 식별하고 확인하면서 강력한 통화와 약한 통화를 더욱 쉽게 식별할 수 있도록 이 지표에 기능을 내장했습니다. 이 표시기는 통화의 강세 또는 약세가 증가 또는 감소하는지 여부와 모든 시간대에서 수행되는 방식을 그래픽으로 보여줍니다. 추가된 새로운 기능은 현재 시장 조건 변화에 적응하는
Advanced Supply Demand
Bernhard Schweigert
4.91 (302)
현재 30% 할인! 초보자나 전문 트레이더를 위한 최고의 솔루션! 이 보조지표는 우리가 다수의 독창적 기능과 새로운 공식을 통합한 독특하고 고품질이며 저렴한 거래 도구입니다. 이 업데이트를 통해 이중 시간대를 표시할 수 있습니다. 더 높은 TF를 표시할 수 있을 뿐만 아니라 차트 TF와 더 높은 TF 모두를 표시할 수 있습니다: 중첩 영역 표시. 모든 Supply Demand 트레이더들이 좋아할 것입니다. :) 중요한 정보 공개 Advanced Supply Demand의 잠재력을 극대화하려면 다음을 방문하십시오. https://www.mql5.com/ko/blogs/post/720245   진입 또는 목표의 명확한 트리거 포인트를 정확히 찾아냄으로 해서 거래가 어떻게 개선될지 상상해 보십시오. 새로운 알고리즘을 기반으로 매수자와 매도자 간의 잠재적인 불균형을 훨씬 더 쉽게 분간할 수 있습니다. 왜냐하면 가장 강한 공급영역과 가장 강한 수요 영역과 과거에 어떻게 진행 되었는지를(이전
KT Parabolic RSI MT4
KEENBASE SOFTWARE SOLUTIONS
KT Parabolic RSI overlays Parabolic SAR directly on the RSI line to highlight likely market turning points. Classic RSI overbought and oversold readings already hint at reversals, and the added PSAR filter removes much of the noise and sharpens those signals, giving you clearer trade setups. Big Square Signals: A Parabolic SAR flip on an RSI that sits in overbought or oversold territory. These mark high-probability market turns. Small Square Signals: A SAR flip inside the neutral RSI band. Treat
제작자의 제품 더 보기
Protect your capital and turn winning trades into risk-free positions instantly. Auto Break-Even is an automated trade management utility that shifts your Stop Loss to your entry price (plus a customizable offset) the moment your trade reaches a defined profit target. Take the emotion out of trade management. By automating your break-even process, you prevent winning trades from turning into losers, allowing you to confidently hold positions for larger targets. [   Get the MT4 Version Here  ]
FREE
Maximize your winning trades and lock in profits as the market moves in your favor. Auto Trailing Stop Manager is an advanced trailing stop utility that smoothly moves your Stop Loss behind the current price, securing your gains while giving your trade room to breathe. Instead of manually dragging your Stop Loss, this EA automates the process using a precise Start, Stop, and Step metric. It is the perfect companion for traders who want to ride massive market trends without leaving their profits
FREE
Auto Stop Loss MT5
Nabil Oukhouma
5 (1)
"설정 후 잊으세요(Set & Forget)" - 다중 자산 거래를 위한 리스크 매니저 ️ 절대 거래를 무방비 상태로 두지 마십시오. **Auto Stop Loss (MT5 Manager) **는 안전을 최우선으로 하는 트레이더를 위한 최고의 백그라운드 유틸리티입니다. 일반적인 패널과 달리 이 도구는 백그라운드에서 끊임없이 작동하여 모든 거래를 즉시 보호합니다. 수동으로 거래하든 다른 EA를 통해 거래하든, 이 매니저는 모든 포지션에 강력한 손절매(Stop Loss), 이익 실현(Take Profit) 및 동적 추적 손절매(Trailing Stop)가 즉시 적용되도록 보장합니다. 혁신적 기능: 단 하나의 차트 에서 전체 포트폴리오를 관리하십시오. 10개의 다른 창을 열어 PC 속도를 늦출 필요가 없습니다. 선호하는 통화쌍을 나열하기만 하면 이 매니저가 모든 쌍을 동시에 감시합니다. [   Get the MT4 Version Here   ] 주요 기능 다중 심볼 제어 (CP
Maximize your winning trades and lock in profits as the market moves in your favor.   Auto Trailing Stop Manager   is an advanced trailing stop utility that smoothly moves your Stop Loss behind the current price, securing your gains while giving your trade room to breathe. Instead of manually dragging your Stop Loss, this EA automates the process using a precise Start, Stop, and Step metric. It is the perfect companion for traders who want to ride massive market trends without leaving their prof
FREE
Protect your capital and turn winning trades into risk-free positions instantly.   Auto Break-Even   is an automated trade management utility that shifts your Stop Loss to your entry price (plus a customizable offset) the moment your trade reaches a defined profit target. Take the emotion out of trade management. By automating your break-even process, you prevent winning trades from turning into losers, allowing you to confidently hold positions for larger targets.  [   Get the MT5 Version Here
FREE
"설정 후 잊으세요(Set & Forget)" - 다중 자산 거래를 위한 리스크 매니저 ️   절대 거래를 무방비 상태로 두지 마십시오. **Auto Stop Loss (MT5 Manager) **는 안전을 최우선으로 하는 트레이더를 위한 최고의 백그라운드 유틸리티입니다. 일반적인 패널과 달리 이 도구는 백그라운드에서 끊임없이 작동하여 모든 거래를 즉시 보호합니다. 수동으로 거래하든 다른 EA를 통해 거래하든, 이 매니저는 모든 포지션에 강력한 손절매(Stop Loss), 이익 실현(Take Profit) 및 동적 추적 손절매(Trailing Stop)가 즉시 적용되도록 보장합니다. 혁신적 기능:   단   하나의 차트 에서 전체 포트폴리오를 관리하십시오. 10개의 다른 창을 열어 PC 속도를 늦출 필요가 없습니다. 선호하는 통화쌍을 나열하기만 하면 이 매니저가 모든 쌍을 동시에 감시합니다. [   Get the MT5 Version Here   ]   주요 기능 다중 심
The Professional Trade Management Panel for Manual & Hybrid Trading Execute Faster. Manage Smarter. Secure Profits. Fast Manager (MT4 Utility)   is designed for scalpers and day traders who cannot afford to waste seconds calculating lots or dragging stop lines. This utility transforms your MT4 chart into a professional trading cockpit, handling the math and risk management automatically so you can focus purely on price action. Why Traders Choose Fast Manager: Speed:   Enter and exit the market
The "Smart Lot" Trading Panel for Visual Execution Stop Guessing Your Lot Size. Trade with Precision. The Super Manager (MT4 Manager)  removes the math from your trading. Instead of manually calculating lot sizes or risking too much on a volatile candle, simply define your  Risk in Dollars ($) or (account currency USD, EUR, GBP..) , drag your Stop Loss line on the chart, and let the EA calculate the exact lot size for you instantly. Perfect for traders who follow strict Risk:Reward ratios (1:2,
Trade at the Speed of Thought – No Mouse Required The Fastest Way to Execute Trades. Magic Keyboard (MT4 Utility) transforms your standard keyboard into a professional trading cockpit. Stop wasting milliseconds dragging your mouse to a "Buy" button. With this utility, you can execute, secure, and close trades instantly using the arrow keys you already know. Perfect for Scalpers and High-Frequency Traders where every split-second counts. [ Get the MT5 Version Here ] Default Hotkey Layout Start t
Bank Your Profits & Secure Your Trade in One Click The Ultimate "Scale Out" Tool for Professional Traders. Close Partial  (MT4 Utility)   is designed for traders who want to lock in profits without killing the trend. With a single click, you can bank a percentage of your profit instantly. New Feature (Auto-Secure):   Stop wasting time dragging your Stop Loss after taking profit. This manager can now   automatically move your Stop Loss to Break-Even   the moment you click the "Close Partial" butt
추측은 그만. 계산도 그만. 트레이딩을 시작하세요. Risk Reward Tool 은 TradingView의 직관적이고 시각적인 경험을 MetaTrader 차트로 직접 가져옵니다. 전문적인 트레이딩에는 정확한 리스크 관리가 필요하지만, 엑셀 시트로 수동으로 랏 사이즈를 계산하는 것은 느리고 위험합니다. 해결책:   진입가, 손절매(Stop Loss), 이익 실현(Take Profit) 레벨로 시각적 라인을 드래그하기만 하면 됩니다. 이 도구는 특정 금액(예: $50)을 리스크로 걸기 위해 거래해야 하는 랏 수를   즉시   계산해 줍니다. [   Get the MT5 Version Here   ]    주요 기능 시각적 "TradingView" 스타일:   숫자는 잊으세요; 눈으로 트레이딩하세요. 대화형 녹색(이익) 및 빨간색(손실) 영역을 차트에서 직접 드래그하여 진입 전에 설정을 명확하게 확인하세요. 즉각적인 랏 사이즈 계산기:   수학은 백그라운드에서 이루어집니다.
Never worry about leaving trades open overnight or over the weekend again.   AutoClose Time Manager   is a lightweight, highly reliable trade management utility designed to automatically close open positions and delete pending orders at a specified server time. Whether you are an   intraday trader   looking to flatten your account before the daily rollover, or a   prop-firm trader   strictly avoiding overnight or  weekend holding penalties, this tool ensures your account is clean exactly when yo
The Professional Trade Management Panel for Manual & Hybrid Trading Execute Faster. Manage Smarter. Secure Profits. Fast Manager (MT5 Utility) is designed for scalpers and day traders who cannot afford to waste seconds calculating lots or dragging stop lines. This utility transforms your MT5 chart into a professional trading cockpit, handling the math and risk management automatically so you can focus purely on price action. Why Traders Choose Fast Manager: Speed: Enter and exit the market inst
The "Smart Lot" Trading Panel for Visual Execution Stop Guessing Your Lot Size. Trade with Precision. The Super Manager (MT5 Manager)  removes the math from your trading. Instead of manually calculating lot sizes or risking too much on a volatile candle, simply define your Risk in Dollars ($) or ( account currency USD, EUR, GBP..) , drag your Stop Loss line on the chart, and let the EA calculate the exact lot size for you instantly. Perfect for traders who follow strict Risk:Reward ratios (1:2,
Trade at the Speed of Thought – No Mouse Required The Fastest Way to Execute Trades. Magic Keyboard   (MT5 Utility)   transforms your standard keyboard into a professional trading cockpit. Stop wasting milliseconds dragging your mouse to a "Buy" button. With this utility, you can execute, secure, and close trades instantly using the arrow keys you already know. Perfect for   Scalpers   and   High-Frequency Traders   where every split-second counts. [   Get the MT4 Version Here   ] Default Hotk
Bank Your Profits & Secure Your Trade in One Click The Ultimate "Scale Out" Tool for Professional Traders. Close Partial  (MT5 Utility) is designed for traders who want to lock in profits without killing the trend. With a single click, you can bank a percentage of your profit instantly. New Feature (Auto-Secure): Stop wasting time dragging your Stop Loss after taking profit. This manager can now automatically move your Stop Loss to Break-Even the moment you click the "Close Partial" button. Bank
The "One-Click" Breakout Monitor Never Miss a Breakout Again. Price Alert Line is designed for traders who need speed and simplicity. Instead of navigating complex menus to set price alerts, this tool places a button directly on your chart. With a single click, you can deploy a horizontal line that monitors price action and alerts you immediately when the price crosses it. New Feature (Smart UI): The control buttons now automatically adapt to match your line colors. If you set your resistance li
추측은 그만. 계산도 그만. 트레이딩을 시작하세요. Risk Reward Tool 은 TradingView의 직관적이고 시각적인 경험을 MetaTrader 차트로 직접 가져옵니다. 전문적인 트레이딩에는 정확한 리스크 관리가 필요하지만, 엑셀 시트로 수동으로 랏 사이즈를 계산하는 것은 느리고 위험합니다. 해결책: 진입가, 손절매(Stop Loss), 이익 실현(Take Profit) 레벨로 시각적 라인을 드래그하기만 하면 됩니다. 이 도구는 특정 금액(예: $50)을 리스크로 걸기 위해 거래해야 하는 랏 수를 즉시 계산해 줍니다. [   Get the MT4 Version Here   ]  주요 기능 시각적 "TradingView" 스타일: 숫자는 잊으세요; 눈으로 트레이딩하세요. 대화형 녹색(이익) 및 빨간색(손실) 영역을 차트에서 직접 드래그하여 진입 전에 설정을 명확하게 확인하세요. 즉각적인 랏 사이즈 계산기: 수학은 백그라운드에서 이루어집니다. 리스크 금액(예: $
If you already trade the Opening Range Breakout (ORB) strategy manually , you know the daily routine: wait for the opening range to form, quickly calculate your risk, place your Buy Stop and Sell Stop orders, and monitor the trade. ORB Automator is designed specifically for experienced ORB traders to completely automate this mechanical workflow. You define the times and the risk; the EA handles the execution. Instead of staring at the screen waiting for a candle to close, let the EA identify the
Never worry about leaving trades open overnight or over the weekend again. AutoClose Time Manager is a lightweight, highly reliable trade management utility designed to automatically close open positions and delete pending orders at a specified server time. Whether you are an intraday trader looking to flatten your account before the daily rollover, or a prop-firm trader strictly avoiding weekend holding penalties, this tool ensures your account is clean exactly when you need it to be. [   Get t
Get every trade of your MT5 account in Telegram: opened, closed, partially closed, SL/TP changes and pending orders, plus a daily account report. Setup takes 3 minutes, and the utility tells you in plain words if something is wrong. Know what happens on your account without opening MetaTrader. Telegram Trade Notifier sends a clear message to your Telegram chat, group or channel every time something happens on your MT5 account. It works for manual trades, trades from any Expert Advisor, and trade
Set a maximum daily loss for your whole MT5 account. When it is reached, the EA closes all positions, deletes pending orders and keeps trading locked until the next day. Free, one chart, works with manual trades and with any Expert Advisor. Most big losses do not come from one bad trade. They come from what happens after it: revenge trades, bigger lots, "one more try". Daily Loss Limit Lock takes that decision out of your hands. You choose your limit when you are calm, and the EA applies it when
FREE
Choose how many trades you allow yourself each day. When the limit is reached, any new trade is closed right away and pending orders are deleted until the next day. Free, one chart, works with manual trades and with any Expert Advisor. Most traders know their best trades come early, and the worst ones come after: boredom trades, revenge trades, "just one more". Max Trades Per Day turns your plan into a hard rule. If your plan says 3 trades, the EA makes sure it stays 3. HOW IT WORKS You attach t
FREE
Protect your account from a Stop Out. The EA warns you when the margin level gets low, then closes positions one by one, biggest loser first, until the margin level is safe again. Free, one chart, works with manual trades and with any Expert Advisor. When the margin level falls to the broker's Stop Out level, the broker closes your positions for you, at the worst moment and in its own order. Margin Level Protector acts earlier, at a level you choose, and closes only as much as needed. HOW IT WOR
FREE
See the Tokyo, London and New York sessions (and Sydney) as boxes on your chart, with the high, low and range of each session. Summer time of every city is handled automatically. Free indicator, works on forex, gold, indices and any other symbol. Many trading plans depend on the session: the Asian range, the London breakout, the London and New York overlap. Trading Sessions Box draws each session where it really happened on your broker's chart, so you do not have to calculate time zones or summe
FREE
Draws the previous day, week and month high and low on your chart (PDH, PDL, PWH, PWL, PMH, PML) as clean lines with exact price labels. Optional previous close, today's open, and an alert when price touches a level. Free indicator, works on forex, gold, indices and any other symbol. The high and low of yesterday, last week and last month are some of the most watched levels in trading. Many traders mark them by hand every morning. This indicator does it for you, on every chart, and updates them
FREE
Shows how much time is left until the current candle closes, right next to the price, plus the live spread and the broker's server time. The spread turns red when it is above your limit. Free indicator, works on every timeframe and every symbol. Many entries are made on the candle close, and a wide spread can turn a good entry into a bad one. MetaTrader 5 does not show either on the chart. This indicator adds both, in a clean way, and updates them every second. HOW IT WORKS Right of the last can
FREE
All the rules of your prop firm challenge in one EA: daily loss limit, max drawdown (static or trailing), profit target, max trades per day, max lot, max open positions, stop loss required, trading hours and Friday close. When a trade breaks a rule, it is closed automatically. Most challenges are not lost because of bad strategy. They are lost because of one rule break: a daily loss a few dollars over the limit, one trade too big, a position left open over the weekend. Prop Firm Rules Guard watc
필터:
리뷰 없음
리뷰 답변