Murrey Math Volume and Market Profile

5
  • 지표
  • Csaba Simon
    Csaba Simon
    5 (1)
    A simple goal: profit with low risk and consistency...
    A noble vision that translates into positive working, reflecting the truth!
    Passionate about what I am doing, there are no secrets! I care about our business as much as you do for your own money.
    Merely and nothing more,
  • 버전: 24.6
  • 업데이트됨: 27 9월 2026
  • 활성화: 5
FORBEX PRO v17

Murrey Math • Market Profile • Volume Profile • Gann • Fibonacci • Auction Structure

A complete market-analysis workspace for MetaTrader 4.

FORBEX PRO v17 brings several analytical frameworks into one coordinated chart environment, allowing you to study price structure, value, volume, geometry, time and market behaviour without stacking multiple unrelated indicators on the chart.

This can genuinely become the main analytical indicator on your MT4 workspace.

It is not designed simply to generate BUY or SELL arrows.

It is designed to help you understand where the market is, what it is doing, where value is developing, where price is being accepted or rejected, and where the next meaningful reaction may occur.

Even if you are not yet familiar with Market Profile, Auction Market Theory, Murrey Math or Gann methodology, the visual structure makes these concepts considerably easier to read directly from the chart.

For installation assistance, configuration or guidance regarding the methodology, feel free to contact me. Personal one-to-one sessions can also be arranged with practical chart examples and real-market studies.

Stop guessing. Read the market.

FORBEX PRO v17 combines several complementary forms of analysis inside one system:

  • Murrey Math — geometric price structure and reaction zones
  • Market Profile — time, value, balance and auction behaviour
  • Volume Profile — volume distribution by price
  • Gann geometry and time analysis
  • Fibonacci and Fibonacci Expansion tools
  • Confluence analysis
  • Value Area and POC behaviour
  • HVN / LVN structure
  • Session analysis
  • Interactive chart tools and professional workflow controls

Instead of looking at each methodology independently, FORBEX allows them to work together on the same chart.

The result is a much deeper view of the market:

PRICE + VALUE + VOLUME + TIME + GEOMETRY + CONTEXT

1. Advanced Murrey Math Framework

The Murrey Math engine provides a structured geometric map of price.

It helps identify:

  • Major reaction levels
  • Overbought and oversold areas
  • Structural support and resistance
  • Expansion and extreme zones
  • Price positioning inside the larger trading range
  • Potential reversal and continuation areas

Murrey levels are especially useful when combined with Profile structure because you can immediately see whether an important mathematical price level also coincides with Value Area boundaries, POC, volume concentration or rejection zones.

That is where confluence becomes much more meaningful.

2. Advanced Market Profile

FORBEX PRO provides Market Profile analysis directly inside MT4.

Profiles can reveal:

  • VAH — Value Area High
  • VAL — Value Area Low
  • POC — Point of Control
  • Accepted price
  • Rejected price
  • Balance and imbalance
  • Value migration
  • Session displacement
  • Value Area gaps
  • Full Value Area transitions
  • Developing auction structure

Profiles can be studied across different market periods and sessions, allowing you to understand not simply where price moved, but where the market actually accepted value.

This distinction is fundamental.

A market trading above yesterday's range is not automatically bullish.

The important question is:

Is the market accepting the new prices, or rejecting them?

Market Profile helps answer that visually.

3. Volume Profile & Volume-by-Price

Volume Profile adds another dimension by showing how activity is distributed vertically through price.

The system allows you to identify:

  • Volume POC
  • High Volume Nodes — HVN
  • Low Volume Nodes — LVN
  • Areas of strong participation
  • Areas of low participation
  • Potential acceptance zones
  • Potential rejection zones
  • Liquidity and reaction areas
  • Volume-supported structural levels

This makes it possible to distinguish a level that merely looks important from one where meaningful market participation actually occurred.

Combined with Market Profile, you are viewing both:

TIME AT PRICE

and

VOLUME AT PRICE

rather than relying on price candles alone.

4. Gann Legacy Analysis — Integrated Into FORBEX PRO

One of the major developments of the current PRO version is the integration and refinement of the FORBEX Gann Legacy engine.

The system includes interactive Gann-based analytical tools designed to work directly with chart structure rather than as static drawings.

The updated v17 engine includes improved:

  • Anchor handling
  • Price/time geometry
  • Swing-point interaction
  • Gann calculations
  • Time-bar calculations
  • Cross-timeframe behaviour
  • Object persistence
  • Real-time graphical updating

Gann structures now respond dynamically while their anchor points are being adjusted, making the tool considerably more practical for active analysis.

5. Precision Wick Snapping

The current PRO engine uses improved pixel-aware wick snapping for interactive analytical objects.

Instead of approximately attaching a structure to a candle, anchor points can lock naturally to the relevant candle extremity.

This gives substantially better control when positioning:

  • Gann structures
  • Fibonacci structures
  • Triangle geometry
  • Swing-based analytical objects

Precision matters when geometry is part of the analysis.

6. Advanced P1 — P2 — P3 Geometry

FORBEX PRO v17 contains an improved three-point structural engine.

The system maintains the correct chronological relationship between:

P1 → P2 → P3

even when points are manually moved.

This allows the analytical geometry to remain coherent while still giving the trader freedom to interact directly with the chart.

The current implementation also improves object selection, locking and re-selection behaviour, making manual analysis much faster than earlier versions.

7. Fibonacci & Fibonacci Expansion Integration

Fibonacci analysis is integrated directly into the structural workflow rather than operating as an isolated MT4 drawing tool.

The system supports Fibonacci-based analysis for:

  • Retracement
  • Expansion
  • Swing measurement
  • Target projection
  • Structural confluence

Fibonacci structures update dynamically while their reference points are manipulated.

The Expansion logic also preserves its analytical state during temporary invalid geometry while an object is being repositioned, preventing unnecessary disappearance or reconstruction during chart work.

8. Real-Time Interactive Geometry

A major improvement in the newer engine is the behaviour of analytical structures during manual editing.

Gann and Fibonacci structures can now follow their anchors in real time while you drag them.

This creates a much more natural workflow:

move → observe → compare → release

rather than having to repeatedly redraw or refresh the analysis.

Objects also remain much more stable when changing chart conditions, instruments or timeframes.

9. Cross-Timeframe Analytical Persistence

Important analytical anchors are designed to remain coherent across timeframe changes.

This means you can establish a structural idea on one timeframe and continue analysing it from another without constantly rebuilding your work.

For example:

D1 context → H4 structure → M30 execution

becomes a much more practical workflow when the analytical geometry follows you through the chart rather than disappearing every time the timeframe changes.

10. Session-Aware Time Analysis

The Gann time engine has also been refined.

Instead of treating every theoretical bar equally, the updated calculations take the actual trading-session structure into account.

This produces more reliable time-based projections, particularly on instruments where trading hours, weekends or session structure can distort simplistic bar-count calculations.

11. Confluence — Where the System Becomes Powerful

No single analytical technique is treated as absolute.

The real strength of FORBEX PRO comes from observing when several independent structures agree.

For example:

**Murrey level

  • Market Profile VAL
  • Volume HVN
  • Fibonacci retracement
  • Gann geometry
  • rejection / displacement**

is significantly more meaningful than any one of those observations by itself.

FORBEX therefore functions primarily as a confluence engine.

It allows the trader to ask:

How much independent evidence exists around this price?

rather than:

Did my indicator produce a signal?

12. Professional Chart Control

The system includes an integrated control interface so that individual analytical layers can be displayed only when required.

Depending on the working configuration, the chart can quickly transition from a detailed analytical workspace to a much cleaner execution view.

Integrated controls include functions for:

  • Module visibility
  • Analytical-object management
  • Profile control
  • Chart navigation
  • Symbol navigation
  • Zoom control
  • Fast visual cleanup

The purpose is simple:

maximum information when analysing, minimum clutter when executing.

13. Fast Symbol Navigation

The integrated symbol-management tools allow rapid movement between instruments without repeatedly opening new charts.

The improved symbol-selection workflow makes multi-market analysis substantially faster, particularly for traders who scan:

  • Forex
  • Metals
  • Indices
  • Energy
  • Crypto

from the same workspace.

14. Improved Performance & Workload Protection

FORBEX PRO v17 does considerably more than the first PRO releases, so performance management has also become part of the architecture.

Computationally heavier analytical processes include workload protection designed to prevent unnecessary repeated calculations.

The DNA analytical component, for example, includes runtime workload controls so that deeper historical calculations do not unnecessarily overload MT4.

Several internal processes have also been refined to improve:

  • Object handling
  • Chart refresh behaviour
  • Dragging responsiveness
  • Calculation efficiency
  • Timeframe transitions
  • Symbol transitions
  • Analytical-state preservation

The objective is not simply to add more features.

It is to make those features usable together in a real trading environment.

What FORBEX PRO v17 Helps You See

Instead of asking only:

“Will price go up or down?”

you can analyse:

  • Where is current value?
  • Is value migrating higher or lower?
  • Is price being accepted outside previous value?
  • Is the market balanced or imbalanced?
  • Where is the dominant POC?
  • Where are the HVNs and LVNs?
  • Has price displaced away from value?
  • Is the move being accepted or rejected?
  • Is an important Murrey level nearby?
  • Does Fibonacci support the same zone?
  • Does Gann geometry identify the same area?
  • Is price approaching a structural confluence?
  • Where is the logical invalidation point?
  • Is there enough evidence to trade at all?

Sometimes the best conclusion produced by professional analysis is simply:

NO TRADE.

That is also information.

Built Around Auction Market Logic

The market is fundamentally an auction.

Price continually searches for levels where buyers and sellers are willing to conduct business.

Market Profile identifies where the market spends time.

Volume Profile identifies where the market conducts volume.

Murrey Math identifies important geometric price structure.

Gann contributes price/time geometry.

Fibonacci measures proportion and expansion.

FORBEX PRO combines them so that the trader can evaluate the market from several independent dimensions at the same time.

Suitable Markets

FORBEX PRO v17 can be used for:

  • Forex
  • Stock indices
  • Gold and Silver
  • Commodities
  • Oil
  • Crypto
  • Other instruments available through MetaTrader 4

It can support both:

intraday trading and higher-timeframe swing analysis.

A Practical Multi-Timeframe Workflow

A particularly effective way to use the system is:

1. Higher timeframe — Context

Identify major structure, value, Murrey positioning and dominant auction direction.

2. H4 — Structure

Observe acceptance/rejection, displacement, Profile migration and important confluence areas.

3. M30 — Execution

Wait for price behaviour to confirm the idea around the predetermined structural zone.

In other words:

Context first.
Structure second.
Execution third.

Not Another Signal Indicator

FORBEX PRO does not attempt to replace the trader with a collection of arrows.

It provides the analytical environment from which a trading decision can be made.

The difference is important.

A signal tells you:

“BUY.”

Market structure tells you:

where, why, under what conditions, and where the idea becomes invalid.

That is the philosophy behind FORBEX.

FORBEX PRO v17

One chart. Multiple analytical dimensions. One coherent framework.

Murrey Math
Market Profile
Volume Profile
Auction Structure
Gann Price & Time
Fibonacci
Confluence
Session Analysis
Interactive Geometry
Multi-Timeframe Context

All integrated into a single MT4 analytical environment.

You are not adding another indicator to your platform.

You are adding a complete market-reading framework.

리뷰 1
NGA01281981
20
NGA01281981 2026.08.02 13:10 
 

Thank you, Mr. Simon. This Murrey Math / FORBEX PRO 12 is very helpful for my trading. Also, the way u help me over the phone and even install to my computer was a great help after purchase. Your service is really fantastic, and u have provided me the pdf to self-learning, once start with ur Software my trading clarity is very good and now i am covering my all losses, thank you very much Boss, i strongly recommend this FORBEX PRO 12. also, He Simon Charge only very small price $78.its really worth investment for our trading Journey. Good Luck and all the best for your future new apps boss.

추천 제품
EARLY REMINDER: The Starting price is 65 price will rise soon up to 365$ and then 750$ after first 10 copies of sales. Grab this offer now! Introduction Hello, traders! Welcome to the demonstration of the Forex Beast Indicator , a comprehensive tool designed to assist aspiring traders in navigating the complexities of the forex market. This indicator incorporates seven essential components to provide a well-rounded trading experience: Moving Averages Colored Zones Support and Resistance Levels
This is a new strategy for SUPPLY DEMAND areas It is based on a calculation using the tick volume to detect the big price action in market for both bear /bull actions this smart volume action candles are used to determine the supply and demand areas prices in between main supply and demand lines indicate sideway market  up arrows will be shown when prices moves above the main supply and the secondary supply lines Down arrows will be shown when prices moves below the main demand and the secondary
PS Gold Miner
Nabeel Zafar
2.33 (3)
Hello, >>>>>    Download  ** FREE TRIAL** from here (You can now perform forward test on DEMO account before Purchase)   <<<<<< Discord group for updates and discussion here Telegram channel here Contact Directly here For Live Results of the EA please visit here . PS Gold Miner is an automatic trading system for MT4 which uses markets fundamentals and trends to open, manage and close trades. With the use of advanced recovery strategy it ensure that it can recover from negative trades with hedg
VR Cub
Vladimir Pastushak
VR Cub 은 고품질 진입점을 얻는 지표입니다. 이 지표는 수학적 계산을 용이하게 하고 포지션 진입점 검색을 단순화하기 위해 개발되었습니다. 지표가 작성된 거래 전략은 수년 동안 그 효율성을 입증해 왔습니다. 거래 전략의 단순성은 초보 거래자라도 성공적으로 거래할 수 있다는 큰 장점입니다. VR Cub은 포지션 개시 지점과 이익 실현 및 손절매 목표 수준을 계산하여 효율성과 사용 편의성을 크게 높입니다. 간단한 거래 규칙을 이해하려면 아래 전략을 사용한 거래 스크린샷을 살펴보세요. 설정, 세트 파일, 데모 버전, 지침, 문제 해결 등은 다음에서 얻을 수 있습니다. [블로그] 다음에서 리뷰를 읽거나 작성할 수 있습니다. [링크] 버전 [MetaTrader 5] 진입점 계산 규칙 포지션 개설 진입점을 계산하려면 VR Cub 도구를 마지막 최고점에서 마지막 최저점까지 늘려야 합니다. 첫 번째 지점이 두 번째 지점보다 빠른 경우, 거래자는 막대가 중간선 위에서 마감될 때까지 기다립니다
Price Magnets
Ivan Simonika
Price Magnet — Price Density and Attraction Levels Indicator Price Magnet is a professional analytical tool designed to identify key support and resistance levels based on statistical Price Density. The indicator analyzes a specified historical period and detects price levels where the market spent the most time. These zones act as “magnets,” attracting price action or forming a structural base for potential reversals. Unlike traditional Volume Profile tools, Price Magnet focuses on price-time d
Auto Fibo Pro m
DMITRII GRIDASOV
"Auto FIBO Pro" Crypto_Forex 지표 - 거래에 유용한 보조 도구입니다! - 지표는 자동으로 Fibo 수준과 로컬 추세선(빨간색)을 계산하여 차트에 배치합니다. - Fibonacci 수준은 가격이 반전될 수 있는 주요 영역을 나타냅니다. - 가장 중요한 수준은 23.6%, 38.2%, 50%, 61.8%입니다. - 역전 스캘핑이나 존 그리드 거래에 사용할 수 있습니다. - Auto FIBO Pro 지표를 사용하여 현재 시스템을 개선할 수 있는 기회도 많습니다. - Info Spread Swap Display가 있습니다. 현재 Spread와 Swap이 부착된 외환 쌍을 표시합니다. - 디스플레이에는 계정 잔액, 자본 및 마진도 표시됩니다. - 차트의 어느 모서리에서나 Info Spread Swap Display를 찾을 수 있습니다. 여기를 클릭하여 고품질 트레이딩 로봇과 지표를 확인하세요! 이것은 이 MQL5 웹사이트에서만 제공되는 오리지널 제품입니다.
Master Volume profile
Israr Hussain Shah
Money Flow Profile MT5 HERE   Here   our more valuable tools SMC Trend Trading   ,  Easy SMC Trading  ,  Institutional SMC Architect Volume Analysis Tools  ,  Volume flow Profile  ,  Market volume profile  , FVG with Volume  , Liquidity Heatmap Profile  ,  Volume Spread Analysis This Master Edition is engineered for clarity and speed, featuring a unique Auto-Theme Sync system that instantly beautifies your chart layout upon loading. Key Features: True Money Flow Calculation: Goes beyond stand
Octave Fractal Channel — Dynamic Gann-Based Support/Resistance Levels with Auto-Scaling. This indicator plots a dynamic channel based on the fractal structure of price movement. Channel levels adapt to the current symbol and timeframe, making it suitable for use across various financial instruments — from currency pairs to cryptocurrencies and indices. The indicator can be used in combination with other technical tools, such as the RSI oscillator, to provide additional signal filtering. How to
Force Directional
Jan Carlos Pagano
포스 디렉셔널 지표 포스 디렉셔널 기술 지표는 가격 움직임의 상대적 강도를 측정하고 동시에 트렌드의 방향성을 식별하고 추적하는 데 도움이 되는 요소 세트를 모으는 아이디어에 기반합니다. 이 지표는 느린 오실레이터(검은 선), 빠른 오실레이터(회색 선) 및 지수의 중앙 선으로 작동하는 값이 감소한 신호 선(파란 선)으로 구성되어 있습니다. 이는 움직임의 반전을 식별하고 방향 가이드로도 작동합니다. 지표의 오실레이터는 100의 값 위나 아래로 이동하여 다른 기간 및 시간 프레임에서 마지막 가격의 종가와 이전 종가를 비교합니다. 이 지표는 특히 트렌드 반전을 식별하는 데 효과적이며 어떤 시간 프레임에서도 성공적으로 사용될 수 있습니다. 그러나 보다 정확한 결정을 내리기 위해 움직임이나 트렌드의 강도를 평가하기 위해 보다 긴 시간 프레임에서 사용하는 것이 좋습니다. 사용 방법: 권장되는 전략은 느린 오실레이터가 100보다 작은 값을 가지고 신호 선을 상향으로 통과할 때 매수 포지션
Binary Option Signal
Yaroslav Varankin
Indicator for binary options arrow is easy to use and does not require configuration works on all currency pairs, cryptocurrencies buy signal blue up arrow sell signal red down arrow tips do not trade during news and 15-30 minutes before their release, as the market is too volatile and there is a lot of noise it is worth entering trades one or two candles from the current period (recommended for 1 candle) timeframe up to m 15 recommended money management fixed lot or fixed percentage of the depo
Deep Insight Candles
Richard Bystricky
Deep Insight Candles is an indicator that brings an entirely new perspective to the price chart. It focuses on revealing hidden structures in market movements, uncovering buyer and seller pressure, thus helping traders to better identify key levels, dynamics, and potential reversals. The indicator conveys deeper market insights, allowing traders to make decisions based on a more accurate perception of market sentiment and pressure at specific price levels. This innovative approach transforms the
Works to open two hedging deals, buying and selling, with a goal of each deal of 20 points With the opening of multiple cooling deals in the manner of another lot size and suspending each type of sale or purchase transaction At a profit level. The King Hedging Forex 2R Upward or Downward Profit Works for free on a demo account Expert Link https://t.me/hfmq4/34 Parameters: Lot1: Manual Lot Size Auto_Lot: Set true to automatically calculate optimal Lot Size based on risk preferences, Set False i
Quantum Falcon Signal Free is a smart visual trading indicator for MetaTrader 4 designed for Forex and Gold traders. The indicator combines: • Trend analysis • RSI momentum confirmation • MACD momentum filtering • ATR volatility filtering • Higher timeframe confirmation • Smart exit signal detection Main Features: • Smart Buy and Sell signals • Exit Buy / Exit Sell alerts • Real-time dashboard on chart • Professional candle arrows • Multi-timeframe trend confirmation • ATR market volatility filt
FREE
Trend Scan Friend
Israr Hussain Shah
Here   our more valuable tools SMC Trend Trading   ,  Easy SMC Trading  ,  Institutional SMC Architect Volume Analysis Tools  ,  Volume flow Profile  ,  Market volume profile  , FVG with Volume  , Liquidity Heatmap Profile  ,  Volume Spread Analysis Trend Identification: Look for the color change. When candles turn Green , look for Buy opportunities. When they turn Red , look for Sell opportunities. Entry: Enter on the break of the trend line or on the pullback to the line. Stop Loss: Use the
| Fully-automated Smart Money Concept (ICT) inspired trading solution with multi-strategy capabilities | Built by a grid trader >> for grid traders.  This is MT4 version, click  here  for  Blue CARA MT5  (settings and logics are same in both versions)     Real monitoring signal  -->  Cara Gold Intro Blue CARA EA   ('CARA') - short for  C omprehensive  A lgorithmic R esponsive A dvisor is a next-gen  multi-currency    multi-timeframe  EA base on the widely known (and perhapse most popular) Inn
볼륨 프로파일 스나이퍼 11.1 은 포괄적 인 시장 분석 도구입니다 거래에 대한 전문적인 접근 방식 볼륨 프로파일 스나이퍼 11.1 은 시장 상황의 포괄적 인 평가를 기반으로 명확한 신호를 제공,하나의 지표에 15 개 이상의 키 필터를 결합합니다. 주요 특징 볼륨 불균형 분석-알고리즘은 각 촛불에서 구매자와 판매자의 점유율을 계산하여 당사자 중 한 사람의 우위를 나타냅니다(구성 가능한 임계 값은 50%에서 90%까지). 다단계 신호 필터링-표시기가 고려됩니다: 2015 년 11 월 1 일 과매수/과매도 영역을 제외한 캔들 패턴(핀 바,흡수,망치) 지원/저항 레벨(자동 감지) 주요 플레이어의 활동을 식별하는 볼륨 스파이크 고전적이고 증폭 된 발산 변동성 평가 트렌드 강도를 결정하기 위한 애드엑스 가격 조치(내부 및 외부 막대) 다중 기간 확인 시장 구조(높은 최고/낮은 최저) 세션 필터(아시아,런던,뉴욕 세션) 뉴스 배출으로부터 보호 유연한 구성 시스템-
The Arrow Scalper
Fawwaz Abdulmantaser Salim Albaker
1 (2)
Dear Friend..  I share with you this simple Expert Adviser .. it is full automatic  this Expert Adviser following the trend of the pair you install on or any stocks or indices , it is works like that: - when the trend on H4 chart show a start of up trend the expert will wait till the 15M & 1H charts show an up trend the EA will open a buy order directly , and do the same for down trend and open a sell order the buy or sell  order lot size and take profit and stop loss will measured manually  by
FREE
암호화폐 외환 지표 "MFI 플랫 디텍터"는 효율적인 트레이딩 보조 도구입니다! 리페인팅 현상이 없습니다. MT4용 이 훌륭한 지표로 트레이딩 기법을 한 단계 업그레이드해 보세요. - 이 지표는 차트에서 가격이 평평하게 움직이는 영역을 보여줍니다. "플랫 민감도" 매개변수를 통해 플랫 영역을 감지할 수 있습니다. - "MFI 플랫 디텍터"는 다이버전스 감지에 매우 유용하며, 가격 움직임(Price Action)과 함께 사용하기에도 좋습니다. - 추세 추종 시스템에서 플랫 영역을 감지하고 해당 영역에서 거래를 피하는 데 사용할 수 있습니다. - 반전 스캘핑에서 플랫 경계를 이용해 추세 반전을 포착하는 데 사용할 수 있습니다. - "MFI 플랫 디텍터"는 표준 MFI 오실레이터 대신 사용할 수 있는 다양한 활용법이 있습니다. - Money_Flow_Index(MFI) 자체는 가격과 거래량 데이터를 사용하여 과매도 및 과매수 영역을 식별하는 기술적 오실레이터입니다. - MFI가 80 이
Blahtech Market Profile
Blahtech Limited
4.53 (15)
Was: $249  Now: $99   Market Profile defines a number of day types that can help the trader to determine market behaviour. A key feature is the Value Area, representing the range of price action where 70% of trading took place. Understanding the Value Area can give traders valuable insight into market direction and establish the higher odds trade. It is an excellent addition to any system you may be using. Blahtech Limited presents their Market Profile indicator for the MetaTrader community. Ins
Trend Ray
Andriy Sydoruk
The indicator shows the potential trend direction by cyclical-wave dependence. Thus, all the rays of the intersection will be optimal rays, in the direction of which the price is expected to move, taking into account the indicator period. Rays can be used as a direction for potential market movement. But we must not forget that the approach must be comprehensive, the indicator signals require additional information to enter the market.
Gold PMG EA
Olaoluwa Oluwaseun Bamitale
GOLD PMG EA - MQL5 Product Description GOLD PMG EA A modern MetaTrader 4 Expert Advisor built mainly for Gold trading, with structured pending-order entries, progressive position management, daily protection tools, and a clean on-chart dashboard. Verified Live Results Track the real-time performance of this Expert Advisor on a verified MQL5 signal account.  Click Here to View Live Trading Results Recommendation: Symbol: Gold / XAUUSD TimeFrame: M5   Capital: $500 ($300 or less will work but agg
Amazing Pro System
Muhammed Emin Ugur
Amazing Pro System   indicator is designed for signal trading. This indicator generates trend signals. It uses many algorithms and indicators to generate this signal. It tries to generate a signal from the points with the highest trend potential. This indicator is a complete trading product. This indicator does not need any additional indicators. The indicator certainly does not repaint. The point at which the signal is given does not change.     Features and Suggestions Time Frame: H1 Wor
Moving VVC mt4
Andriy Sydoruk
The   Visual Volatility Clustering   indicator clusters the market based on volatility. The indicator does not redraw and gives accurate data, does not use closing prices. Uses the opening prices or the highs or lows of the previous completed bar. Therefore, all information will be clear and unambiguous. The essence of the indicator is to divide the price market into certain areas according to a similar type of volatility. This can be done in any way. In this example, the indicator is configure
이 표시기는 ogive 모양을 기반으로 합니다. 이러한 모양은 공기 역학 및 우주 기술에 사용됩니다. 총알도 일종의 타원형입니다. 기술 지표에서 이러한 형식을 사용하면 지표의 민감도와 안정성 사이의 절충안을 달성할 수 있습니다. 이는 적용 시 추가적인 가능성을 제공합니다. 표시 매개변수: iType - ogive 형식의 유형입니다. iPeriod - 표시 기간. iFactor 는 포물선 및 지수 형식에 사용되는 추가 매개변수입니다. 유효한 값은 0 - 255입니다. iFactor = 0이면 지표가 단순 이동 평균으로 퇴화합니다. iChannel - 가격이 움직이는 상위 및 하위 채널을 구축할 수 있는 매개변수입니다. 유효한 값은 -128부터 127까지입니다. 값이 양수이면 위쪽 채널이 그려지고 음수이면 아래쪽 채널이 그려집니다. 이러한 매개변수를 결합하여 다른 결과를 얻을 수 있습니다. 지표는 시장의 추세 가격 움직임을 추적하는 데 사용할 수 있습니다. 채널을 구축하면 가격이 움직
High Low Open Close MT4
Alexandre Borela
4.81 (21)
이 프로젝트를 좋아한다면 5 스타 리뷰를 남겨주세요. 이 지표는 열리고, 높은, 낮은 및 마감 가격을 지정합니다. 기간과 그것은 특정한 시간대를 위해 조정될 수 있습니다. 이들은 많은 기관 및 전문가에 의해 보는 중요한 수준입니다 상인은 당신이 더 많은 것일 수있는 장소를 알고 도움이 될 수 있습니다 이름 * 사용 가능한 기간: 이전 날. 이전 주. 지난 달. 이전 분기. 이전 연도. 또는: 현재 날. 현재 주. 현재 달. 현재 분기. 현재 년.
FREE
Deep Analyst Expert Advisor    (mt5  https://www.mql5.com/en/market/product/163998 ) Deep Analyst   is a professional analytical tool powered by a specialized algorithm designed for deep analysis of market cycles and price amplitude fluctuations. By analyzing market conditions over a specific timeframe, the Expert Advisor determines price strength and amplitude using a unique indicator system based exclusively on real-time data. When the global trend and its vector shift, the algorithm automati
캔들의 종가를 예측하는 지표입니다. 지표는 주로 D1 차트에서 사용하기 위한 것이. 이 지표는 전통적인 외환 거래와 바이너리 옵션 거래 모두에 적합합니다. 지표는 독립형 거래 시스템으로 사용하거나 기존 거래 시스템에 추가로 사용할 수 있습니다. 이 표시기는 현재 양초를 분석하여 양초 본체 내부의 특정 강도 요인과 이전 양초의 매개변수를 계산합니다. 따라서 지표는 시장 움직임의 추가 방향과 현재 양초의 종가를 예측합니다. 이 방법 덕분에 지표는 단기 및 중장기 거래 모두에 적합합니다. 지표를 사용하면 시장 상황을 분석하는 동안 지표가 생성할 잠재적 신호의 수를 설정할 수 있습니다. 표시기 설정에는 이를 위한 특별한 매개변수가 있습니다. 또한 인디케이터는 새로운 신호에 대해 차트의 메시지 형태, 이메일 및 PUSH 알림 형태로 알릴 수 있습니다. 구매 후 저에게 꼭 써주세요! 나는 당신에게 지표와 거래에 대한 나의 추천을 줄 것입니다! 또한 보너스를 받으세요!
Rira Renko
Vitor Palmeira Abbehusen
RENKO on Time Chart This indicator is an enhanced Renko, so you can watch the Renko bricks on the chart to understand price movement more clearly the other improvement is automated box size according to ATR (Average True Range) period you can set the ATR number as you want and the box size of Renko changes automatically based on price movement Inputs Mode: Box size is the input to specify the size of the Renko box you want to print on the chart. This input lets you choose the fixed box siz
Prime Gold HFT Ali Coded by Prime Capital Vietnam Best with XAUUSD -  High frequency trading Find your best setting with the backtest before trade with a real account please! With default setting: - Deposit: min 10k-20k money (USC or USD) - Lot trade from 0.01 - Max DD: ~10-20% - Profit: ~10-20% per month with default setting - Leverage: best with 1:2000 Note: - Best with spread max < 30 - Time frame: any - Important: Contact Us before buy  ------   ------   ------   ------   ------   ------
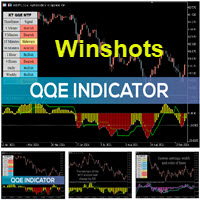
The Qualitative Quantitative Estimation (QQE) indicator is a technical analysis tool developed for the MetaTrader 4 (MT4) trading platform. It is designed to help traders identify potential trend reversals and to determine the strength of a current trend. The QQE indicator is calculated based on the Relative Strength Index (RSI) and Moving Average (MA) indicators. The RSI is used to determine the momentum of price movements, while the MA is used to smooth out the price data and identify trends.
이 제품의 구매자들이 또한 구매함
Trend SniperX MT4
Sarvarbek Abduvoxobov
5 (3)
Trend Sniper X 는 트레이더가 명확하고 정확하게 트렌드 방향과 잠재적 반전 지점을 포착할 수 있도록 돕는 MetaTrader 5 전용 멀티 타임프레임 추세 추종 지표입니다. MT5 버전 링크: https://www.mql5.com/en/market/product/181101 가격 안내: 현재 가격은 프로모션 할인가이며, 향후 업데이트 및 새 기능 출시 시 인상될 수 있습니다. Code2Profit 채널 멀티 타임프레임 분석으로 시장을 정복하세요! Trend Sniper X로 승률을 극대화하는 방법: 핵심 규칙 및 세션 팁 기술 사양 플랫폼 MetaTrader 5 지표 유형 멀티 타임프레임 추세 지표 작동 타임프레임 모든 차트 타임프레임 (상위 타임프레임 M1–MN1 독립 선택 가능) 주요 종목 외환(Forex), 골드(XAUUSD) 및 기타 CFD 추천 계좌 모든 계좌 유형 시각화 컬러 추세 캔들 (매수/매도/약세/변화) + 매수/매도 화살표 추가 모듈 세션 마켓 박스 (
Miraculous Indicator Binary & Forex v3 StrategySafe Miraculous Indicator Binary & Forex v3 StrategySafe 는 명확한 신호, 강력한 확인 도구, 그리고 Binary 및 Forex 시장에서 사용할 수 있는 체계적인 거래 방식을 원하는 트레이더를 위한 전문 지표입니다. v3 버전에는 MIR Dashboard, Miraculous Confirmation Dashboard, GANN Law, Square of 9 레벨, GANN 각도, 그리고 더욱 강화된 Forex 모드가 포함되어 있습니다. 주요 기능 Binary 모드와 Forex 모드를 하나의 지표에서 지원. MIR Dashboard로 빠른 시장 흐름 확인. Miraculous Confirmation Dashboard로 진입 신호 확인. Forex 분석을 위한 GANN Law drawing lines. Square of 9 라인, 레벨, 방향 표시. 1x1 G
SR Liquidity
Oleg Rodin
5 (2)
SR Liquidity 는 시장 유동성이 집중되고 가격이 가장 강력하게 반응하는 숨겨진 구간을 포착하도록 설계된 트레이딩 지표입니다. 이러한 특수 유동성 구간은 강력한 지지 및 저항선 역할을 하며, 시장 반전 가능성이 가장 높은 지점을 명확하게 보여주는 지도가 되어 줍니다. SR Liquidity는 일반적인 지지 및 저항선을 단순히 그리는 대신, 실제 가격 움직임을 분석하여 매수 및 매도 압력이 집중되는 구간을 포착합니다. 이러한 구간은 실질적인 시장의 흐름을 주도하는 유동성 풀(liquidity pools)에 해당합니다. 이 지표는 해당 구간을 차트에 직접 시각화하여, 가격 반응이 실제로 나타나기 전에 이를 미리 예측할 수 있도록 돕습니다. 즉, 가격 추세가 전환될 가능성을 사전에 파악하게 해주는 것입니다. 결과적으로 이 지표는 가공되지 않은 가격 움직임(price action)을 시장의 핵심 가격대, 다시 말해 추세 전환점이 될 수 있는 지점들을 보여주는 명확하고 실용적인 로드맵
Gann Made Easy
Oleg Rodin
4.84 (172)
Gann Made Easy 는 mr.의 이론을 사용하여 최고의 거래 원칙을 기반으로 하는 전문적이고 사용하기 쉬운 Forex 거래 시스템입니다. W.D. 간. 이 표시기는 Stop Loss 및 Take Profit Levels를 포함하여 정확한 BUY 및 SELL 신호를 제공합니다. PUSH 알림을 사용하여 이동 중에도 거래할 수 있습니다. 구매 후 거래 방법 안내 및 유용한 추가 지표를 무료로 받으시려면 저에게 연락주세요! 아마도 Gann 거래 방법에 대해 이미 여러 번 들었을 것입니다. 일반적으로 Gann의 이론은 초보자 거래자뿐만 아니라 이미 거래 경험이 있는 사람들에게도 매우 복잡한 것입니다. Gann의 거래 방식은 이론적으로 적용하기 쉽지 않기 때문입니다. 나는 그 지식을 연마하고 Forex 지표에 최고의 원칙을 적용하기 위해 몇 년을 보냈습니다. 표시기는 적용하기가 매우 쉽습니다. 차트에 첨부하고 간단한 거래 권장 사항을 따르기만 하면 됩니다. 지표는 지속적으로 시장 분석
M1 Sniper
Oleg Rodin
4.97 (30)
M1 SNIPER 는 사용하기 쉬운 거래 지표 시스템입니다. M1 시간대에 맞춰 설계된 화살표 지표입니다. 이 지표는 M1 시간대 스캘핑을 위한 단독 시스템으로 사용할 수 있으며, 기존 거래 시스템의 일부로도 사용할 수 있습니다. 이 거래 시스템은 M1 시간대 거래용으로 특별히 설계되었지만, 다른 시간대에도 사용할 수 있습니다. 원래는 XAUUSD와 BTCUSD 거래를 위해 이 방법을 설계했지만, 다른 시장 거래에도 유용하다는 것을 알게 되었습니다. 이 지표의 신호는 추세 방향과 반대로 거래될 수 있습니다. 저는 지표의 신호를 활용하여 양방향으로 거래할 수 있도록 돕는 특별한 거래 기법을 알려드립니다. 이 방법은 특별한 동적 지지선과 저항선 가격 영역을 활용하는 것을 기반으로 합니다. 구매하시면 M1 SNIPER 화살표 지표를 바로 다운로드하실 수 있습니다. 또한, 아래 스크린샷에 표시된 Apollo Dynamic SR 지표는 M1 SNIPER 도구를 사용하는 모든 사용자에게 무료로
DayTrader PRO MT4
Davit Beridze
4.6 (10)
DayTrader PRO MT5:  https://www.mql5.com/en/market/product/186222 DayTrader PRO는 존 에러스(John Ehlers)의 Laguerre 필터와 강력한 자동 최적화 엔진을 결합한 고급 트레이딩 지표입니다. 고정된 파라미터를 사용하는 대신, 최근 시장 상황을 바탕으로 최적의 설정을 자동으로 검색하므로 지속적인 수동 조정 없이도 변화하는 시장 변동성에 대응할 수 있습니다. 이 지표는 명확한 매수(BUY) 및 매도(SELL) 신호를 생성하며, 현재 시장 변동성을 기준으로 계산된 적응형 손절매(Stop Loss) 및 익절(Take Profit) 레벨을 제공합니다. 내장된 추세, 효율성 지수(Efficiency Ratio), 변동성 및 캔들 필터 기능은 저품질의 진입 신호를 제거하여 신호의 정확도를 높여줍니다. 실시간 성능 대시보드에서는 현재 최적화된 설정값, 수익 요인(Profit Factor), 승률(Win Rate), 최대 낙폭
Smart Trend Trading System
Issam Kassas
4.8 (10)
이 제품은 2026년 시장에 맞게 업데이트되었으며 최신 MT5 빌드에 최적화되었습니다. 가격 업데이트 안내: Smart Trend Trading System은 현재 $99 에 제공됩니다. 다음 30회 구매 후 가격은 $199 로 인상됩니다. 특별 혜택: Smart Trend Trading System 구매 후 저에게 개인 메시지를 보내시면 Smart Universal EA를 무료 로 받을 수 있으며, Smart Trend 신호를 자동 거래로 전환할 수 있습니다. Smart Trend Trading System은 리페인트 없음, 재그리기 없음, 지연 없음의 완전한 트레이딩 시스템으로, 더 깨끗한 신호, 더 나은 추세 방향, 그리고 더 체계적인 시장 거래 방식을 원하는 트레이더를 위해 제작되었습니다. Online course , manual and [download presets] . 이 시스템은 추세 감지, 반전 구간, Smart Cloud, 트레일링 스톱 로직, 지지와 저항, 캔들
Entry Points Pro
Yury Orlov
4.59 (174)
다시 색을 칠하지 않고 거래에 진입할 수 있는 정확한 신호를 제공하는 MT4용 지표입니다. 외환, 암호화폐, 금속, 주식, 지수 등 모든 금융 자산에 적용할 수 있습니다. 매우 정확한 추정값을 제공하고 매수와 매도의 가장 좋은 시점을 알려줍니다. 하나의 시그널로 수익을 내는 지표의 예와 함께 비디오 (6:22)시청하십시오! 대부분의 거래자는 Entry Points Pro 지표의 도움으로 첫 거래 주 동안 트레이딩 결과를 개선합니다. 저희의   Telegram Group 을 구독하세요! Entry Points Pro 지표의 좋은점. 재도색이 없는 진입 신호 신호가 나타나고 확인되면(시그널 캔들이 완성된 경우) 신호는 더 이상 사라지지 않습니다. 여타 보조지표의 경우 신호를 표시한 다음 제거되기 때문에 큰 재정적 손실로 이어집니다. 오류 없는 거래 게시 알고리즘을 통해 트레이드(진입 또는 청산)를 할 이상적인 순간을 찾을 수 있으며, 이를 통해 이를 사용하는 모든 거래자의 성공률이
PZ Swing Trading
PZ TRADING SLU
5 (3)
Protect against whipsaws: revolutionize your swing trading approach Swing Trading is the first indicator designed to detect swings in the direction of the trend and possible reversal swings. It uses the baseline swing trading approach, widely described in trading literature. The indicator studies several price and time vectors to track the aggregate trend direction and detects situations in which the market is oversold or overbought and ready to correct. [ Installation Guide | Update Guide | Tro
TPA True Price Action indicator reveals the true price action of the market makers through 100% non-repainting signals (except early signals mode) strictly at the close of a candle! TPA shows entries and re-entries, every time the bulls are definitely stronger than the bears and vice versa. Not to confuse with red/green candles. The shift of power gets confirmed at the earliest stage and is ONE exit strategy of several. There are available now two free parts of the TPA User Guide for our custom
KURAMA GOLD SIGNAL PRO (MT4) — 7중 필터 · 자동 TP/SL · 품질 점수 · 시그널 기록 저장 | XAUUSD 완전 트레이딩 시스템 실시간 리페인트 없음. 시그널이 나타나는 순간 화살표, 진입, TP, SL이 그 자리에 고정되어 이후 절대 움직이지 않습니다. 여러분이 거래하는 것은 바로 이 실시간 시그널입니다. 그리고 v7.20에서는 실제로 발신된 모든 시그널이 자동 저장되어 재시작 후에도 정확히 복원됩니다. 구매자 전용 보너스 평생 라이선스를 구매하시면 AI Zone Radar($59 상당) + 완전 PDF 매뉴얼을 무료로 드립니다. 제품 가격에 더해 $59 상당의 보너스가 따라옵니다. 구매 후 MQL5로 메시지를 보내주세요. AI Zone Radar: https://www.mql5.com/en/market/product/175834 골드 트레이더 커뮤니티에서 실제로 사용되며 정확성과
Price Breakout pattern Scanner is the automatic scanner for traders and investors. It can detect following patterns automatically from your chart. Head and Shoulder - Common tradable pattern. Reverse Head and Shoulder - This pattern is the reverse formation of the Head and Shoulder. Double Top - When the price hits resistance level twice and decline toward the support level, the trader can anticipate sudden bearish breakout through the support level. Double Bottom - The double bottom pattern is
Quantum Breakout Indicator PRO
Bogdan Ion Puscasu
4.96 (26)
소개       Quantum Breakout PRO   , 브레이크아웃 존 거래 방식을 변화시키는 획기적인 MQL5 지표! 13년 이상의 거래 경험을 가진 숙련된 트레이더 팀이 개발한   Quantum Breakout PRO는   혁신적이고 역동적인 브레이크아웃 영역 전략으로 거래 여정을 새로운 차원으로 끌어올리도록 설계되었습니다. Quantum Breakout Indicator는 5개의 이익 목표 영역이 있는 브레이크아웃 영역의 신호 화살표와 브레이크아웃 상자를 기반으로 한 손절 제안을 제공합니다. 초보자 거래자와 전문 거래자 모두에게 적합합니다. Quantum EA 채널:       여기를 클릭하세요 MT5 버전 :   여기를 클릭하세요 중요한! 구매 후 설치 매뉴얼을 받으려면 개인 메시지를 보내주십시오. 추천: 기간: M15 통화쌍: GBPJPY, EURJPY, USDJPY,NZDUSD, XAUUSD 계정 유형: 스프레드가 매우 낮은 ECN, Raw 또는 Razo
Introducing the POWER TRADE Indicator Created by a small group of experienced traders with years of profitable experience in the financial markets, the Power Trade Indicator is a plug-and-play trading tool designed to help traders spot high-quality setups with ease and confidence. What It Does: It provides powerful entry signals, profit-taking zones, and rebound areas — giving you a complete view of where price action is most likely to move next. The indicator reacts in real time, al
Dark Support Resistance  is an Indicator for intraday trading. This Indicator is programmed to identify  Support and Resistance Lines , providing a high level of accuracy and reliability. Key benefits Easily visible lines Only the most important levels will be displayed Automated adjustment for each timeframe and instrument Easy to use even for beginners Never repaints, never backpaints, Not Lag 100% compatible with Expert Advisor development All types of alerts available: Pop-up, Email, Push
Scalper Inside PRO
Alexey Minkov
4.74 (69)
Scalper Inside PRO helps you read the intraday trend and plan a trade before you enter the market. It is built around three exclusive strategies for a sharper read of the market. The moment a signal appears, the indicator evaluates market direction and calculates the key levels, so you see the potential entry, the expected stop-loss and several profit-taking levels in advance. Detailed performance statistics show how different instruments and strategies performed in history and help you pick ass
PZ Trend Trading
PZ TRADING SLU
4.8 (5)
Capture every opportunity: your go-to indicator for profitable trend trading Trend Trading is an indicator designed to profit as much as possible from trends taking place in the market, by timing pullbacks and breakouts. It finds trading opportunities by analyzing what the price is doing during established trends. [ Installation Guide | Update Guide | Troubleshooting | FAQ | All Products ] Trade financial markets with confidence and efficiency Profit from established trends without getting whips
Prophet
Andriy Sydoruk
Prophet is a trend indicator. Shows the direction of turning points. Can be used with an optimal risk-to-profit ratio. The arrows indicate favorable moments and directions for entering the market. Uses one parameter for setting (adjust from 1 to 3). The probability of a successful trend is very high. In the course of work, the take-profit is much larger than the stop-loss! Works on all currency pairs and on all timeframes.
Atomic Analyst
Issam Kassas
5 (13)
이 제품은 2026년 시장에 맞게 업데이트되었으며 최신 MT5 빌드에 최적화되었습니다. 가격 업데이트 안내: Atomic Analyst는 현재 $99 에 제공됩니다. 다음 30회 구매 후 가격은 $199 로 인상됩니다. 특별 혜택: Atomic Analyst 구매 후 저에게 개인 메시지를 보내시면 Smart Universal EA를 무료 로 받을 수 있으며, Atomic Analyst 신호를 자동 거래로 전환할 수 있습니다. Atomic Analyst는 리페인트 없음, 재그리기 없음, 지연 없음의 Price Action 거래 인디케이터로, 수동 거래, 신호 명확성, EA 자동화를 위해 설계되었습니다. User manual: settings, inputs and strategy.     &   User Manual PDF . 가격 움직임, 강도, 모멘텀, 다중 시간대 방향 및 고급 필터를 분석하여 트레이더가 노이즈를 줄이고 약한 세팅을 피하며 더 체계적인 거래 결정을 내릴 수 있도
Mean Reversion Supply Demand Indicator Mean Reversion Supply Demand is the indicator to detect the important supply demand zone in your chart. The concept of supply demand trading relies on the quantity mismatching between buying and selling volumes in the financial market. Typically, supply demand zone serves to predict the turning point. The wave pattern, for any supply demand zone to work as an successful trade, looks like the price must touch the base zone, move away and then return to zone
Introduction This indicator detects volume spread patterns for buy and sell opportunity. The patterns include demand and supply patterns. You might use each pattern for trading. However, these patterns are best used to detect the demand zone (=accumulation area) and supply zone (=distribution area). Demand pattern indicates generally potential buying opportunity. Supply pattern indicates generally potential selling opportunity. These are the underlying patterns rather than direct price action. T
현재 30% 할인 ! 초보자 또는 전문가 트레이더를 위한 최고의 솔루션! 이 대시보드 소프트웨어는 28개의 통화 쌍에서 작동합니다. 2가지 주요 지표(Advanced Currency Strength 28 및 Advanced Currency Impulse)를 기반으로 합니다. 전체 Forex 시장에 대한 훌륭한 개요를 제공합니다. 고급 통화 강도 값, 통화 이동 속도 및 모든(9) 시간대의 28 Forex 쌍에 대한 신호를 보여줍니다. 추세 및/또는 스캘핑 기회를 정확히 파악하기 위해 차트의 단일 지표를 사용하여 전체 시장을 볼 수 있을 때 거래가 어떻게 개선될지 상상해 보십시오! 잠재적인 거래를 식별하고 확인하면서 강력한 통화와 약한 통화를 더욱 쉽게 식별할 수 있도록 이 지표에 기능을 내장했습니다. 이 표시기는 통화의 강세 또는 약세가 증가 또는 감소하는지 여부와 모든 시간대에서 수행되는 방식을 그래픽으로 보여줍니다. 추가된 새로운 기능은 현재 시장 조건 변화에 적응하는
RFI levels PRO
Roman Podpora
5 (1)
이 지표는 추세 반전 지점과 가격 반등 영역을 정확하게 보여줍니다.       주요 투자자들   . 새로운 트렌드가 형성되는 곳을 파악하고 최대한 정확하게 의사결정을 내리며 모든 거래를 완벽하게 통제합니다. TREND LINES PRO   지표와 함께 사용할 때 최대의 잠재력을 발휘합니다.  VERSION MT5 지표가 보여주는 내용: 새로운 추세의 시작 시 활성화되는 반전 구조 및 반전 수준. 최소한의 위험 대비 수익률을 갖는 이익 실현   (TAKE PROFIT)   및   손절매(STOP LOSS)   레벨 표시       RR 1:2   . 지능형 손실 감소 로직이 적용된 손절매 기능. 지정된 지표에서 두 가지 추세 유형에 대한 반전 패턴을 표시합니다. 지표: 트렌드를 따라   트렌드 라인 프로   (글로벌 트렌드 변화) 트렌드 프로   (빠른 트렌드 변화) 간단하고 효과적입니다       스캐너       실시간 추세 (신규). 다중 시간 프레임 도구 필터링. 표시하다  
Liquidity Heatmap Mt4
Israr Hussain Shah
Here   our MT5 version more valuable tools SMC Trend Trading   ,  Easy SMC Trading  ,  Institutional SMC Architect Volume Analysis Tools  ,  Volume flow Profile  ,  Market volume profile  , FVG with Volume  , Liquidity Heatmap Profile  ,  Volume Spread Analysis 2. Key Features Dynamic Filtering : The core feature. As soon as the current price crosses a historical liquidity level, that level disappears. This reduces chart clutter and prevents you from trading off "dead" support/resistance. Liqui
Neuro Poseidon MT4
Daria Rezueva
4.74 (46)
Neuro Poseidon is a new indicator by Daria Rezueva. It combines precise trading signals with adaptive TP/SL levels - creating best possible trades as a result! Message me and get  Neuro Poseidon Assistant  as a gift to automize your trading process! What makes it stand out? 1. Proven profitability on all assets and timeframes 2. Only confirmed BUY and SELL signals present on the chart 3. Adaptive TP & SL levels generated by the software for each trade 4. Easy to understand - suitable for all
Currency Strength Wizard
Oleg Rodin
4.85 (61)
통화 강도 마법사는 성공적인 거래를 위한 올인원 솔루션을 제공하는 매우 강력한 지표입니다. 표시기는 여러 시간 프레임의 모든 통화 데이터를 사용하여 이 또는 해당 외환 쌍의 힘을 계산합니다. 이 데이터는 특정 통화의 힘을 확인하는 데 사용할 수 있는 사용하기 쉬운 통화 지수 및 통화 전력선의 형태로 표시됩니다. 필요한 것은 거래하려는 차트에 표시기를 부착하는 것뿐입니다. 표시기는 거래하는 통화의 실제 강세를 보여줍니다. 지표는 또한 추세와 거래할 때 유리하게 사용할 수 있는 구매 및 판매 거래량 압력의 극한값을 보여줍니다. 지표는 또한 피보나치에 기반한 가능한 대상을 보여줍니다. 표시기는 PUSH 알림을 포함한 모든 유형의 알림을 제공합니다. 구매 후 연락주세요. 나는 당신과 거래 팁을 공유하고 당신에게 무료로 훌륭한 보너스 지표를 줄 것입니다! 나는 당신에게 행복하고 유익한 거래를 기원합니다!
Neo Wave PRO
Nikolay Raykov
5 (1)
Price & Time Market Structure Indicator A professional market structure tool that analyzes waves through both price and time — not price alone. Main Description NeoWave PRO is a professional market structure indicator for MetaTrader 4 designed for traders who want to move beyond traditional one-dimensional wave tools such as ZigZag, swing indicators, and basic high/low systems. Most wave indicators analyze only one thing: Price. But a real market wave is not only a price movement. A true wave de
Trend Lines PRO
Roman Podpora
5 (1)
트렌드 라인즈 프로       이 지표는 시장이 실제로 어떤 방향으로 전환되는지 파악하는 데 도움이 됩니다. 실제 추세 반전 지점과 주요 시장 참여자들이 다시 진입하는 지점을 보여줍니다. 보시다시피       BOS 라인       복잡한 설정이나 불필요한 노이즈 없이 더 높은 시간대의 추세 변화와 주요 레벨을 확인할 수 있습니다. 신호는 차트에 다시 그려지지 않고 캔들이 마감된 후에도 계속 표시됩니다. VERSION MT 5   -   RFI LEVELS PRO   표시기   와 결합할 때 최대 잠재력을 발휘합니다. 지표가 보여주는 내용: 실제 변화       추세(BOS 라인) 한 번 신호가 나타나면 그 신호는 계속 유효합니다! 이는 신호를 발생시킨 후 변경될 수 있는 리페인팅 방식의 지표와 중요한 차이점입니다. 리페인팅 방식의 지표는 잠재적으로 자금 손실로 이어질 수 있습니다. 이제 더욱 높은 확률과 정확도로 시장에 진입할 수 있습니다. 또한 화살표가 나타난 후 목표가(익절)
Currency Strength Exotics
Bernhard Schweigert
4.88 (33)
현재 20% 할인! 초보자 또는 전문가 트레이더를 위한 최고의 솔루션! 이 표시기는 Exotic Pairs Commodities, Indexes 또는 Futures와 같은 기호에 대한 통화 강도를 표시하는 데 특화되어 있습니다. 금, 은, 석유, DAX, US30, MXN, TRY, CNH 등의 진정한 통화 강도를 보여주기 위해 9번째 줄에 모든 기호를 추가할 수 있습니다. 이것은 독특하고 고품질이며 저렴한 거래 도구입니다. 우리는 많은 독점 기능과 새로운 공식을 통합했습니다. 새로운 추세 또는 스캘핑 기회의 정확한 트리거 포인트를 정확히 찾아낼 수 있기 때문에 거래가 어떻게 개선될지 상상해 보십시오. 사용 설명서: 여기를 클릭 https://www.mql5.com/en/blogs/post/708876 모든 시간대에 작동합니다. TREND를 빠르게 확인할 수 있습니다! 새로운 기본 알고리즘을 기반으로 설계되어 잠재적인 거래를 더욱 쉽게 식별하고 확인할 수 있습니다. 8개의
PipFinite Breakout EDGE
Karlo Wilson Vendiola
4.93 (488)
The Missing Edge You Need To Catch Breakouts Like A Pro. Follow a step-by-step system that detects the most powerful breakouts! Discover market patterns that generate massive rewards based on a proven and tested strategy. Unlock Your Serious Edge Important information here www.mql5.com/en/blogs/post/723208 The Reliable Expert Advisor Version Automate Breakout EDGE signals using "EA Breakout EDGE" Click Here Have access to the game changing strategy that will take your trading to the next l
제작자의 제품 더 보기
FORBEX Market Watch Trading Hours PRO NEWS  Feel free to contact me for support, installation assistance, and upgrade. Professional Market Session, Trading Schedule & Economic News Dashboard for MetaTrader 4 FORBEX Market Watch Trading Hours PRO NEWS is an advanced all-in-one MT4 dashboard designed to provide traders with real-time market session monitoring, broker trading schedules, live countdowns, intelligent voice alerts, and economic news awareness from one clean professional interface. The
# FORBEX Market Watch Trading Hours ## Professional Market Session Monitoring for MetaTrader 4 FORBEX Market Watch Trading Hours is a powerful MT4 dashboard EA, designed to provide traders with a complete real-time overview of market opening and closing schedules across Forex pairs, Indices, Commodities, Metals, Cryptocurrencies, and other broker-supported instruments. The dashboard automatically scans all symbols available in Market Watch and displays their current trading status, live sess
FREE
FORBEX Candle Count Down Timer Every Candle Counts Know exactly how much time remains until the current candle closes. FORBEX Candle Count Down Timer is a simple yet highly practical utility that displays the remaining time of the active candle directly on the chart, helping traders make better timing decisions and avoid entering or exiting positions blindly during candle formation. Whether you trade using Price Action, Volume, Market Profile, Murrey Math, or any other methodology, knowing how
FREE
FORBEX Symbol Changer One Click Away.  If you experience any issues, have questions, or would like to learn more about the system and its methodology, please feel free to get in touch. Please contact me, and I will guide you through the entire installation process via AnyDesk to ensure everything is installed correctly and fully ready to use even before the purchase. FORBEX Philosophy Built by traders for traders, FORBEX tools focus on simplicity, efficiency, and practical workflow improvements
FREE
Forbex Gann Legacy Fibonacci Confluence Tool One chart. One structure. One complete professional analysis workspace. Forbex Gann Legacy Fibonacci Confluence Tool is designed for traders who want more than another indicator displaying arrows or mechanical signals. It is a complete manual market-analysis and decision-support system for MetaTrader 4 , combining market structure, Gann projections, Fibonacci confluence, historical statistics, multi-timeframe context and practical chart-management too
필터:
NGA01281981
20
NGA01281981 2026.08.02 13:10 
 

Thank you, Mr. Simon. This Murrey Math / FORBEX PRO 12 is very helpful for my trading. Also, the way u help me over the phone and even install to my computer was a great help after purchase. Your service is really fantastic, and u have provided me the pdf to self-learning, once start with ur Software my trading clarity is very good and now i am covering my all losses, thank you very much Boss, i strongly recommend this FORBEX PRO 12. also, He Simon Charge only very small price $78.its really worth investment for our trading Journey. Good Luck and all the best for your future new apps boss.

리뷰 답변