Automated Actual Support Resistance A2SR
- インディケータ
-
Yohana Parmi
 - - -
- - -
TRADER's SAVIOR.
A Next-Generation Gold Scalping Expert Advisor
https://www.mql5.com/en/market/product/173684
* A2SR - バージョン: 9.49
- アップデート済み: 12 4月 2026
- アクティベーション: 10
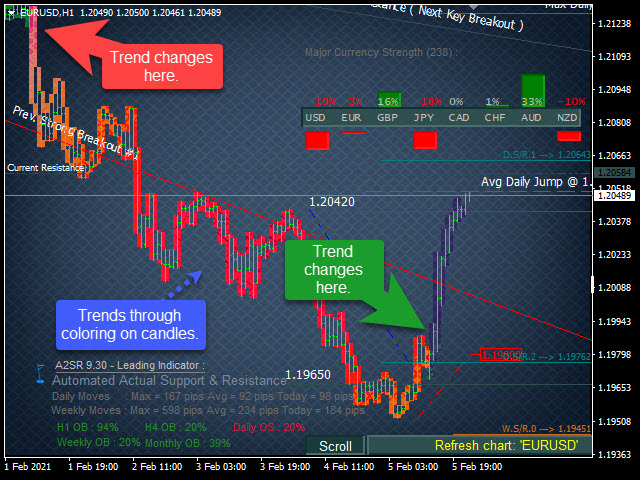
A. A2SR とは何ですか?
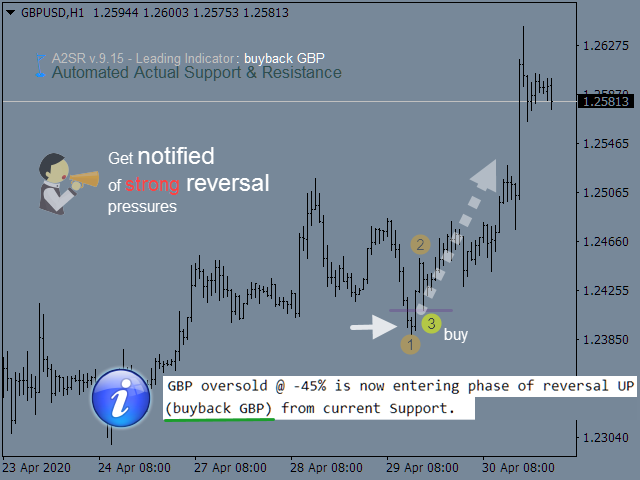
* 先行テクニカル指標です (塗り直しなし、ラグなし)。
-- ガイダンス :
- A2SR には、サポート (需要) とレジスタンス (供給) のレベルを決定する特別な手法があります。
- ネットで見かける通常の方法とは異なり、A2SR は実際の SR レベルを決定する独自のコンセプトを持っています。
- 元の手法はインターネットから取得されたものではなく、インターネット上で公開されたこともありません。
- A2SR は、取引スタイルに応じて SR レベルを自動選択します。
- 時間枠を変更しても、SR レベルはその位置にとどまります。
- 実際のSRは、使用する時間枠から取得されるわけではないため.
A2SR には、取引のための完全な手段があります。
- 実際のサポート (需要) とレジスタンス (供給) の真のコンセプト。
- ニュース イベントと中央銀行のスピーチに対する市場のセンチメント。
- ニュース イベントとトレンドの主要通貨強度 (MCS) の真のコンセプト。
- ポジションの配置に関する提案を含む、今日の現在の傾向。
- SR、Breakout、Breakdown の自動レベル トレンド ライン。 グラフの分析がより簡単になります。
- 平均および最大範囲での日々の価格の急騰と下落の真のコンセプト (ニュース イベント)。
- 買われ過ぎと売られ過ぎ。スケール H1、H4、日次、週次、月次で同時に表示されます。
B. なぜ A2SR の使用を好むのですか?
- ここでの SR レベルは実際のレベルであり、通常のように時間枠から取得されるわけではありません。
- これは先行指標であり、価格がそこに到達する前に SR レベルが利用可能であり、再描画も遅延もありません。
- A2SR は、MetaTrader で任意の通貨ペア、金属、株式の取引計画を作成するために設計されています。
- A2SR の基本的な使用方法は、.pdf ファイルのユーザー ガイドでも入手できます。必要に応じて、作成者からさらにトレーニングを受けることができます。
- A2SR が自動的に作業を支援し、すべてのツールが完成するため、チャートに忙しい描画をする必要はもうありません。
- A2SR は、短期および/またはスイング トレード用の SR を選択するのに役立ちます。
- 最後に、市場のセンチメントや取引計画の作成など、市場を確認する十分な時間があります。
C. 著者は品質を理解している。
確かに A2SR は、ロジックとプログラミングの効率的なコンセプトで構築されています。
分析プロセスがコンピュータの CPU を過負荷にしないようにします。
28 の通貨ペアを同時に処理することは、実際には小さな処理ではありません。
(USDSEK と EURSEK を含む 30 の通貨ペアを読み取る)
この先行指標のような大規模なプロセスを実行する場合は、低品質のコンピューターを使用しないでください。
最小システム要件:
i3 / Ryzen 3 プロセッサまたは同等の、SSD 上のアプリとデータ、8GB RAM、OS Windows 7、8、8.1、10 以上。
D. 入力パラメータ
ここには十分なスペースがないため、「入力パラメーター」は次の場所に用意されています。


Hello, I am a customer from China and have run out of activation times. Can you provide me with a version without activation restrictions? I bought the A2SR indicator, 250USD