Heiken Ashi and Heiken Ashi Smoothed MA MT4
- インディケータ
-
Ku Chuan Lien
 Just call me Googol.
Being EA Coder from 2015 with 3 decades experience of MMO, Mobile Game Coder.
FB: @GoogolForex
https://www.facebook.com/GoogolForex/ - バージョン: 1.3
- アップデート済み: 26 6月 2022
- アクティベーション: 8
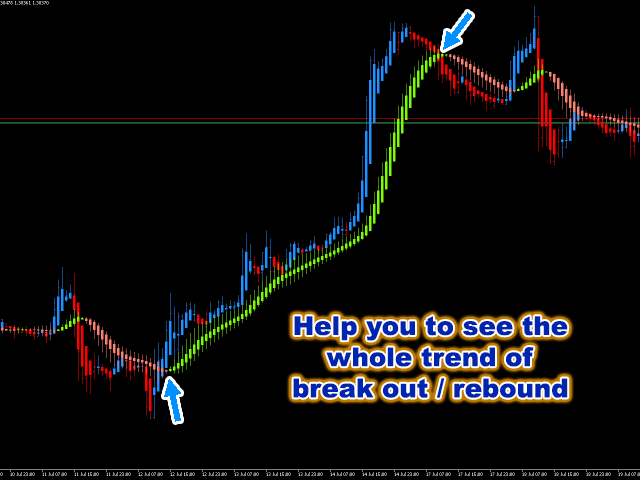
Heiken Ashi Smoothed Strategy is a very simple but powerful system to get forex market trend direction.
This indicator is actually 2 indicators in 1 pack, Heiken Ashi and Heiken Ashi Smoothed Moving Average both included.
Because HA (Heiken Ashi) and HAS (Heiken Ashi Smoothed) are calculated in the same one system event with necessary buffers and loop only, so it is the FAST, OPTIMIZED and EFFICIENT HA having the combined indicator of MetaTrader 4.
You can choose to display HA and HAS in the same time, or display one of them only.
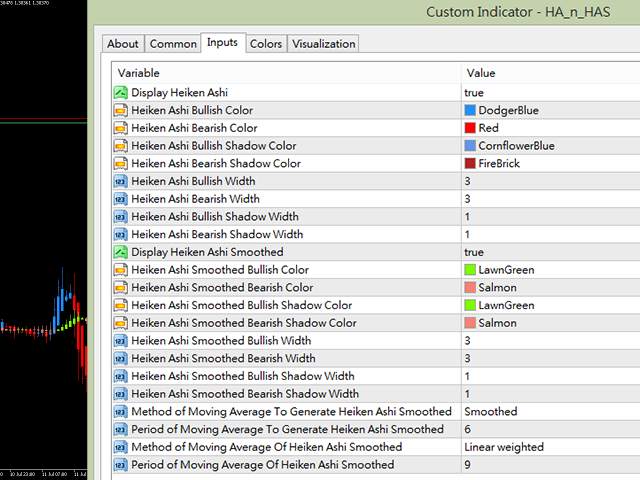
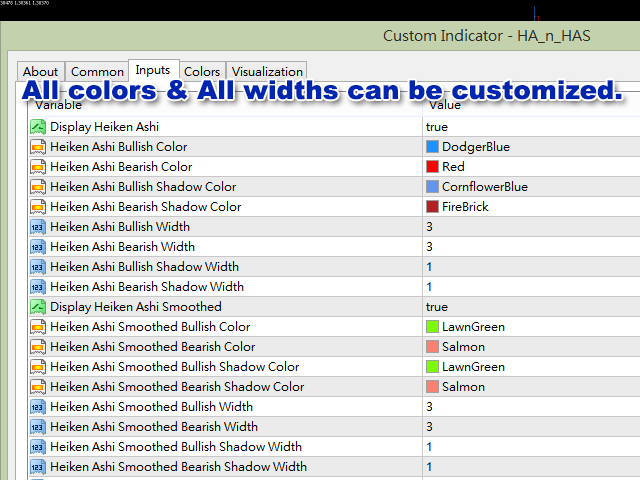
Inputs
- Display Heiken Ashi: true = display Heiken Ashi, false = hide and do not calculate.
- Heiken Ashi Bullish Color: Bullish candle color of Heiken Ashi.
- Heiken Ashi Bearish Color: Bearish candle color of Heiken Ashi.
- Heiken Ashi Bullish Shadow Color: Bullish shadow color of Heiken Ashi.
- Heiken Ashi Bearish Shadow Color: Bearish shadow color of Heiken Ashi.
- Heiken Ashi Bullish Width: Bullish candle width of Heiken Ashi.
- Heiken Ashi Bearish Width: Bearish candle width of Heiken Ashi.
- Heiken Ashi Bullish Shadow Width: Bullish shadow width of Heiken Ashi.
- Heiken Ashi Bearish Shadow Width: Bearish shadow width of Heiken Ashi.
- Display Heiken Ashi Smoothed: true = display Heiken Ashi Smoothed, false = hide and do not to calculate.
- Heiken Ashi Smoothed Bullish Color: Bullish candle color of Heiken Ashi smoothed.
- Heiken Ashi Smoothed Bearish Color: Bearish candle color of Heiken Ashi smoothed.
- Heiken Ashi Smoothed Bullish Shadow Color: Bullish shadow color of Heiken Ashi smoothed.
- Heiken Ashi Smoothed Bearish Shadow Color: Bearish shadow color of Heiken Ashi smoothed.
- Heiken Ashi Smoothed Bullish Width: Bullish candle width of Heiken Ashi smoothed.
- Heiken Ashi Smoothed Bearish Width: Bearish candle width of Heiken Ashi smoothed.
- Heiken Ashi Smoothed Bullish Shadow Width: Bullish shadow width of Heiken Ashi smoothed.
- Heiken Ashi Smoothed Bearish Shadow Width: Bearish shadow width of Heiken Ashi smoothed.
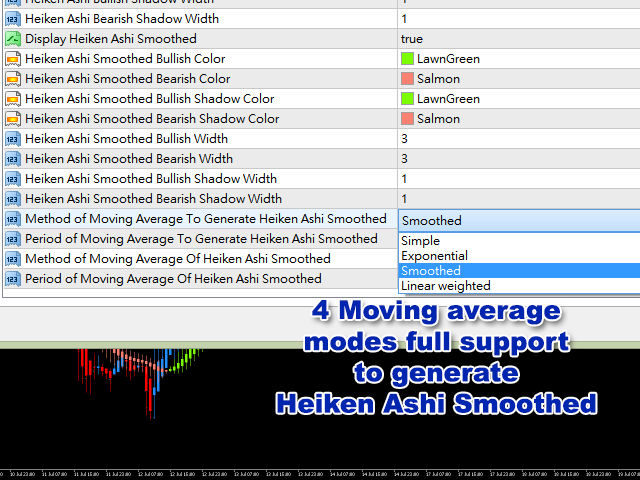
- Method of Moving Average To Generate Heiken Ashi Smoothed: Simple, Exponential, Smoothed, Linear weighted, four modes of moving average supported to generate Heiken Ashi Smoothed.
- Period of Moving Average To Generate Heiken Ashi Smoothed: Period of moving average to generate Heiken Ashi Smoothed.
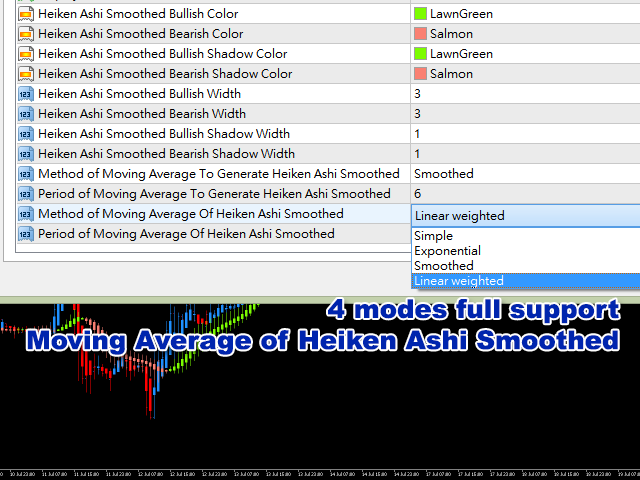
- Method of Moving Average Of Heiken Ashi Smoothed: Simple, Exponential, Smoothed, Linear weighted, four modes supported to calculate Moving Average of Heiken Ashi Smoothed.
- Period of Moving Average Of Heiken Ashi Smoothed: Period of Moving Average of Heiken Ashi Smoothed.

good tool - fits right in with my strategy