Up Down V9
- インディケータ
- バージョン: 12.0
- アップデート済み: 6 2月 2026
- アクティベーション: 5
on demo mode use date to work.
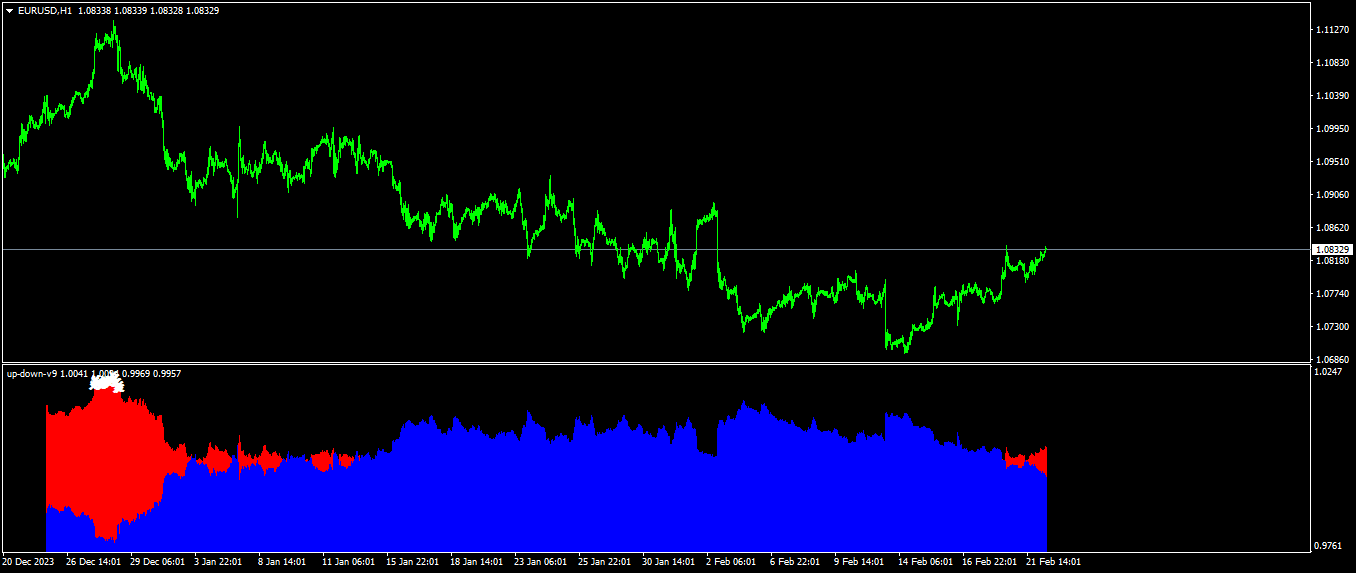
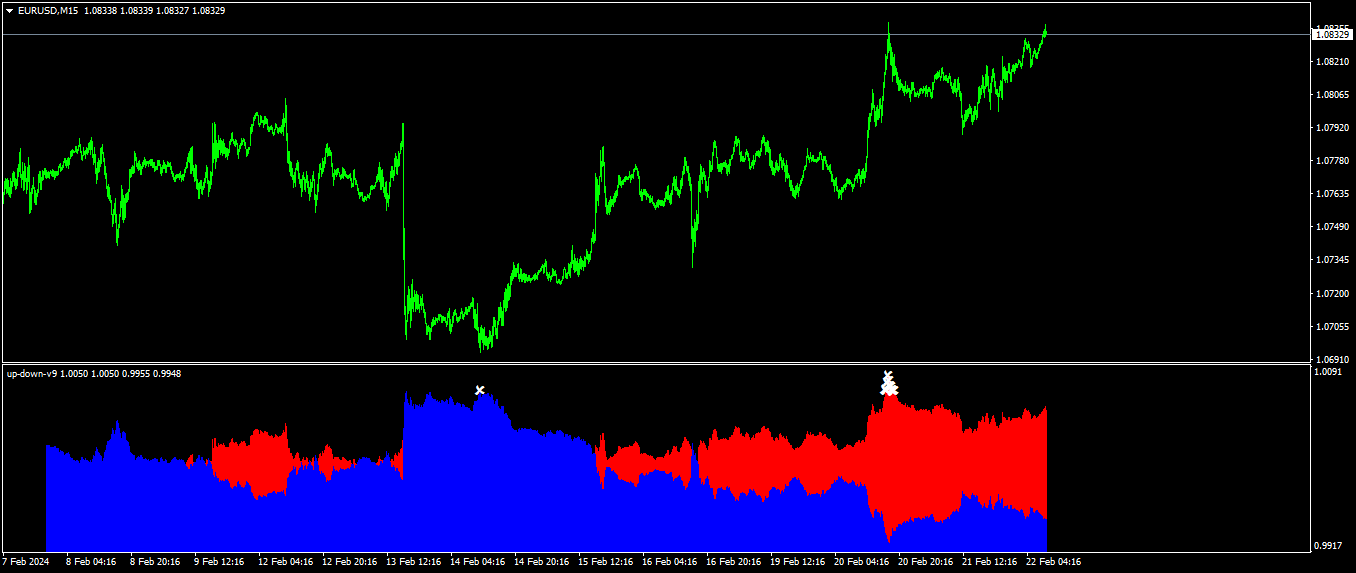
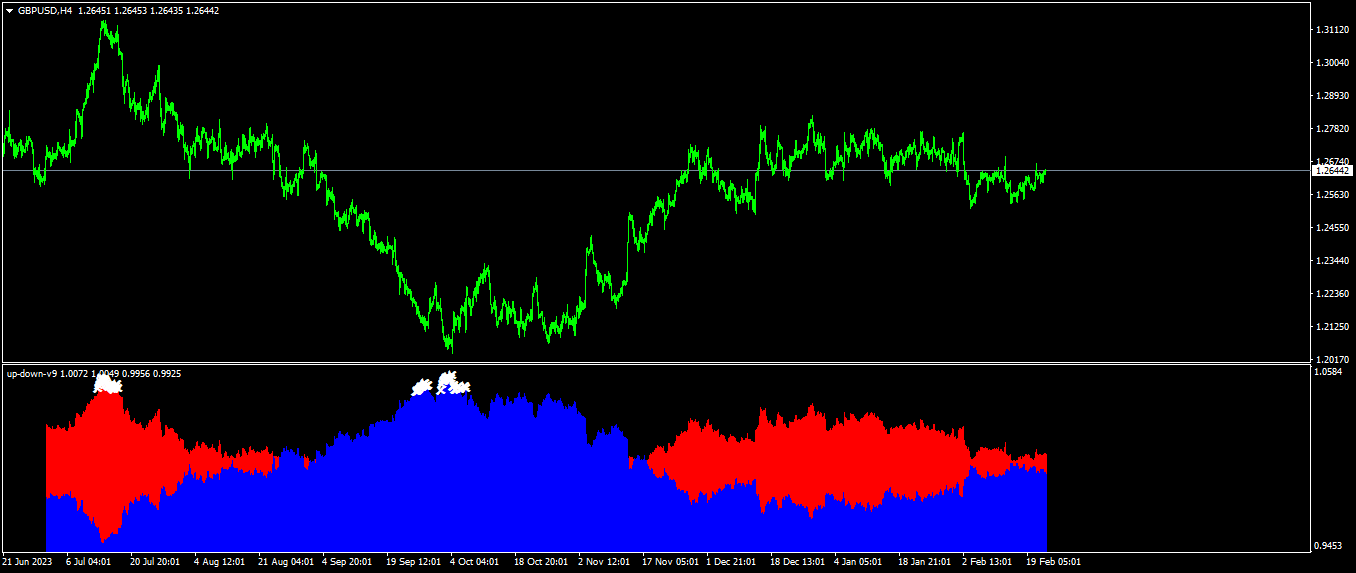
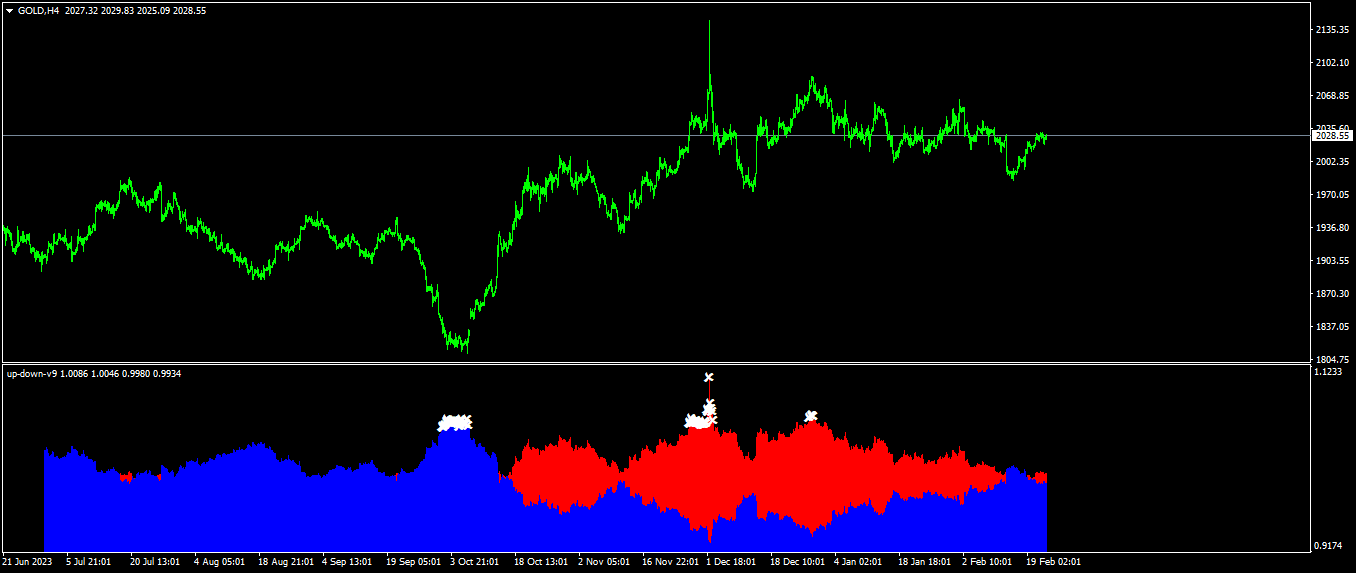
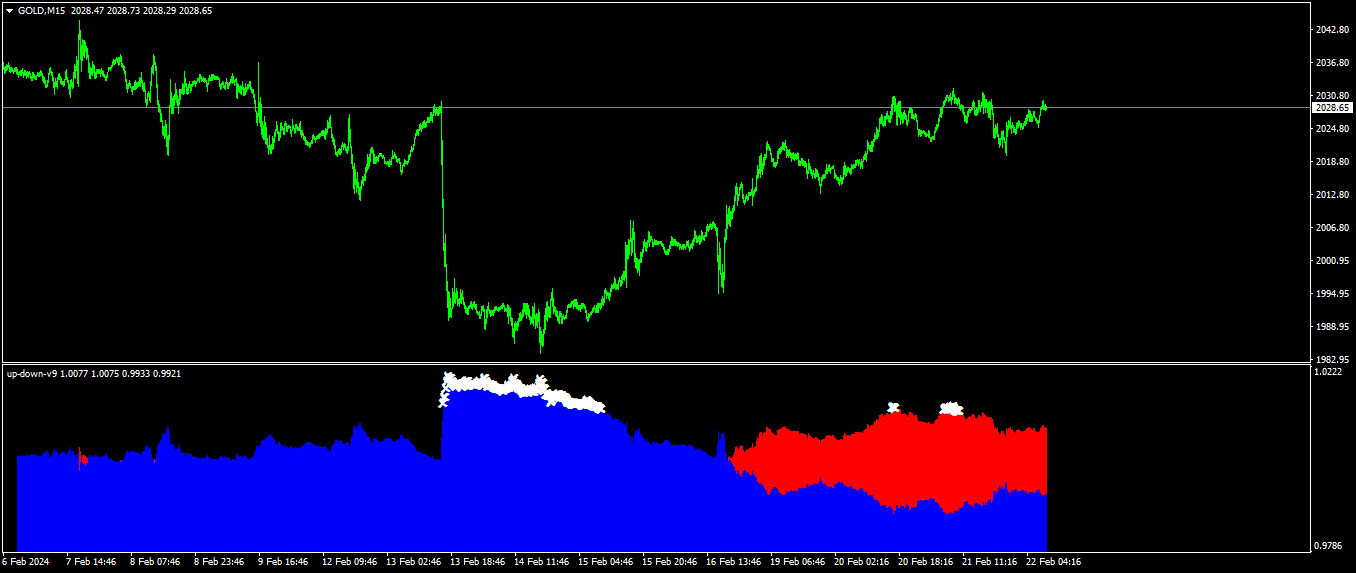
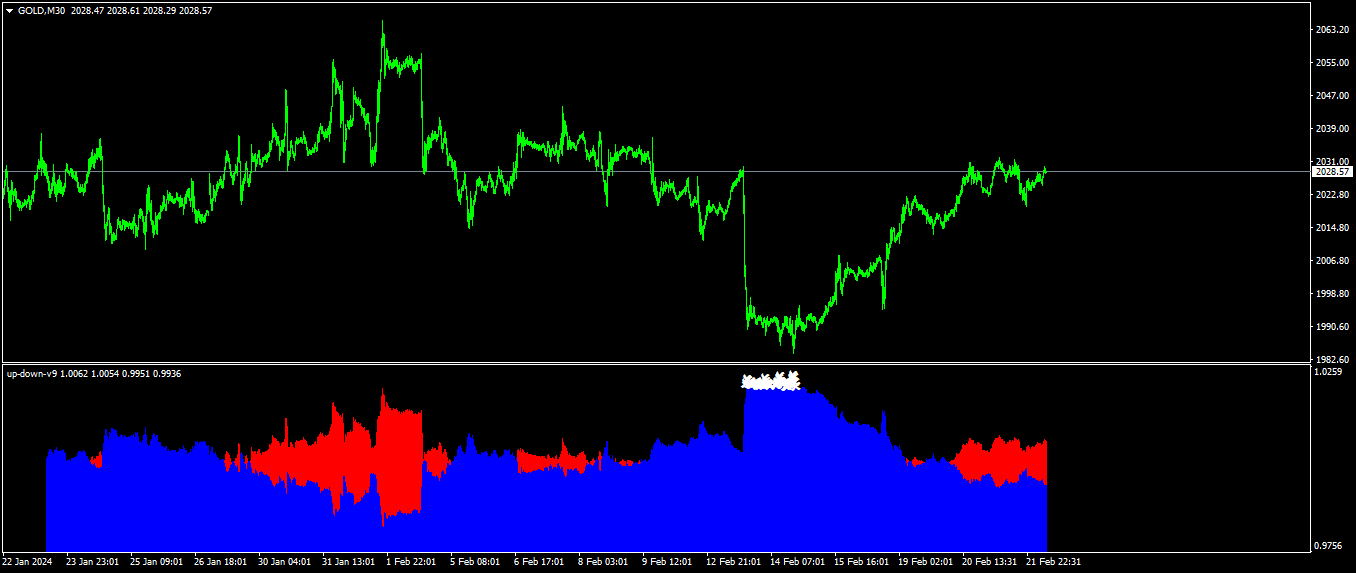
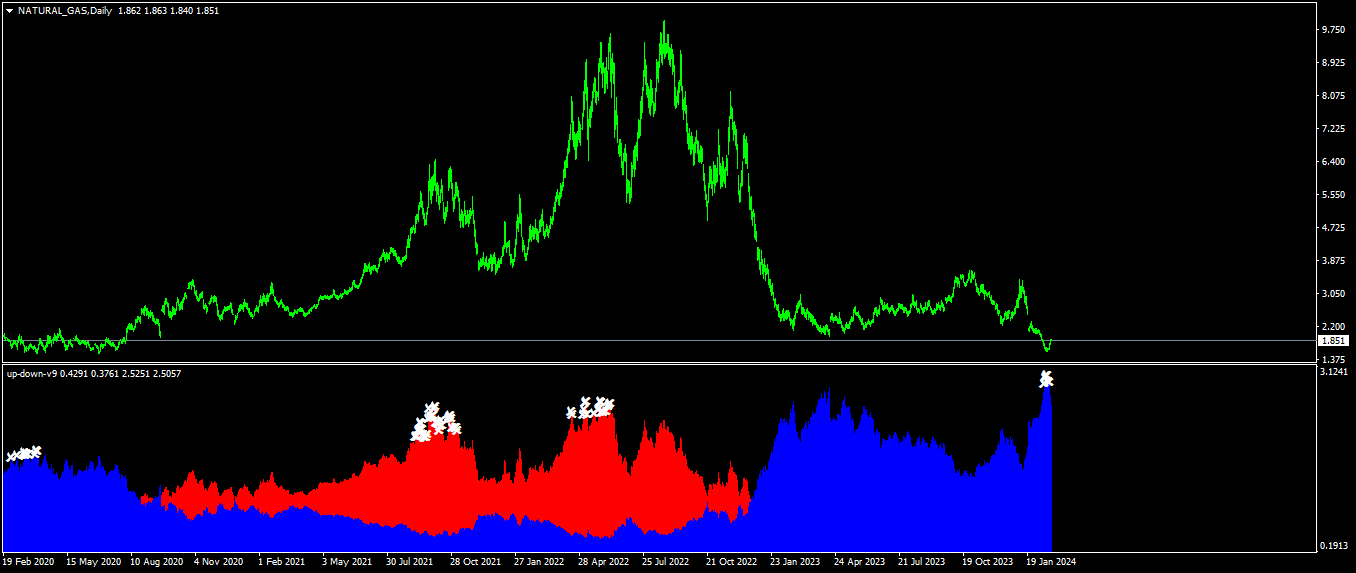
indicator is no repaint trend indicator.
when red stars up to line that is probably end of long trades.
when blue stars up to line that is probably end of down trades.
indicator can use all pairs and lower than weekly charts,
to use weekly chart need to at least 500 bars data on back.and lowering processing value 500.
it is also suitable for 1m charts.
indicator hold long way to go.
there is not too many signals.


I have previously bought a ton of bullshit indicators at ridiculous prices on mql5 but I am pleased to see Guner Koca is simply blowing my socks off. I use this indicator everyday to detect turns in the market. Its better than other up down variations he made.