Monster Harmonic Indicator
- インディケータ
- バージョン: 3.3
- アップデート済み: 24 7月 2018
- アクティベーション: 10

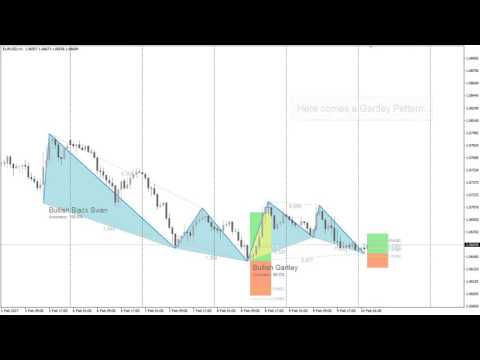
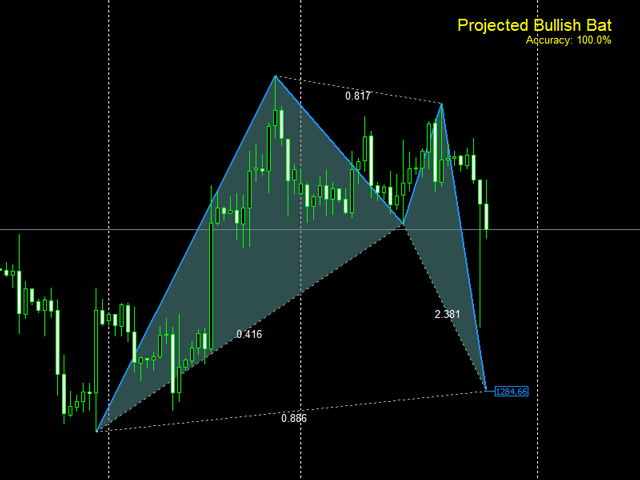
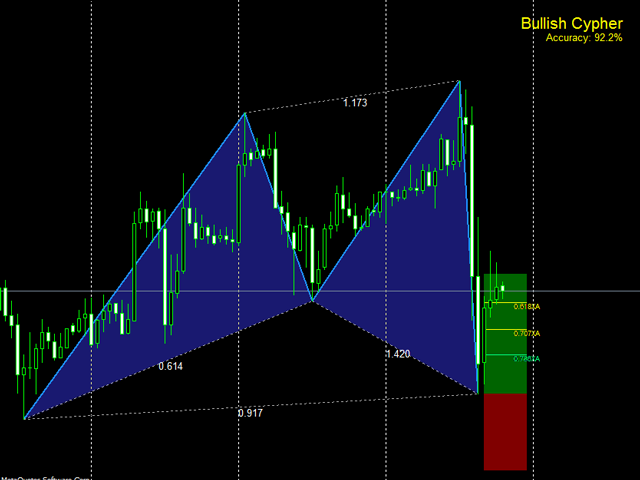
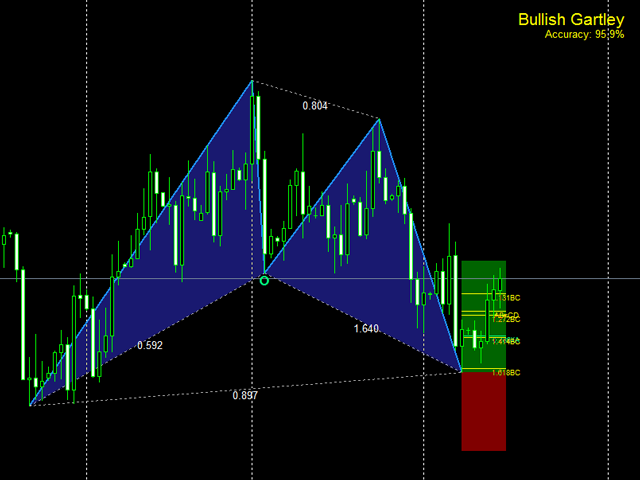
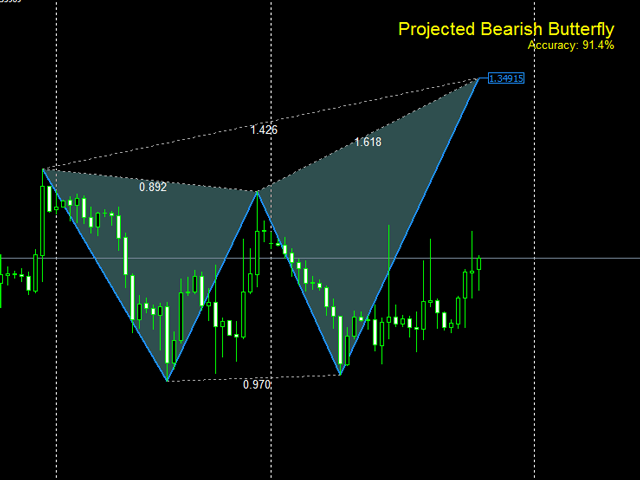
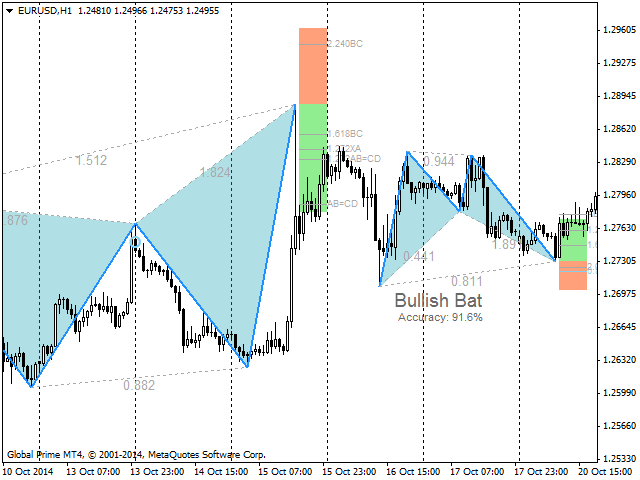
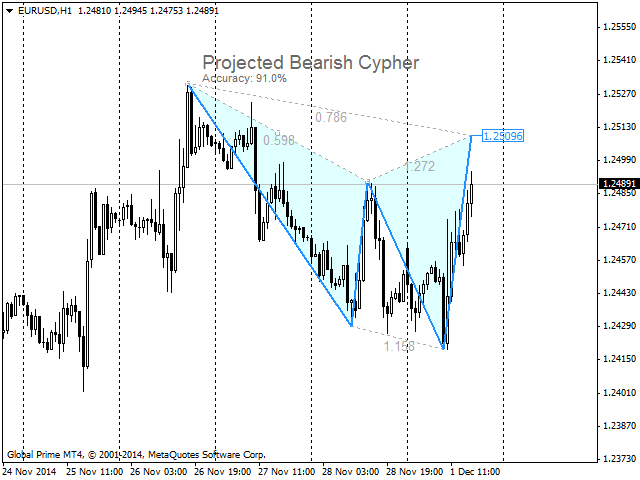
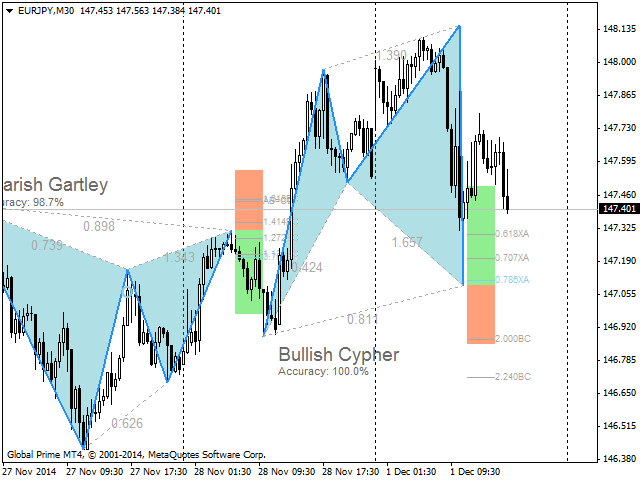
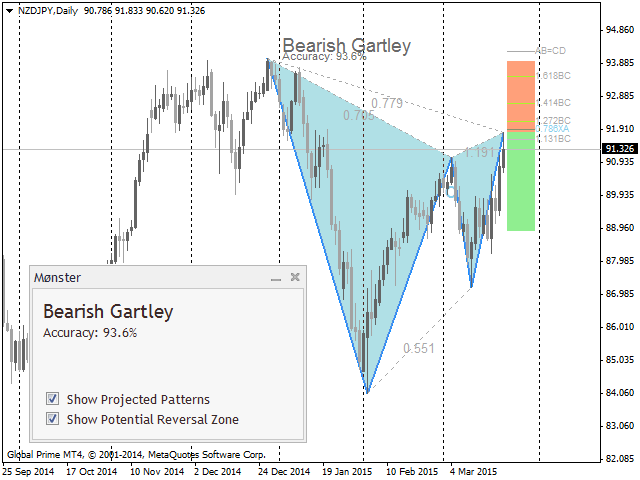
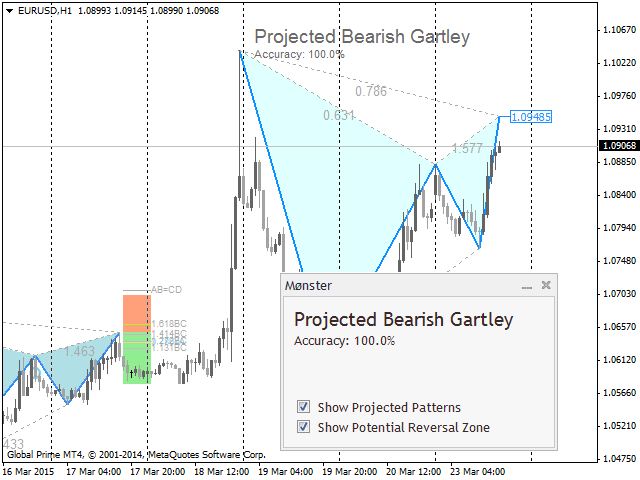
Monster Harmonics Indicator is a harmonic pattern indicator. It recognizes Gartley, Bat, Crab, Butterfly, Cypher, White Swan, Black Swan, Shark and several other patterns. Projected patterns that are not yet completed are recognized, too. Monster even shows the PRZ (Potential Reversal Zone).
Users can add their own user defined patterns to Monster.
Besides the current pattern, Monster also shows all patterns in the symbols history.
Monster will provide alerts for developing patterns.
Settings
Monster's default settings are good enough most of the time. Feel free to fine tune them to your needs.
- Show only current patterns? - set to true to detect current patterns only
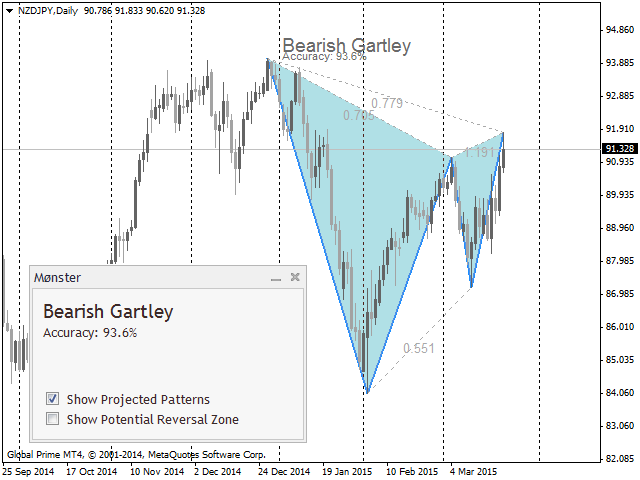
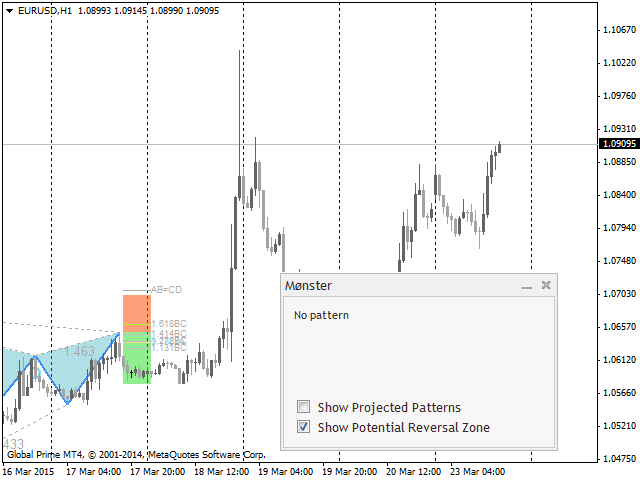
- Show Pattern Projections? - show/hide projected patterns.
- Show Invalidated Patterns? - show/hide invalidated patterns.
- Minimum Accuracy Percent - minimum accuracy percentage for pattern recognition.
- Price Must Touch All Minimum Ratios - set to true to force Monster to touch all minimum ratios, set this if you want the price to touch all minimum ratios and provide even better patterns.
- Show 'PatternName' Patterns? - show/hide specific pattern.
- Show Pattern Label? - set to true to show the pattern label in the chart.
- Show Pattern Accuracy? - set to true to show the pattern accuracy in the chart.
- Show Ratio Labels and Lines? - set to true to show the ratios of the pattern in the chart..
- Show Initialization User Patterns? - set to true to show the results of the initialization of the user patterns in the Experts tab.
- Show Fibonacci Projections in PRZ? - show/hide Fibonacci projections in PRZ.
- Show Perfect Ratio Levels? - show/hide perfect Fibonacci projections in different color.
- Show Risk/Reward in PRZ? - show/hide risk/reward PRZ.
- Show Alerts? - enable/disable all alerts.
- Alert Projected Patterns? - enable/disable alerts for projected patterns.
- Show Screen Alerts? - show/hide screen alerts.
- Email Alerts? - set to true to email alerts.
- Push Alert Notifications? - set to true to push alerts.
- Color Palette - choose a color palette for a 'Dark' or 'Light' background.
- colo(u)rs - you know what to do.
- Zigzag parameters - set ZigZag parameters.
User Patterns
Users can add their own patterns to Monster. Just modify the Monster_UserPatterns.csv to include your patterns. The.csv file can be found in the files folder of the User Data Directory. A sample pattern is already included in the file.
Free Demo
Monster will work in the Strategy Tester. It is best tested in Visual Mode as you can see the detected patterns in the display. Try EURUSD on H1 starting January 1, 2017.
Developers
Monster publishes the current pattern through the iCustom() function. See the sample code at the comment #273 (page 14) of the Comments section.
Loose Ends
Monster will only repaint the last point of the pattern (the D point) to its definition, it follows price.
Full Description
Read this blog post for more information on Monster.


Very helpful for backtesting!