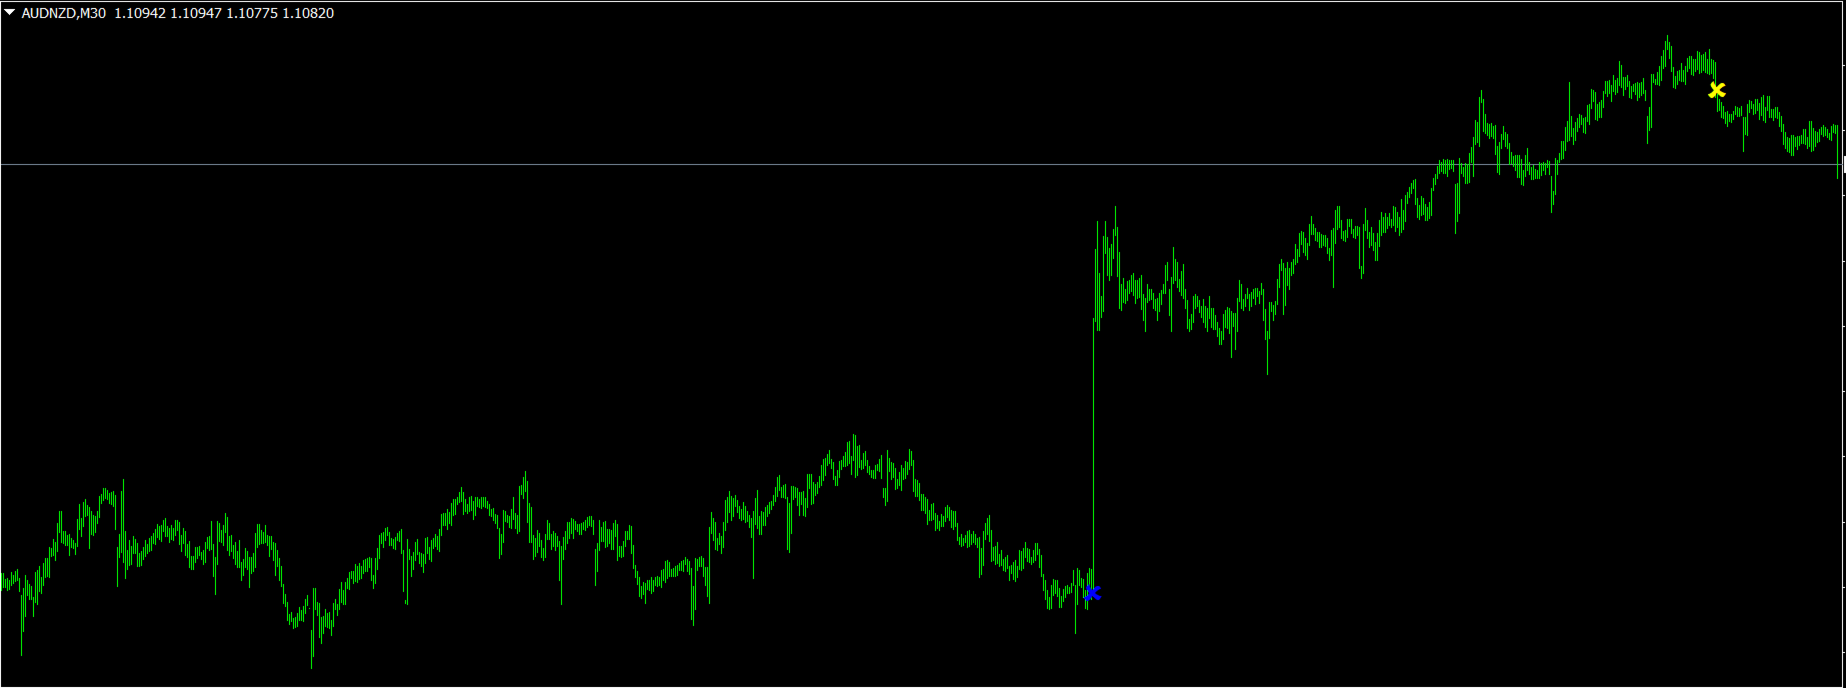
Quantum Regime Indicator
- インディケータ
- バージョン: 2.2
- アップデート済み: 8 3月 2026
- アクティベーション: 20

Product Name: Quantum Regime Indicator
Short Description: A multi-engine structural regime and volatility filter.
Description:
Quantum Regime Indicator (QRI) is a sophisticated technical analysis algorithm designed to identify market structure shifts and volatility regimes. Unlike standard indicators that rely on immediate price action, QRI utilizes a hierarchical logic architecture to filter market noise and identify statistical extremes.
The indicator is built on the philosophy of "Market Regimes." It does not generate signals based on random fluctuations. Instead, it requires a specific sequence of technical events—defined as the Setup, the Gate, and the Trigger—to align before a signal is validated.
Operational Logic
The algorithm processes price data through three distinct logic gates. All three must agree for a signal to be generated:
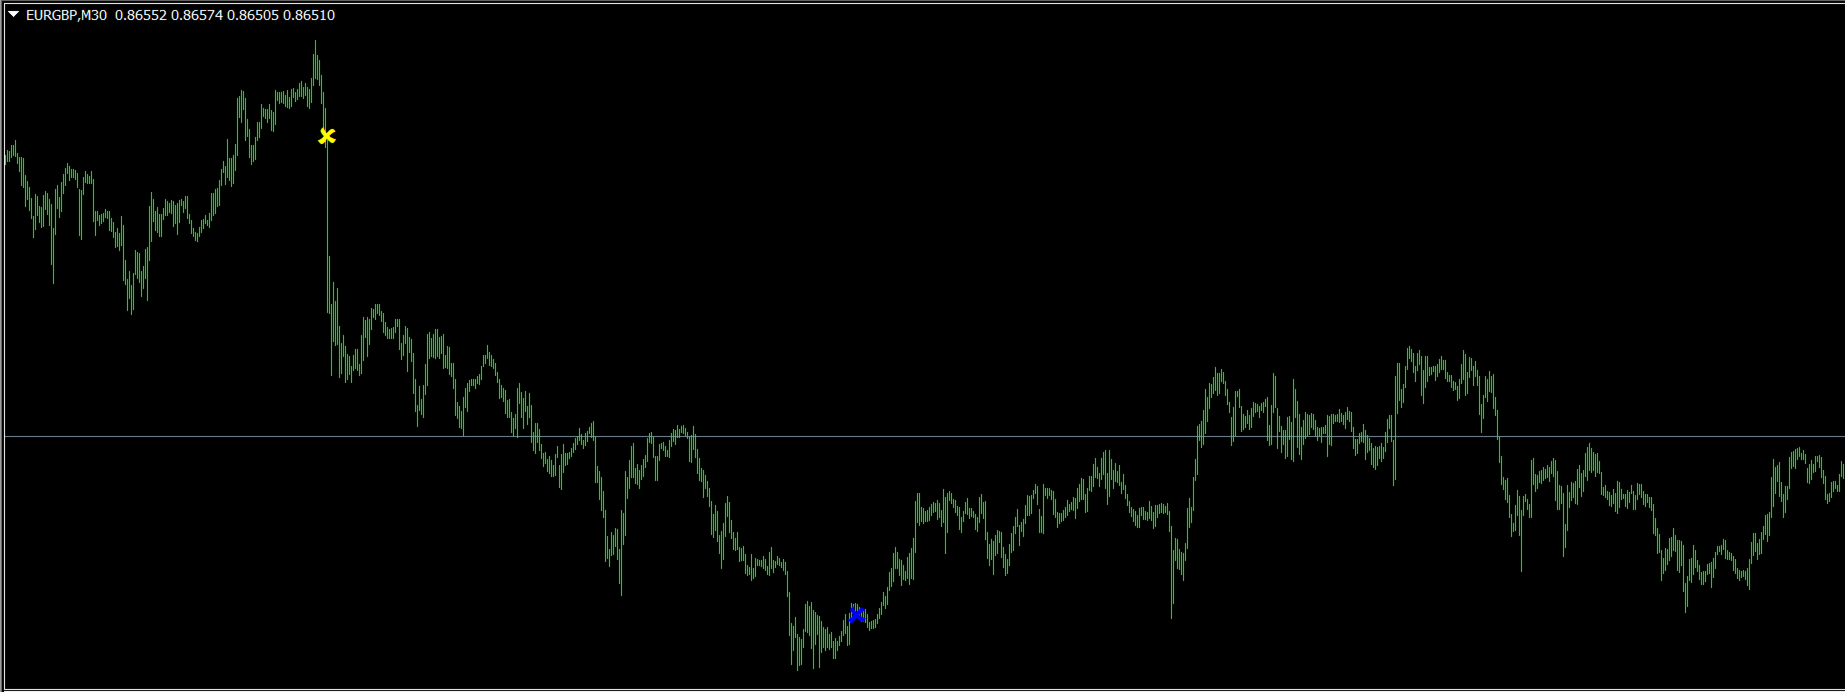
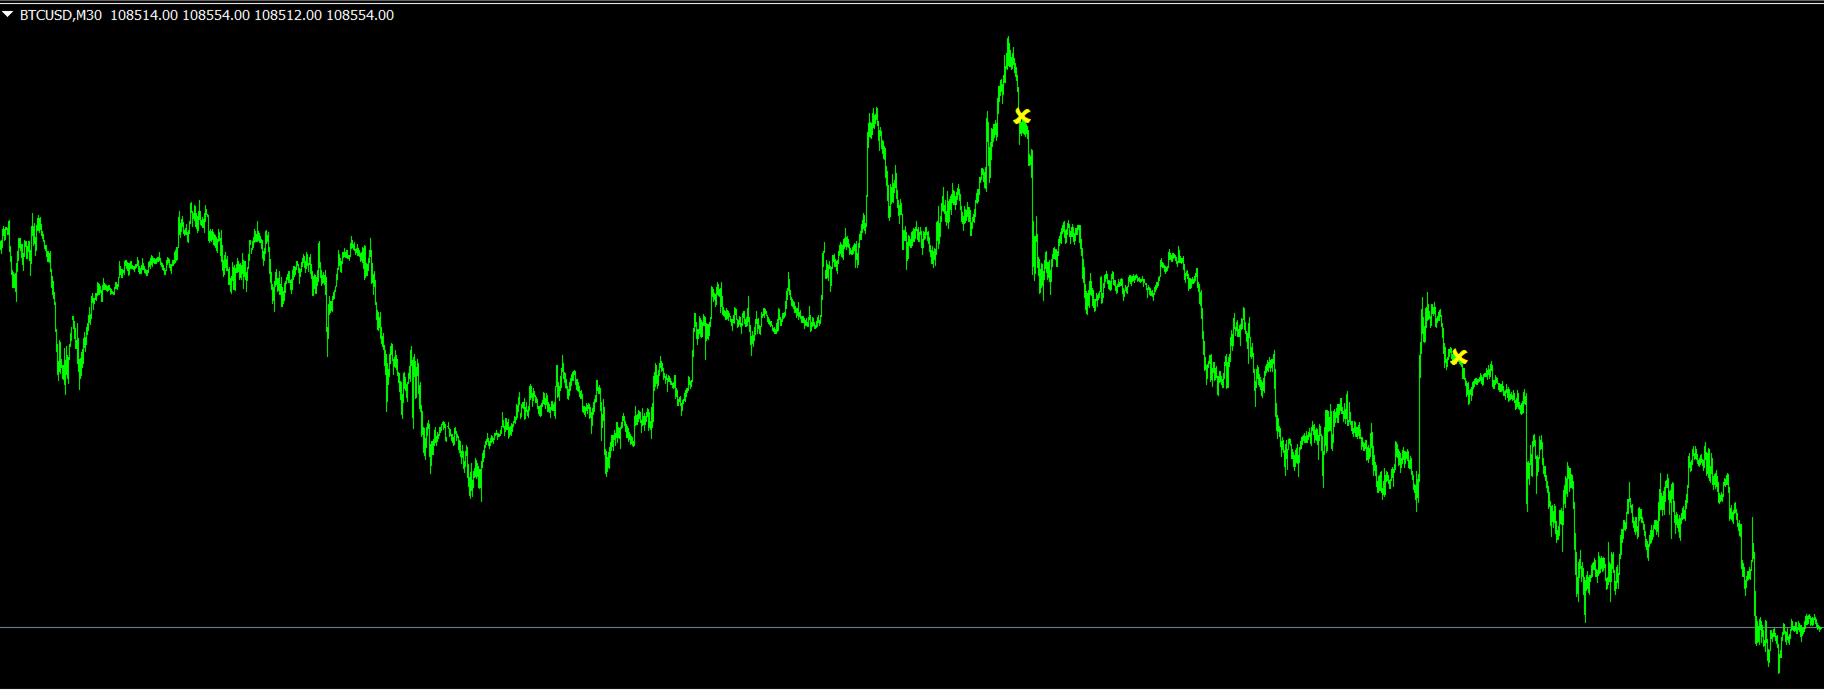
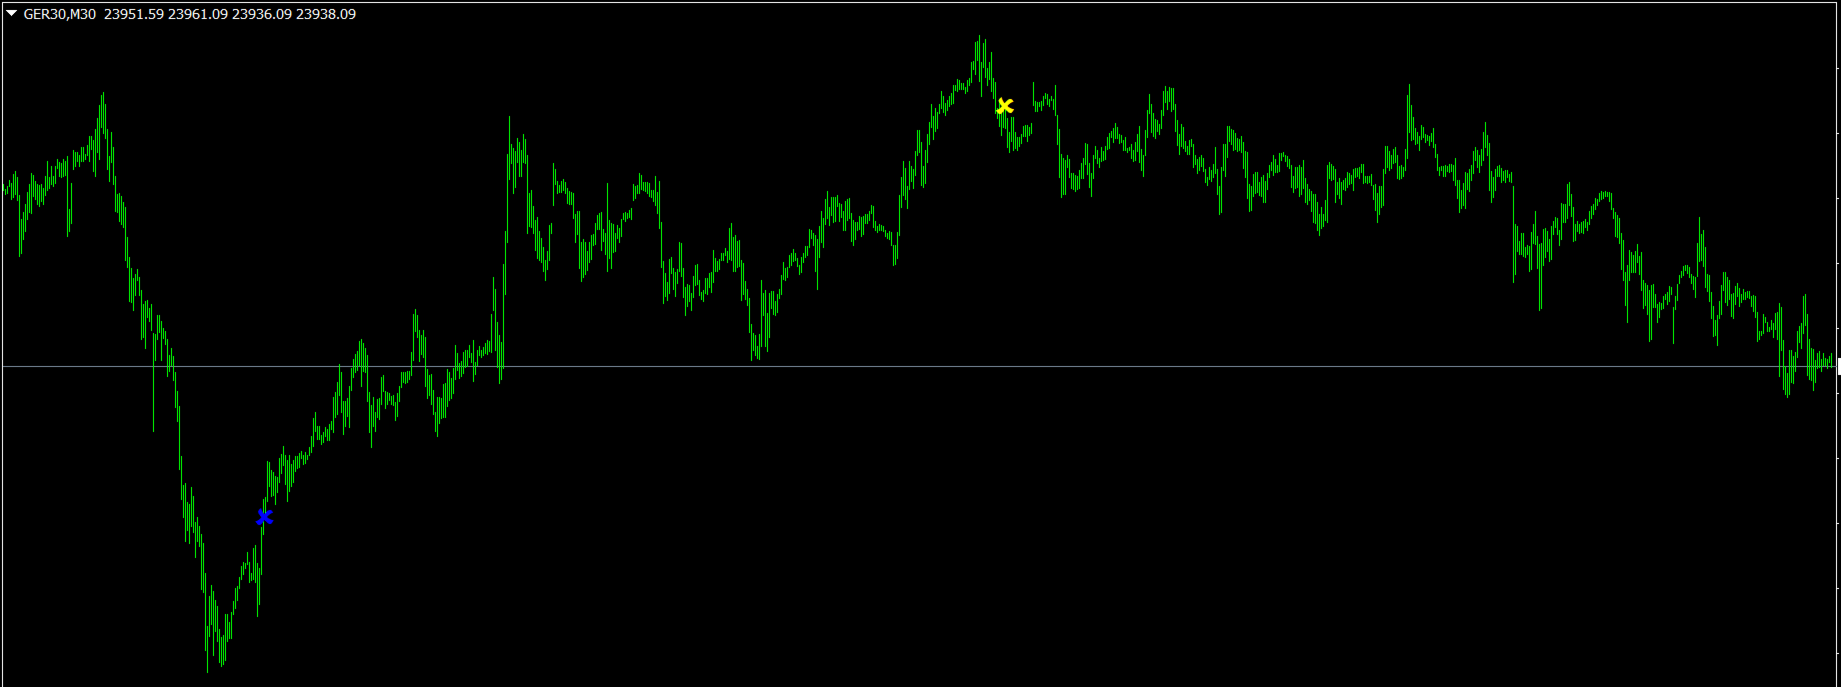
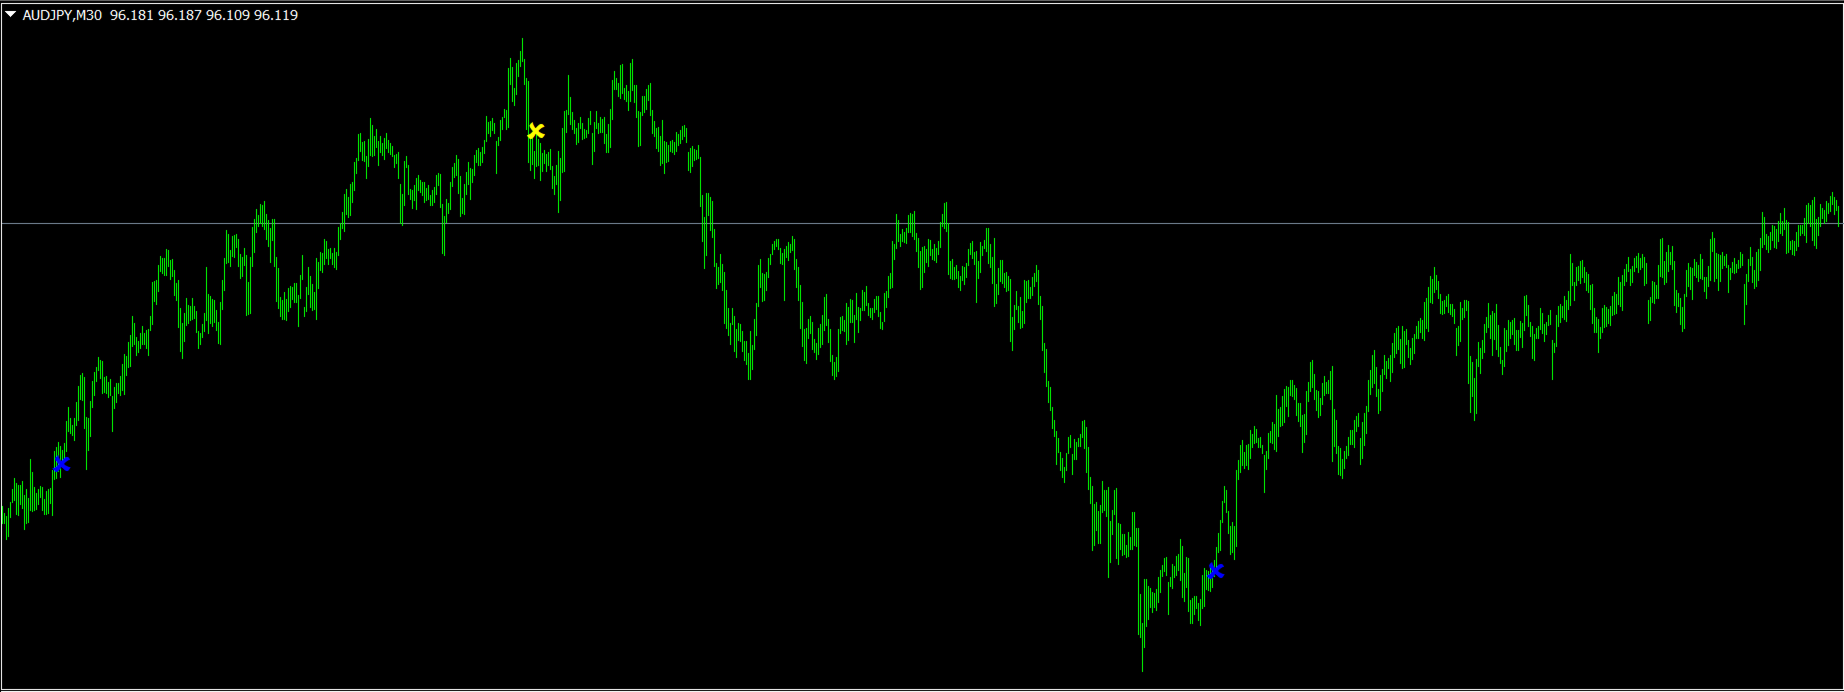
- The Setup (Core Structure): The system scans for a configurable historical high or low (default 500-bar lookback). This identifies when the market structure is statistically overextended.
- The Gate (Volatility Bands): Price must deviate outside of dynamic ATR-based volatility bands. This confirms that the current price movement is a statistical anomaly relative to recent volatility.
- The Trigger (Latch Mechanism): A stochastic-based momentum trigger is applied. This features a unique "Latch and Lookback" logic, allowing the system to retain the signal state for a defined number of bars. This ensures signals are captured even during rapid liquidity wicks.
Key Features
- Sentinal Gate: An internal currency strength aggregator. This module scans multiple currency pairs in the background to calculate the aggregate strength of the base and quote currencies. This logic filters out signals that contradict the global currency flow.
- Multi-Engine Architecture: The indicator contains three independent logic engines (E1, E2, E3). Users can enable or disable specific engines to suit different market conditions (Trend Following vs. Mean Reversion).
- Signal Retention: The "Latch" logic prevents signal flickering. Once a valid trigger condition is met within the volatility gate, the signal is locked for a user-defined period.
- Non-Repainting: All signals are permanent once the candle closes.
Parameters and Settings
The indicator is highly customizable to fit different assets:
- HistoryBars: Controls how much data is processed. Default is set to 100 to maximize performance for the Sentinal Gate currency scanner. Increase this value for backtesting.
- Enable_E1 / E2 / E3: Toggles the specific logic engines on or off.
- Core_Period: Defines the lookback range for identifying market extremes.
- Bands_Multiplier: Controls the width of the volatility gate. Higher values require greater deviation for a signal to fire.
- Use_SentinalGate: Enables the aggregate currency strength filter.
- Stoch_LTF_LatchBars: Defines the duration the system "remembers" a momentum crossover.
Recommendations
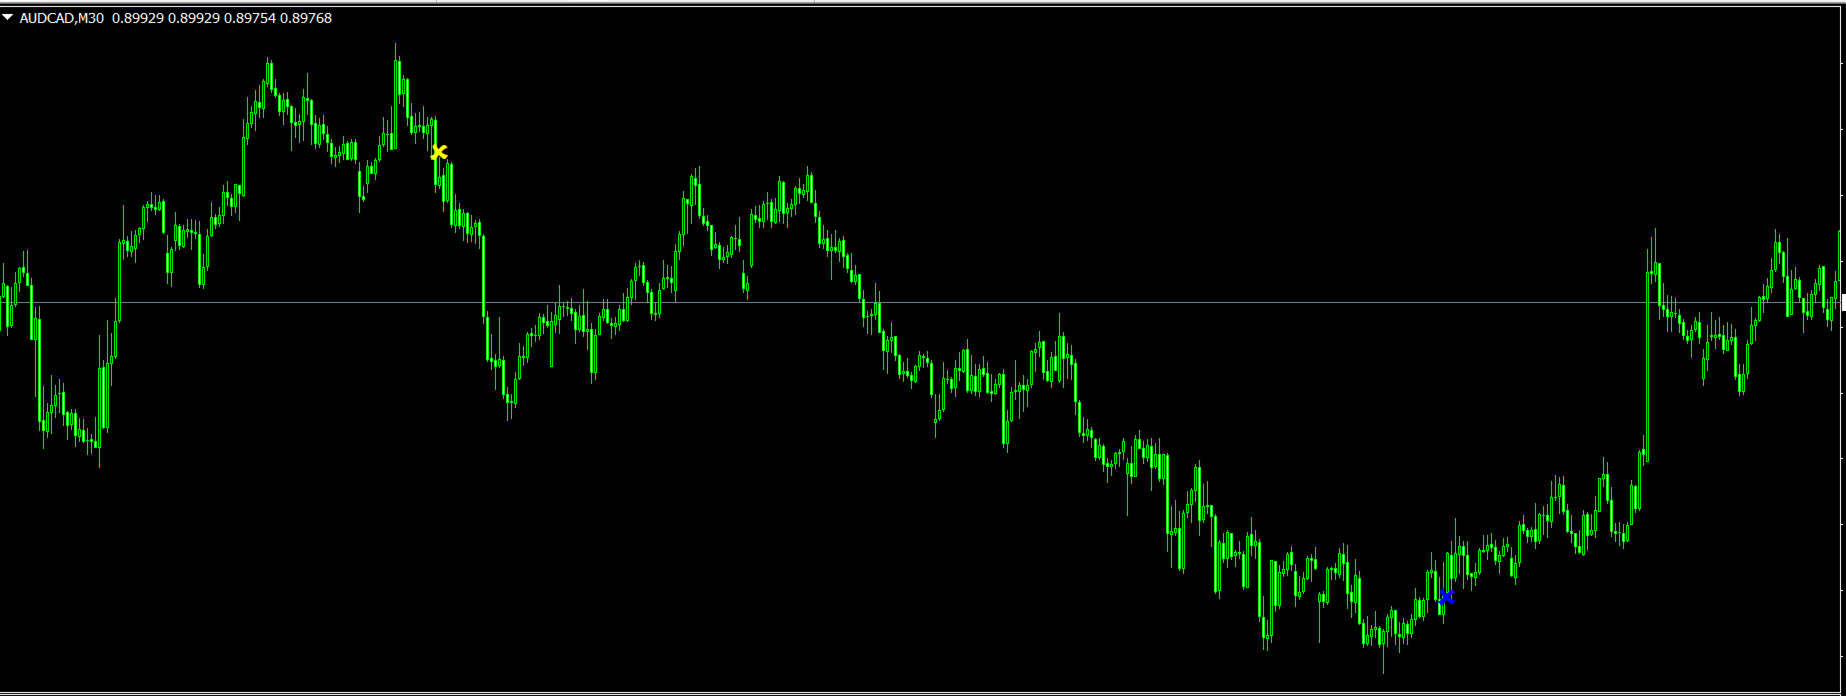
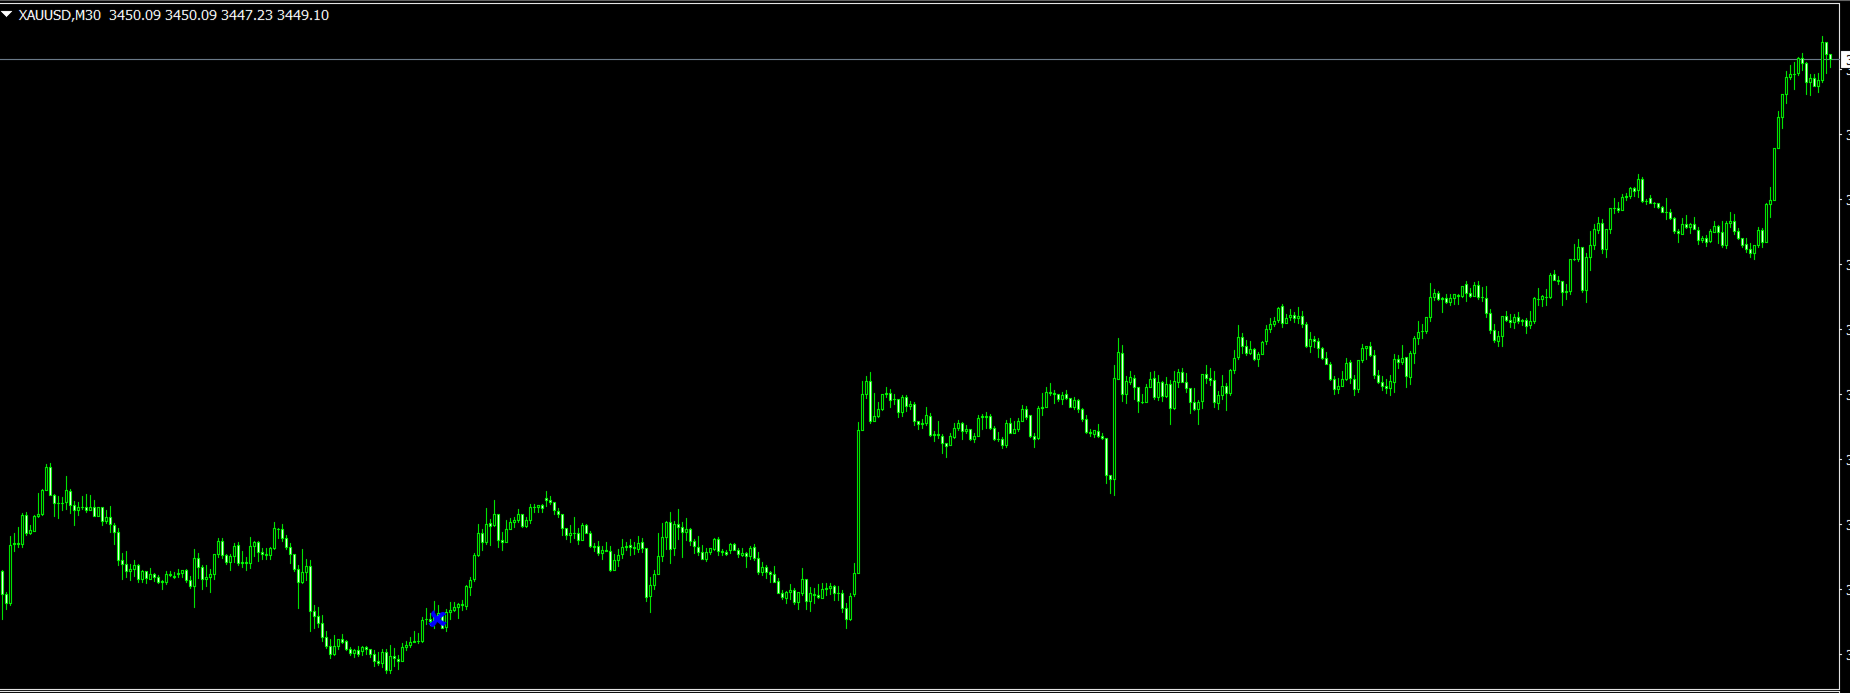
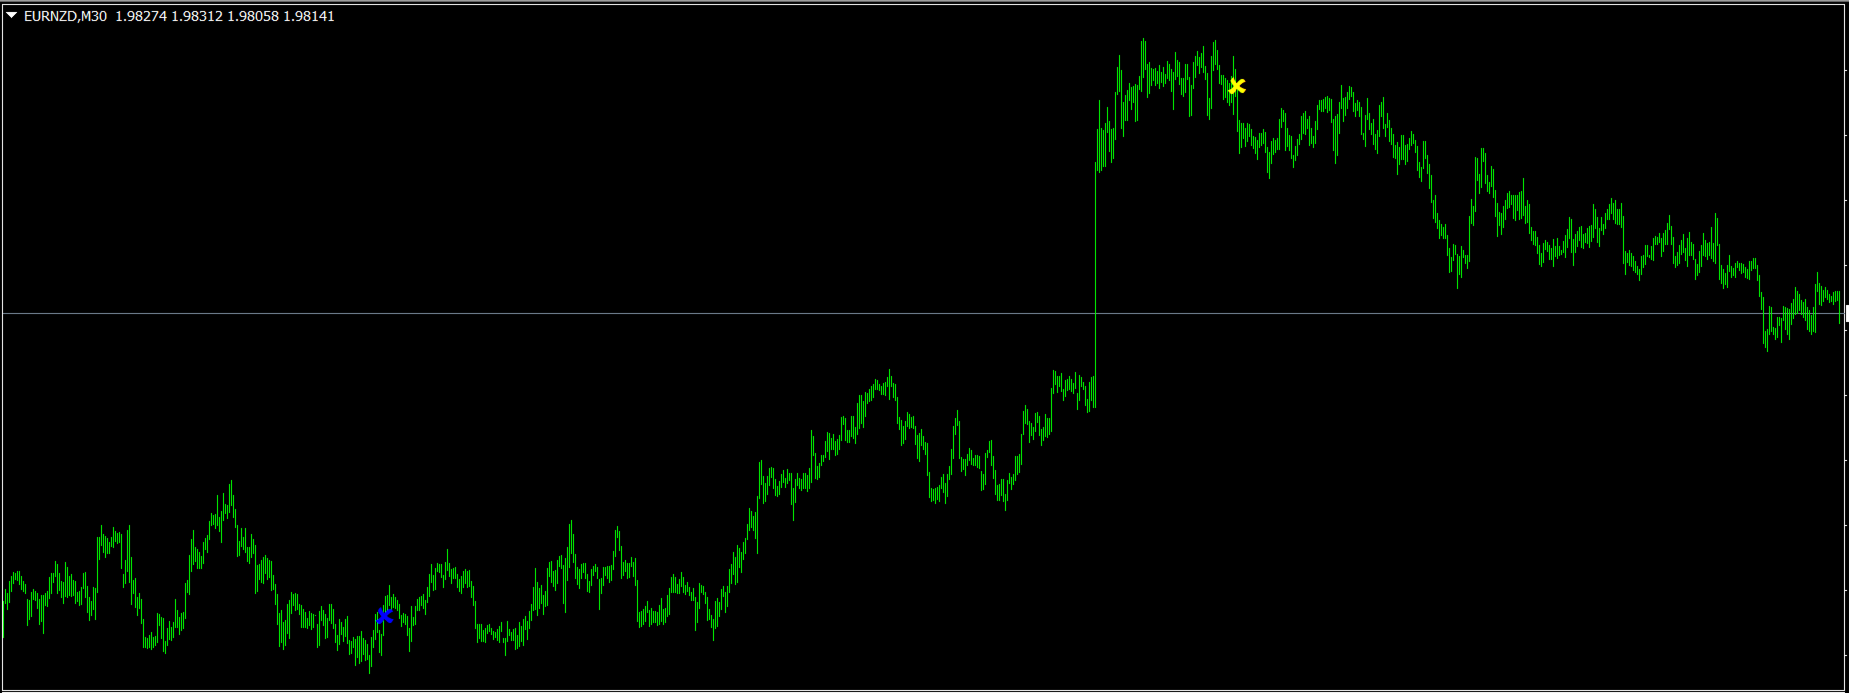
- Timeframes: The logic is optimized for m30, H1, H4 timeframes to identify significant structural shifts.
- Assets: Designed for Major Forex Pairs, Gold (XAUUSD), and Indices.
- Performance: Due to the heavy calculation required for the Sentinal Gate (currency strength scanning), it is recommended to keep HistoryBars low (100-500) during live trading.
Notes
To test the full functionality of the software, a one-month rental option is available. This product is a technical analysis tool. Past performance is not indicative of future results. For specific set files or questions regarding the logic, please use the Comments section.