YouTubeにあるマーケットチュートリアルビデオをご覧ください
ロボットや指標を購入する
仮想ホスティングで
EAを実行
EAを実行
ロボットや指標を購入前にテストする
マーケットで収入を得る
販売のためにプロダクトをプレゼンテーションする方法
MetaTrader 5のためのエキスパートアドバイザーとインディケータ - 43
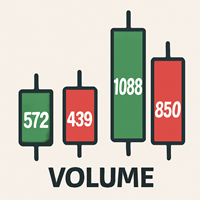
Volume Data on Candles Indicator for MetaTrader 5 Maximize your trading insights with the Volume Data on Candles indicator for MetaTrader 5. This powerful tool provides real-time volume data directly on each candle, allowing you to identify significant shifts in market activity. When the volume of a candle exceeds the average of the last 50 candles, it will be clearly highlighted , ensuring you don't miss out on potential high-volume movements. Key Features: Real-Time Volume Data : Displays volu
FREE

With Break Even Trader placed onto your chart, it will automatically place the stop loss and take profit levels when you open a buy or sell order. And when you are in profit by the amount defined in user settings, it will automatically move your stop loss to that break even level, thereby protecting your trade from a loss. Features :
Simple to trade with you just enter your trade it will place the stop loss and take profit as input in user inputs. Sends you an alert when your trade is in profit
FREE

Fast CopyTrade — Advantages, Features & Inputs Overview
Fast CopyTrade is a fast, local-only, DLL-free trade copier for MetaTrader 5. It instantly copies OPEN, MOD (SL/TP) and CLOSE from a Provider instance to one or more Receiver instances running on the same PC. The EA uses the MT5 Files folder for secure local messaging, requires no external files to distribute, and is Market-compliant. Advantages (simple) Fast local copying with very low latency when Provider and Receiver run on the same PC
FREE

このプロジェクトが好きなら、5つ星レビューを残してください。 機関が大きなボリュームを取引するので、それらが試してみることは珍しくありません
特定のパーセンテージレベルでポジションを守る これらのレベルは、あなたが使用できる自然なサポートと抵抗として役立ちます
取引を入力するか、ポジションに対する危険性を認識する。 一般的に使用されるパーセンテージの例は、EURUSDの0.25%と0.50%です。
毎週、スクリーンショットでこの例を見ることができます。 このインジケータを使用すると、以下の割合の変動を描画することができます。 日。 週。 月 日 クォーター。 生年月日
FREE
このEAは、シーケンシャルで制御されたマルチンゲールを使用して、失われたトレードを回復します。最初のトレードが回復するまでロットサイズを増やしながら連続したトレードを行い、わずかな利益をもたらします。初期取引の管理から回復まで、手間のかからない完全な取引フレームワークを提供します。 EAはマルチンゲールを実装していることに注意してください。これは、後で回復するバランス損失をとることを意味します。 [ ユーザーガイド | インストールガイド | 更新ガイド | トラブルシューティング | よくある質問 | すべての製品 ]
特徴 使いやすく、監督
チャートボタンを使用して簡単に取引
制御および事前計算されたリスクエクスポージャー 多くの自動入力戦略を実装します カスタム指標を使用して取引することができます すべての注文はストップロスで発注されます 1,000ドルからのマイクロアカウントの取引 外国為替セッションによる取引のフィルタリング NFA / FIFO準拠
始める方法 EAを任意のチャートとタイムフレームにロードします リスクが許容されるまで設定を編集します チャートボタン
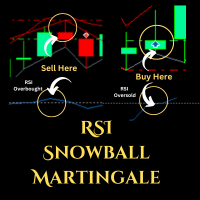
Expert Advisor (EA) that utilizes the basic Dow Theory strategy along with RSI for opening positions, and employs support and resistance levels from the Zigzag indicator as stop-loss and take-profit points, you can follow these guidelines: Dow Theory Strategy : This involves analyzing trends using the Dow Theory principles, mainly focusing on identifying primary trends (bullish or bearish) and secondary trends (corrections). You'll need to implement rules for identifying these trends based on pr
FREE

This MT5 indicator provides real-time updates of classic Renko charts. Renko charts focus on price movement, filtering out noise and highlighting trends. What are Renko candles? Renko charts display price movement using "bricks" of equal size, ignoring time. A new brick is drawn only when the price moves by a specified amount. They help visualize trends by removing time-based noise.
Parameters - BrickSizePoints (20): Renko brick size in points - HistoryDepthSec (3600): Historical data to ini
FREE
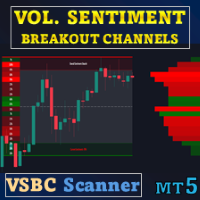
スペシャルオファー : ALL TOOLS 、1本あたりわずか $35 ! 新しいツール は、 最初の 1 週間 または 最初の 3 本の購入 まで $30 となります! Trading Tools Channel on MQL5 :最新情報を受け取るために、私の MQL5 チャンネルに参加してください Volume Sentiment Breakout Channels は、ダイナミックな価格チャネル内の出来高センチメントに基づいてブレイクアウトゾーンを可視化するインジケーターです。純粋なテクニカルなブレイクだけを見るのではなく、買い/売りの出来高がレンジ・コンソリデーション領域の中でどのように分布しているかに焦点を当て、価格がチャネルを離れるたびに、買い手と売り手の支配の移り変わりを表現します。 各圧縮ゾーンの内部で、インジケーターは影響度の高いエリアを特定し、買い方と売り方の優勢度合いを測定し、注文フローの強さをチャート上で継続的に更新します。出来高センチメントによって「重み付け」されたチャネルを価格が上抜けまたは下抜けしたとき、そのイベントは単な

Using the Stochastic Oscillator with a Moving Average is a simple but very efficient strategy to predict a trend reversal or continuation.
The indicator automatically merges both indicators into one. It also gives you visual and sound alerts.
It is ready to be used with our programmable EA, Sandbox, which you can find below: Our programmable EA: https://www.mql5.com/en/market/product/76714 Enjoy the indicator!
This is a free indicator, but it took hours to develop. If you want to pay me a coff
FREE

SUPERTREND INDICATOR MT5 Developer: gedeegi General Description GEN SmartTrend Signal is a comprehensive technical indicator for MetaTrader 5 (MT5), focused on trend identification and automated risk management. It utilizes a refined SuperTrend -based algorithm powered by the Average True Range (ATR) to determine the primary trend direction. What sets this indicator apart is its integrated trade management features displayed directly on the chart, including visual placement of Stop Loss (SL)
FREE
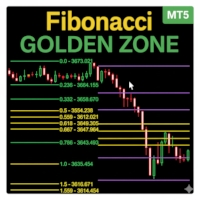
Fibonacci Sessions インジケーターは、精密なスキャルピングと日中取引戦略のために設計された強力なトレーディングツールです。 ニューヨーク、ロンドン、アジアの各セッションの主要なフィボナッチレベルを自動的にプロットし、トレーダーに主要市場セッションにおける価格変動の明確なビューを提供します。 各セッションでは、価格が最も反応するユニークな「ゴールデンゾーン」が強調表示されます。 これにより、反転、ブレイクアウト、継続パターンのための非常に信頼性の高いゾーンが作成されます。 インジケーターは、価格がどのように一つのゴールデンゾーンから別のゴールデンゾーンへと頻繁に移動するかを視覚的に示し、トレーダーが安定したチャンスを捉えるのに役立ちます。 XAUUSDのM5タイムフレームに最適化されており、他の通貨ペアや世界の指数でも優れたパフォーマンスを発揮します。 ゴールド、通貨ペア、または株価指数を取引する場合でも、このセッションベースのフィボナッチマッピングは、高確率の取引ゾーンを特定する上で追加の優位性を提供します。 赤い線: 極限利益ターゲットレベル。 黄色
FREE

About:
The Nadaraya-Watson Envelope is a sophisticated yet practical technical indicator that helps traders identify overbought and oversold conditions using advanced kernel regression methods. This is the MT5 only Version.
For MT4 Version go here: https://www.mql5.com/en/market/product/158640/
Key Features ATR-Based Bands: Three upper and three lower bands provide graduated overbought/oversold zones Logarithmic Scale Calculation Center Line - bullish (teal) or bearish (red)
What is the Nad
FREE

The Market Momentum indicator is based on the Volume Zone Oscillator (VZO), presented by Waleed Aly Khalil in the 2009 edition of the International Federation of Technical Analysts journal, and presents a fresh view of this market valuable data that is oftenly misunderstood and neglected: VOLUME. With this new approach of "seeing" Volume data, traders can infer more properly market behavior and increase their odds in a winning trade.
"The VZO is a leading volume oscillator; its basic usefulness
FREE
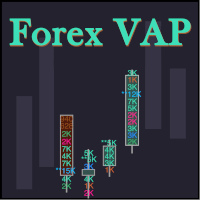
What do you see inside a candle? How to interpret the fight between bulls and bears? The candlestick chart brings a lot of information, but the volume is lacking in the candlestick body. This is where the Forex Volume At Price Expert Advisor comes in. This advisor searches for a set of recent trades, calculates the buy and sell attack volumes and prints on the candles, the volume value in each price range. You can also define up to ten colors to filter volumes and make it easier to
FREE

Msx AI Scalper EA— Lite Version Msx AI Scalper EA is a free Expert Advisor created to demonstrate the Double Smoothed Hull Moving Average (DSHULL) core engine used in MSX brand professional trading systems. This EA focuses only on the core logic of: Buy entry Buy exit Sell entry Sell exit based on confirmed Double Smoothed Hull MA color reversals , executed strictly on closed candles to avoid repainting behavior at the Expert Advisor level. How the EA Works (Core Methodology) The EA internal
FREE

Pivot Point Supertrend (corresponds to Pivot Point Super Trend indicator from Trading View) Pivot Point Period: Pivot point defined as highest high and highest low... input 2 = defining highest high and highest low with 2 bars on each side which are lower (for highest high) and are higher (for lowest low calculation) ATR Length : the ATR calculation is based on 10 periods ATR Factor: ATR multiplied by 3
FREE

Dominator Gold Bot – Expert Advisor for XAUUSD (H1) Dominator Gold Bot is a fully automated trading system developed specifically for XAUUSD on the H1 timeframe .
The EA applies directional volatility analysis, session-based logic, and adaptive risk control to identify structured movement during high-liquidity periods.
It has been designed for stable long-term trading with controlled risk exposure. Important Notice The latest optimized set file is available in the Comments section.
Please downlo
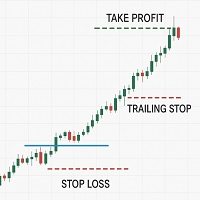
Note: All inputs of this EA are designed in Arabic for easier configuration and management
Auto Smart Trade Manager EA Ar automatically manages trades on MetaTrader 5. Sets Stop Loss (SL) and Take Profit (TP) , supports Trailing Stop to secure profits, and includes Equity Protection . Smart management for all trades or by Magic Number and symbol, with full control over slippage and risk. Trading involves high risk and you may lose part or all of your capital. Use this EA cautiously, and set Sto
FREE

Think of the Super Fractal Indicator as the Bill WIlliams Indicator on Steroids. Indicator Abilities: 1. Adjust Candle around Fractal High or Low. 2. Adjust Lookback period and only plot for a specific number of history candles avoiding cluttering your trading desk. 3. The Indicator uses buffers so you call and use it from any EA.
Note : The higher the candles around Fractal, the stronger the Turning point anfd viceversa is true.
FREE

Renko Trading Bot EA – MetaTrader 5 用レンコチャート自動売買アドバイザー 概要 Renko Trading Bot EA は、20 世紀初頭に日本人トレーダーによって紹介された「レンコチャート手法」に基づく、プロフェッショナルな自動売買ソリューションです。本 EA は、レンコ波動パターンを高精度で識別・売買し、レンコブリック(価格レンジ)を基準とした価格アクション理論を最大限に活用した堅牢なトレーディング環境を提供します。 Renko Trading Bot EA は、価格の「重要な動き」だけを表示する独自のチャート構築方式を採用しており、市場ノイズや時間要素を完全に排除します。明確なエントリーシグナルと最適化されたリスク管理を要求するトレーダーに最適なアルゴリズムです。 レンコ分析システムには、トレンド方向、現在のブリックレベル、主要な反転レベルを動的に追跡するアルゴリズムが搭載されており、あらゆる金融市場で高い精度を実現します。 主な特徴 • 高度なレンコパターン認識 – BrickSize(ブリックサイズ)と ReversalBricks(反転

Automatic Trend Line Fit. This indicator automatically plots the straight line and parabolic (curved) trend to any symbol at any timeframe. The plotted straight line is a good indication of the current trend and the curved line is an indication of a change momentum or change in the current trend. Plotting the straight line over about 2/3 the number of candles as the curved line is usually a good way to determine entry and exit points as it shows the current trend and momentum of the market. This
FREE
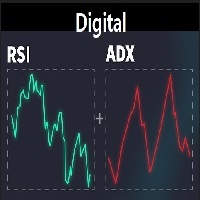
A lightweight digital indicator that combines the most important momentum tools directly on the chart. It displays real-time values of RSI, ADX, +DI, −DI, and DI Spread in a clean and compact format, without drawing any lines or graphical objects on the chart. Designed to provide fast insight into trend strength and the balance between buyers and sellers, without the need to open additional indicator windows. Fully customizable—font, size, and screen position can be adjusted easily.
FREE

Swift Close Utility for closing Buy and Sell positions in MetaTrader 5. Purpose
This utility is designed for batch closing of Buy or Sell positions on the current symbol. Operating Modes Close BUY — Close all open Buy positions on the current symbol. Close SELL — Close all open Sell positions on the current symbol. Magic Number Filtering
The MagicNumber parameter allows the utility to target only positions opened by an Expert Advisor with the specified magic number. If MagicNumber =
FREE

Product Name: Harmonic Confluence Indicator (Basic Edition) !!!—-Leave a 5-star review and receive a free indicator version with trade levels (limited to the first 20 people only)——!!! Headline: Automated Harmonic Pattern Scanner with Supply & Demand Confluence. Description: Unlock the power of geometric market structure with the Harmonic Confluence Indicator (Basic Edition) . This powerful tool is designed to automatically scan your charts for high-probability reversal zones based on validated
FREE

This indicator is designed to detect high probability reversal patterns: Double Tops/Bottoms with fake breakouts . This is the FREE version of the indicator: https://www.mql5.com/en/market/product/29957 The free version works only on EURUSD and GBPUSD! Double top and bottom patterns are chart patterns that occur when the trading instrument moves in a similar pattern to the letter "W" (double bottom) or "M" (double top). The patterns usually occur at the end of a trend and are used to signal tren
FREE
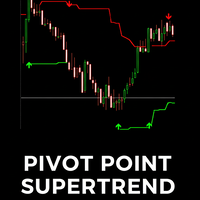
The Pivot Point Supertrend indicator is a technical analysis tool designed for the MetaTrader 5 (MT5) platform. It combines two popular analytical methods: Pivot Points: Uses significant historical price highs and lows to identify potential support and resistance zones. These points are objective and stable. Supertrend: A well-known trend-following indicator that helps identify the current market trend and provides dynamic stop-loss levels. Indicator's Goal: By using the stability of Pivot Point
FREE

Session Killzone Indicator
Indicator that helps you to identify the killzone times of both London and NewYork sessions which usually is the most times for high volatility and taking liquidity from the market. Killzone times are configurable through indicator parameters. The indicator adjusts the range of the killzones based on the daily trading range.
FREE
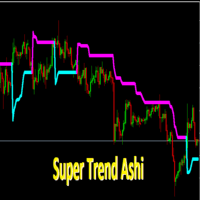
SuperTrendAshi Description SuperTrendAshi is an advanced and optimized version of the SuperTrend indicator that incorporates Heikin Ashi calculation to provide smoother and more reliable signals. This unique combination results in an indicator that reduces false signals and identifies trends with greater precision. Key Features Combines the strength of SuperTrend with Heikin Ashi smoothing More stable signals with less noise Intuitive color system (Aqua for uptrend, Magenta for downtrend) Custo
FREE

PipsCounter Basic は MetaTrader 5 用のインジケーターで、未決済ポジションのリアルタイムでのピップ変動を表示し、当日にクローズされた取引のサマリーを提供します。 すべての情報は、チャートのメインウィンドウにわかりやすく控えめな形式で表示されます。 機能 リアルタイムのピップ追跡
各未決済ポジションのピップ差を、市場のティックごとに継続的に更新します。 デイリーピップ合計
当日のすべてのクローズ済み取引の純ピップ値を表示します。 TP/SL 価格ラベル(新機能)
テイクプロフィットおよびストップロスの価格を、それぞれのライン上に自動的に表示。色、フォント、位置はカスタマイズ可能です。 表示のカスタマイズ
パネルの位置(チャートの四隅)、フォント、文字サイズ、利益/損失/ニュートラル状態の色を自由に設定可能。 幅広い互換性
通貨ペア、株価指数、金属、商品、シンセティック資産など、すべての MetaTrader 5 インストゥルメントに対応。ティックサイズ、小数点精度、価格形式に依存しません。 使用例 未決済ポジションのピップ変動を視覚的にモニター。
FREE

AlgoMatrix EMA Ribbon Trend Pro (MT5)
Professional EMA Ribbon Trend Indicator for MetaTrader 5
Overview – Built for Traders Who Respect Trends
AlgoMatrix EMA Ribbon Trend Pro is a professional-grade EMA ribbon trend indicator for MetaTrader 5, designed for traders who prefer clean trend confirmation, disciplined entries, and non-repainting signals.
This indicator focuses on one simple goal: helping you trade only when the market is actually trending, while avoiding sideways and cho

MT4 バージョン: https://www.mql5.com/en/market/product/110557 MT5 バージョン: https://www.mql5.com/en/market/product/110558 ライブ シグナル: https://www.mql5.com/en/signals/2047369
最先端の「FAST SCALPER」エキスパート アドバイザーのご紹介: 精度と熟練度でグローバル市場のパワーを解き放ちます
FX 取引のダイナミックな領域で、常に先を行くには、比類のないインテリジェンスとテクノロジーの組み合わせが必要です。
「FAST SCALPER」エキスパート アドバイザーは、洗練された取引ソリューションの頂点に位置し、世界通貨の強さに基づいた革新的なアプローチを通じて、オープン ポジション戦略に革命を起こします。
グローバル ダイナミクスを活用する設計: 「FAST SCALPER」は、グローバル経済の力の複雑な相互作用を活用することで、従来の取引手法を超えています。ニューラル ネットワーク ベースのアルゴリズムは、世界中のさま

前書き
21:00~22:00の夜間取引用EAです
長期ライブトレードは収益性が高い
一度に1つの注文のみを取引し、大きな損失を引き起こさない
各注文はストップロスとテイクプロフィットで設定され、グリッド、マーティン、またはその他のリスクの高いファンド管理は使用されません
複数の通貨を同時に取引できる デフォルトでタイムゾーンを自動設定
特性
トレーディングチャート:M15
取引可能な通貨:
EURUSD、GBPSUD、USDCAD、USDCHF、AUDCHF、EURGBP、EURCHF、USDJPY、EURCAD、EURAUD、GBPAUD、AUDJPY、EURJPY、GBPJPY、AUDUSD
最低入金額: 100 USD
推奨される仲介業者: IC Markets、Peperstone、Darwinex、EXNESS、およびその他の普及率の低いプラットフォーム
リアル口座シグナル MQL5 Live : https://www.mql5.com/zh/signals/1021524
パラメータ
MagicNumber: MagicNumber
U

Nimora Price today is 200. When 10 copies are sold, the new price will be 309. Don’t miss the early slot. Currently sold: 1 .
Nimora を使って自動取引の新しい時代に足を踏み入れましょう。このEAは市場の自然な「フローダイナミクス」を解釈するように設計されています。精度を重視したこのシステムは、リアルタイムのモメンタムシフトを読み取り、疲弊ゾーンを検出し、トレンド疲弊と反転強度が交差するエントリーを実行します。これは非線形で流動的なアプローチであり、厳格な機械的セットアップを超えています。
MQLで成長するトレーダーコミュニティに参加しましょう: (こちらをクリック) EAのインサイトを深く掘り下げましょう: (こちらをクリック)
概要 チャートシンボル: XAUUSD (単一チャートセットアップ) タイムフレーム: M30 最適なトレード対象: XAUUSD 最低入金額: $500が推奨されます レバレッジ: 1:100から1:500が最適 N

Japanese Venom Crown ― ルールベース Expert Advisor Venom Crown は GBPUSD 向けに設計されたルールベースの Expert Advisor で、 H1 タイムフレーム にて複数のコンフルエンス条件と日次実行制御を用いて運用されます。
時間フィルター、リスク管理ルール、オプションのニュースフィルターはすべて入力パラメータから調整可能です。
すべての内部条件が満たされた場合にのみ取引が実行されます。 Live Signal : https://www.mql5.com/en/signals/2350520 主な特徴
– GBPUSD(H1)向け
– 取引日・時間の設定が可能
– 固定ロットまたは残高ベースのロット
– Stop Loss / Take Profit 調整可能
– 影響度選択可能なニュースフィルター
– 日次実行制御ロジック
– 外部 DLL を使用しない MT5 ネイティブ EA 推奨設定
– 通貨ペア:GBPUSD
– タイムフレーム:H1
– 口座タイプ:ECN / Raw
– 小さな固定ロットから開

Ghost Renko Overlay Indicator Overview Ghost Renko Overlay Indicator displays Renko bricks directly on the main price chart as a semi-transparent overlay.
Unlike traditional Renko charts that require a separate offline window, this indicator allows traders to view standard candlestick price action and Renko structure simultaneously on the same chart. The overlay helps identify trend direction, price noise, and consolidation phases without losing time-based market context. Key Features Renko bric
FREE

BitBot – BTCUSD向けのH1チャート専用の高度なトレーディングロボット
BitBotは、H1タイムフレームでのビットコイン(BTCUSD)取引のために設計された、スマートで適応性のあるトレーディングロボットです。完全にテクニカル分析に基づいており、ボリューム(出来高)に基づく戦略を通じて、高精度の意思決定を実現します。これは暗号資産市場で極めて重要な要素です。
BitBotの中核となるロジックは、ビットコインおよび主要なアルトコインのリアルタイムの出来高分析にあります。複数の時間枠でのボリューム変化を継続的に監視し、それらの相関を解析することで、BitBotは市場全体の勢いの強さと方向性を判断します。
BitBotは、ブローカーからのライブデータを動的に処理し、市場のセンチメントの変化や相関関係の崩壊を検出し、より適切なトレード判断を行います。トレンドエントリーでも、出来高主導の反転でも、BitBotは技術的かつデータに基づいたアプローチを提供します。 LINKS:
Bot setting tutorial: https://www.mql5.com/en/blo

このユーティリティは、経済ニュースをチャート上に直接表示します。今後のイベント、発表までの時間、重要性を表示し、通知を送信します。
対象:
経済ニュースをフォローしているトレーダー
ニュースに基づいて取引するトレーダー
タイムリーなアラートを受け取りたいトレーダー
チャート上でシンプルで直感的なカレンダーを必要とするユーザー
主な機能 ニュースパネル - 直近の経済イベントをチャート上に表示します
通貨フィルター - 取引銘柄の通貨のニュースのみを表示します
アラート - ニュースリリースの指定時間前に通知します
プッシュ通知 - MetaTraderモバイルデバイスに通知を送信します
サウンドアラート - カスタマイズ可能なサウンドアラート
カラーインジケーター - 重要度と緊急度を視覚的に表示します
設定 AlertMinutesBefore - イベントの何分前にアラートを送信するか
MinImportance - アラートの最小重要度
FilterByCurrency - 現在のシンボルの通貨でニュースをフィルタリングします
EnableSoun
FREE

Overview Auto Fibonacci EA is a professional trading tool designed to automatically detect swing points and draw Fibonacci retracement levels on your charts. This indicator helps traders identify potential support and resistance zones based on the golden ratio principles. Key Features Automatic Swing Detection Intelligent algorithm identifies swing high and swing low points automatically Customizable swing detection sensitivity (SwingBars parameter) Works on all timeframes: M1, M5, M15, M30, H1
FREE

Volume Weighted Average Price is used by financial institutions to place large trades at what is considered the fair value for the session. Standard deviation channels around VWAP provide potential entry points for mean reversion or breakout strategies, and the VWAP itself can act as a high quality exit level. If you've heard that volume-based analysis doesn't work for forex and CFDs, try looking at VWAP with standard deviation bands on a chart, and note the frequency with which price reacts to
FREE

Solarwind No Repaintは、正規化された価格データにフィッシャー変換を適用する技術的オシレーターで、潜在的な市場転換点を特定するヒストグラムベースの指標を作成します。この指標は価格変動をガウス正規分布に変換し、周期的パターンとモメンタムシフトをトレーダーにとってより見やすくします。 動作原理 この指標は、いくつかの計算ステップを通じて価格データを処理します: 高値安値分析 :指定期間内の最高値と最安値を計算 価格正規化 :各バーの高値安値レンジの中点を取り、期間レンジに対して正規化し、-1から+1の間で値をスケーリング フィッシャー変換適用 :数学的フィッシャー変換式 0.5 * ln((1+x)/(1-x)) をスムージングとともに適用 トレンドシグナル処理 :値の変化とモメンタム閾値に基づいて方向性シグナルを生成 主要機能 ヒストグラム表示 :別のインジケーターウィンドウでカラーバーとして描画 トレンドベースの色分け :強気モメンタムには緑バー、弱気モメンタムには赤バー ノーリペイント設計 :現在バーでのシグナル変更を防ぐため、完了したバーのみを使用 適応感度 :市
FREE

Adaptive Hull MA Pro – Trend & Momentum Filter
We value your feedback and believe that your experience with the Hull Moving Average (HMA) is essential to us and other traders. Help us continue to improve and refine our product by sharing your thoughts and insights through a review!
The Hull Moving Average (HMA) Indicator – Your Key to Smoother Trends and Profitable Trades! Are you tired of lagging and choppy moving averages that hinder your ability to spot profitable trading opportunities? Loo
FREE

This expert advisor trades using the famous Parabolic Sar indicator and implements many other useful features for the exigent trader, like customizable indicator and trading settings, trading sessions and a martingale feature. [ Installation Guide | Update Guide | Troubleshooting | FAQ | All Products ] Easy to use and supervise Fully customizable parabolic sar settings Customizable break-even, SL, TP and trailing-stop Works for ECN/Non-ECN brokers Works for 2-3-4-5 digit symbols Trading can be
FREE
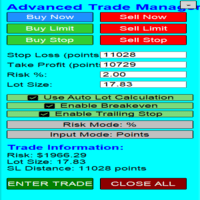
Overview Are you tired of complex manual calculations, emotional execution errors, and the constant fear of risking too much? The Advanced Trade Manager (ATM) is your all-in-one solution, a professional-grade Expert Advisor for MetaTrader 5 designed to give you institutional-level control over every aspect of your trade. From flawless risk calculation to intelligent, one-click execution, the ATM EA streamlines your entire trading process, allowing you to focus on your strategy, not the mechanics
FREE

First Scalper is an Expert Advisor based on Scalping, Using the best and safest scalping EA on market. Large number of inputs and settings are tested and optimized and embedded in the program thus inputs are limited and very simple. Using EA doesn't need any professional information or Forex Trading Knowledge.
First Scalper can trade on all symbols and all time frames, using a special and unique strategy developed by the author.
Using EA :
General Options Trade Type : Long/Short/Both Stop

This Drawdown monitor EA allows you to sleep relaxed and avoid blowing up your account Don't lose more money than you had planned ! This Free version of Drawdown monitor EA can be used freely and without limitations on a demo account. You can set up and test all parameters, verify that the operation meets your needs, and then purchase the licensed version to use on your live account at this link: https://www.mql5.com/en/market/product/156389
Link to the User Manual For any doubts, questions,
FREE

FORCE CANDLE PRO MT5 モメンタム 型 の 取引 ロボット 規律 と 明瞭 さ で 強い 値動き を 捕捉 する
市場 に 本物 の 強勢 ローソク が 現れた 時 のみ エントリー する
実体 が 支配 的 反対 ヒゲ を 制御 客観 的 な 判定 と 堅実 な 執行
余計 な 要素 なし 外部 依存 なし マーチン なし グリッド なし FORCE CANDLE PRO が 優れている 理由 価格 の エネルギー が 一本 の 強勢 ローソク に 集中 する 瞬間 を 狙う
その 状況 では 継続 の 可能性 が 高まり やすい
ロボット は 実体 の 強さ を ATR と 比較 し 実体 対 レンジ の 質 を 評価 し 反対 ヒゲ が 制御 されて いる か を 確認 する
必要 に 応じて 直近 の 高値 または 安値 の 突破 に よる 確認 を 追加 できる
結果 は 背景 の ある クリーン な エントリー で 大きな 一波 を 狙う こと に 集中 できる 対象 ユーザー 明確 な エントリー と 低 ノイズ を 求める トレーダー
軽量 で 実用
FREE

ICT Unicorn Hunter – Multi-Timeframe Smart Setup Detector IMPORTANT: This is a Multi-Timeframe Scanner, looking for 'Unicorn' setups. A Unicorn in this definition is a liquidity sweep, market structure shift and creation of a Fair Value Gap overlapping with the last opposite-close candle before the liquidity sweep (breaker). This scanner does NOT provide visualisation of the Unicorn on the chart.
For visualisation, use the Unicorn Tracker indicator, which is designed to work with the Unicorn
FREE

NeoHedge is an Expert Advisor for MetaTrader 5 that uses a combined grid trading strategy. It creates two independent trading grids (BUY and SELL), which are activated when the price breaks through the Bollinger Bands. It uses additional filters (Stochastic, ADX). Key Features: Bidirectional trading (simultaneous BUY/SELL grids). Automatic lot calculation and built-in risk management. Flexible filter configuration. Take profit in points or in USD with closing of the entire grid. Account Require
FREE

This indicator calculates gann support and resistance prices with use gann pyramid formulation and draw them on the chart. And If you want, Indicator can alert you when the current price arrive these pivot levels. Alert Options: Send Mobil Message, Send E-mail, Show Message and Sound Alert Levels: S1, S2, S3, S4, S5, R1, R2, R3, R4, R5 Inputs: GannInputPrice: Input price for gann pyramid formulation. GannInputDigit: How many digit do you want to use for calculation formula. (The number and the
FREE

The Horse DCA Signal 1.26 – สุดยอดนวัตกรรมอินดิเคเตอร์สำหรับการเทรดทองคำและทุกสินทรัพย์ The Horse DCA Signal คืออินดิเคเตอร์รุ่นล่าสุดจากตระกูล WinWiFi Robot Series ที่ได้รับการออกแบบมาเพื่อยกระดับการเทรดบนแพลตฟอร์ม MT5 โดยเฉพาะ โดยเป็นการผสมผสานอัจฉริยะระหว่างกลยุทธ์ Follow Trend และ Scalping เข้าด้วยกันอย่างลงตัว คุณสมบัติเด่น: ระบบลูกศรแยกประเภทชัดเจน: ลูกศรสีทอง: บ่งบอกสภาวะตลาดช่วง Sideway เหมาะสำหรับการเทรดแบบ Swing Trade หรือ Scalping เก็บกำไรระยะสั้น (2) ลูกศรสีน้ำเงินและสีแดง: บ่งบอกส
FREE
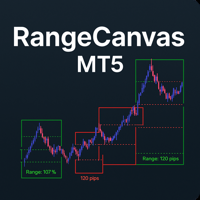
Daily Range Boxes : The indicator draws rectangular boxes around each day's high and low prices, creating a clear visual boundary for the daily trading range. Color-Coded Logic : Green boxes when the current price (or close) is above the daily open Red boxes when the current price is below the daily open Percentage Level Lines : Inside each box, it draws three horizontal lines at: 25% of the daily range 50% of the daily range (midpoint) 75% of the daily range Range Information : Each box displa
FREE

RSI Advanced - Elevate Your Analysis & High-Potential Trade Signals Overview RSI Advanced is a powerful custom indicator for MetaTrader 5, designed to elevate your technical analysis and provide reliable trading signals. This indicator integrates a standard Relative Strength Index (RSI) with a sophisticated system of Moving Averages (MA) and Bollinger Bands (BB) applied directly to the RSI's data. Furthermore, it incorporates advanced divergence detection capabilities, empowering traders to iden
FREE

HiperCube レンコ キャンドルへようこそ Darwinex Zero 25%割引コード: DWZ2328770MGM このインジケーターは、市場の実際の情報を提供し、それをレンコ キャンドル スタイルに変換します。
定義 レンコ チャートは、価格変動を測定およびプロットする金融チャートの一種で、レンガ (またはバー) を使用して価格の動きを表します。従来のローソク足チャートとは異なり、レンコ チャートは時間ベースの情報を表示せず、価格変動のみに焦点を当てています。
機能: インジケーターを別のウィンドウに表示 キャンドルの色をカスタマイズ キャンドル/レンガのサイズをピップ単位でカスタマイズ Chat gptとAIが開発に使用されました レンコを使用した戦略の例: トレンドを特定 レンコ キャンドルでプルバックとエングルフィングを待つ エントリーする SL エングルフィングの下限 TP リスク リワード 1:2、1:3... これは例であり、基本または新しい戦略になる可能性があることに注意してください。ただし、実際のアカウントで使用する前に試してテストしてください。この情
FREE
Session Timers (MT5) Session Timers adds a clean ribbon at the bottom of the chart showing the time until open and time until close for major FX sessions. While a session is open, a progress bar fills in real time. Vertical separators also mark session open and close directly on the chart. This is a charting utility; it does not provide trading signals and does not guarantee any profit. Sessions covered Sydney Tokyo Frankfurt London New York Main functions Countdown to each session’s next open/
FREE
DRX SPREAD MONITOR は、ブローカーのスプレッドをリアルタイムで可視化・分析するために設計されたプロフェッショナルなユーティリティです。ニュースイベント、ロールオーバー、または流動性の低いセッション中のスプレッド拡大によって引き起こされる隠れたコストを特定するのに役立ちます。 このツールは、約定品質を確保し、取引コストが統計的に高すぎる場合のトレードを回避する必要があるスキャルパーやゴールドトレーダーにとって不可欠です。 主な機能 リアルタイムヒストグラム: 別のウィンドウにスプレッド履歴を表示し、通常、高、極端なレベルを色分けします。 動的移動平均(MA): 平均スプレッドの傾向を計算し、一時的なスパイクと構造的なスプレッドの増加を区別するのに役立ちます。 視覚的「イコライザー」モード: チャートを乱雑にすることなく、市場の流動性状況に関する即時フィードバックを提供する独自のバーチャート表示です。 ライブデータパネル: チャート上のコンパクトなダッシュボードで以下を表示します: 現在のスプレッド 平均スプレッド(時間ベース) 最小/最大記録 音声警告システム: スプレ
FREE

Infinity Predictor MA
Infinity Predictor MA is a next‑generation forecasting indicator that transforms the traditional Moving Average into a powerful predictive tool. Unlike standard MAs that only smooth past data, this indicator projects the moving average line up to 40 bars into the future, giving traders a unique perspective on potential market direction.
The engine behind Infinity Predictor MA combines multiple advanced regression models to capture both smooth trends and sudden market shi
FREE

Presentation
Another indicator that makes scalping on tick charts easier, it displays an Heiken Ashi graph in Ticks.
It allows to detect entry points and trend reversals. Recommended number of ticks in a candle : 5, 13 or 21.
Parameters Ticks in candle: Number of ticks in a candle (default 5), Displays Trend arrows : displays a trend arrow based on EMA8 and EMA20 crossing, Displays MM50, Displays MM100, Max Candle (CPU): number of candles max to manage, low value will save ressources of your
FREE
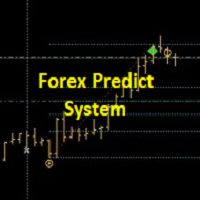
+++++++++++++++++++++++++++++++++++++++++++++++++++++++++++++++++++++++++++++++++++++++++++++++++ +++ Link to EURUSD Only Free Version --> https://www.mql5.com/en/market/product/156904?source=Unknown +++++++++++++++++++++++++++++++++++++++++++++++++++++++++++++++++++++++++++++++++++++++++++++++++ Hallo Trader, This is a traditional GANN & FIBONACCI strategy based on detection of an impulsive move in the opposite direction. This is called a Breakout. At the moment of Breakout, the indicator draw

A Fully Automated strategy with daily trading on high performance indicators to trade Gold (XAUUSD), Bitcoin (BTCUSD) and EURUSD. Inbuilt news filter avoids news and this EA has exit strategy options to reduce risk and protect profits. Safe stop loss and max lot size options for compatibility with funded accounts like FTMO. USE: Default settings on XAUUSD, XAUAUD & EURUSD on the M15 timeframe. Use ECN account for best results. MAIN SETTINGS Setting Value Description Magic Number 101

Deriv Synthetic Indices Symbol Changer Developed by Tshepo David The Symbol Changer for Deriv Synthetic Indices is a professional utility designed for MetaTrader 5 (MT5) to streamline your market analysis. Instead of manually dragging symbols from the Market Watch or right-clicking to change timeframes, this tool places a sleek, interactive dashboard directly on your chart. It is specifically pre-configured for synthetic indices (Step Index, Jump Index, and Volatility Index), but it is fully c
FREE

GEN Sessions Volume Profile Developer: Gede Egi GEN Sessions Volume Profile is an MT5 indicator designed to display the volume distribution for each trading session (daily) in the form of a Volume Profile . With this tool, traders can easily see at which price levels the highest trading activity has occurred during a session, making it easier to identify key market areas. The indicator automatically plots Session Boxes, Point of Control (POC), Value Area High (VAH), Value Area Low (VAL), and Va
FREE

AnomalyLogReturn: Statistical Edge & Mean Reversion AnomalyLogReturn is a high-precision statistical tool based on Log Returns . It identifies volatility anomalies and exhaustion points before price reversals occur. Why Log Returns? Unlike standard price action, Log Returns reveal "abnormal" movements that are invisible to the naked eye, providing a true statistical edge. Key Features: Anomaly Detection: Automatically flags when price is statistically overextended. Smart Ad
FREE
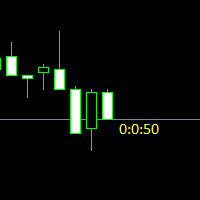
Простая утилита показывающая время до формирования свечи. Может быть очень полезна, если вход в сделку завязан на начале/завершении свечи.
Входные параметры FontColor - Цвет текста. FontSize - Размер текста. FontName - Шрифт текста. TimeOnly - Указывать только время, без дополнительного текста. TypeOfDrawing - Тип отображения информации Важно : в работе программы возможна задержка в 1 секунду.

Moving Average Alerts は、4 本の完全にカスタマイズ可能な移動平均線を搭載した、シンプルで効率的なインジケーターです。トレーダーは自身の戦略に応じて、期間、手法、設定を自由に選択できます。 各移動平均線には 2 つの独立したアラートがあり、それぞれ個別に有効または無効にできます: 価格が移動平均線の上でクローズしたときのアラート
価格が移動平均線の下でクローズしたときのアラート アラートはローソク足の確定時のみ作動し、価格形成中の重複や誤ったシグナルを防ぎます。 また、プッシュ通知機能を備えており、MetaTrader 5 Mobile に直接アラートを送信できるため、パソコンから離れていてもチャンスを逃しません。 移動平均線をトレンド、サポート・レジスタンス、またはエントリー確認の基準として使用するトレーダーに最適です。
FREE

Market Imbalance Detector is a technical analysis indicator designed to highlight price imbalances, commonly known as Fair Value Gaps (FVGs). The indicator detects imbalance zones using a precise three-candle structure and displays them directly on the chart as visual zones. These areas represent price inefficiencies that may act as potential reaction or interest zones in future price movement. Features Detects bullish and bearish market imbalances Uses a true three-candle structure Works on
FREE

Smart Fibo Zones are powerful, auto-generated Fibonacci Retracements that are anchored to key market structure shifts . These zones serve as critical Supply and Demand levels, guiding you to identify potential price reactions and confirm market direction. Fibonacci calculations, widely used by professional traders, can be complex when it comes to identifying highs and lows. However, Smart Fibo Zones simplify this process by automatically highlighting order blocks and key zones, compl

El **Heiken Ashi Smoothed** es una versión suavizada del indicador técnico Heiken Ashi, que se utiliza en el análisis de gráficos de velas para identificar tendencias del mercado y pronosticar movimientos de precios. Este indicador se basa en el promedio de datos de precios para formar un gráfico de velas que ayuda a los traders a filtrar el ruido del mercado.
**¿Para qué sirve?** Este indicador se utiliza para identificar cuándo los traders deben permanecer en una operación y cuándo está por
FREE
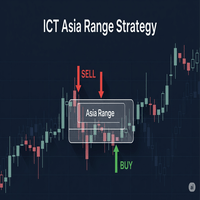
CT Asia Range EA: Trade the "Judas Swing" Like a Pro Are you tired of setting your bias correctly, only to be stopped out by a sudden, manipulative spike before the market moves in your intended direction? Do you see the market constantly engineering liquidity grabs above the Asian session high, only to reverse moments later? It's time to stop being the victim of stop hunts. The ICT Asia Range EA is meticulously engineered to turn this common market manipulation into your most reliable trading s
FREE

Harmonica Basic is a free expert advisor that opens a mesh of positions. It does not close any positions, and its up to you to manually close profitable positions at your desire. There are no options to configure. Distance between positions is automatically set based on market conditions. The higher the timeframe - the wider the distance between positions.
FREE
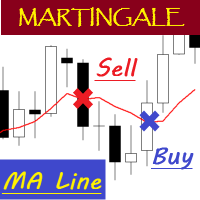
EA "MA Line" with martingale feature
To see how EA works, please watch the video below. In the video, I perform parameter optimization and do a backtest. The parameters that are optimized are: - MA Period - Stop Loss - Take Profit
For the future, I will try to optimize and test EA, especially the expert advisors in the mql5 community. hopefully it can be useful for colleagues in the mql5 community.
FREE
MetaTraderマーケットが取引戦略とテクニカル指標を販売するための最適な場所である理由をご存じですか?宣伝もソフトウェア保護も必要なく、支払いのトラブルもないことです。これらはすべて、MetaTraderマーケットで提供されます。
取引の機会を逃しています。
- 無料取引アプリ
- 8千を超えるシグナルをコピー
- 金融ニュースで金融マーケットを探索
新規登録
ログイン