YouTubeにあるマーケットチュートリアルビデオをご覧ください
ロボットや指標を購入する
仮想ホスティングで
EAを実行
EAを実行
ロボットや指標を購入前にテストする
マーケットで収入を得る
販売のためにプロダクトをプレゼンテーションする方法
MetaTrader 5のためのエキスパートアドバイザーとインディケータ - 50

Safe Trader Advanced – スパイク捕捉EA、独自のリスク管理で安定かつ安全なトレードを実現 Safe Traderは、スパイク検出アルゴリズムと資本管理フレームワークを組み合わせ、ボラティリティの高い市場で精度と保護を両立します。 市場スパイクを正確かつ一貫して捉えるために特別に設計されています。一般的な不安定なシグナルや過度に最適化された設定に依存するEAとは異なり、Safe Traderは独自のリスク管理コアに基づき、すべての取引が事前定義された制御されたリスクパラメータ内で行われます。 壊れないリスク管理: 自動的にリスクを制御し、誤設定があっても安全限度を超えることを防ぎます。 最小限の入力: 調整可能なのは「1回の取引あたりのリスク%」のみ。他の重要値はすべて最適かつ安全に保たれます。 推奨リスク設定 (%): 低リスク: 0.3 標準リスク: 0.6 高リスク: 0.9 安全メカニズム統合: 推奨値を超えるリスクが設定された場合、EAは取引を回避し、過度なリスクから口座を保護し、長期的な安定性を確保します。 API/サーバーに依存しない: 完全自律型で、
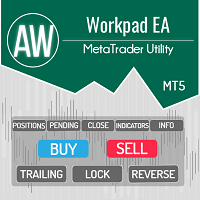
AW Workpad は、手動および半自動取引用に設計された多機能取引コントロール パネルです。保留中の注文、市場ポジションを管理し、幅広い統計データを提供するだけでなく、古典的な指標のグループの複数期間の分析を行うことができます。 このユーティリティは、次の 5 つのタブで表されます。 Positions, Pending, Close, Indicators, Info . 各タブには、注文や現在の市場状況に関する情報を処理するための独自の機能グループがあります。 MT4版→ ここ / 問題解決 -> ここ 機能または利点: このユーティリティは、すべての時間枠と任意のシンボル (通貨、指数、石油、金属、株式) で機能します。 各パネルのすべての要素には追加のラベルが付けられており、任意の要素にカーソルを合わせるだけで表示されます。 AW Workpad 取引パネルには、柔軟な設定と直感的なパネル インターフェイスがあります。 最も必要なすべての機能を 1 つの製品に。 取引パネルのタブ: Positions - このタブでは、成行注文を操作および維持できます
No Nonsense Forex Methodのトレードパネル チャートをきれいに保ちながら、取引速度を向上させます
特徴: - ポジションサイジング: [Buy/Sell] をクリックすると、このツールはリスクに最も近いロット数 (各取引で使用される残高の割合) で 2 つの取引を開始します。ピップ値の計算は忘れてください!
-SL と TP: 各取引は 1.5*ATR のストップ ロスで開かれ、1*ATR のテイク プロフィットで 2 つの半分のうちの 1 つが開かれます。使用される ATR 値は、現在のローソク足の値であり、日足のローソク足を完了するまでの残り時間が 4 時間未満の場合、そうでない場合は前のローソク足の値になります。
-ストップロスの更新 : ストップロスを損益分岐点に設定するか、NNFX のルールに従ってトレーリング ストップを更新します (価格が 2*ATR に移動した後、ストップ ロスは 1.5*ATR に移動します)。 - ポジションを閉じる: 決済シグナルを受け取ったら 、ワンクリックですべての売買を決済します
その他の考慮事項: -プログラム
FREE
VWMA Signal Pro – 複数時間軸ボリューム加重トレンドダッシュボード VWMA Signal Pro は、ボリューム加重移動平均線 (VWMA) とトレンド確認フィルターを組み合わせた分析インジケーターです。
ボリュームとボラティリティに基づき、トレンド方向とモメンタム強度を特定します。 複数時間軸で VWMA を計算し、ADX、ATR、VWAP フィルターで確認された売買シグナルを表示します。各シグナルには「弱い・普通・強い」の強度評価が付きます。 主な特徴 M1~D1 のマルチタイムフレームパネル。 ボリューム、RSI、ボラティリティに基づくシグナル分析。 ADX、ATR、VWAP フィルター。 感度モード(N, X, Y, Z)の調整可能。 10種類のプロフェッショナルテーマ。 カスタマイズ可能な表示位置、色、透明度。 高速で安定した動作。 VWMA Signal Pro は、明確で効率的なボリュームベースのトレンド分析を提供します。

QuantumPulse– Institutional Gold Trading System (XAUUSD) QuantumPulse is an advanced institutional-grade automated trading system designed specifically for Gold (XAU/USD) .
The robot is built using a multi-layer decision framework that combines higher-timeframe trend validation, micro-momentum detection, liquidity protection, and noise suppression , allowing it to operate efficiently in both trending and volatile gold market conditions. Unlike traditional retail Expert Advisors,QuantumPulse do
FREE

Product: Phantom Shadow Reversal Engine Version: 3.0 (Elite Edition) Developer: Trade With Thangam
THE ULTIMATE SCALPING TOOL FOR XAUUSD & MAJOR PAIRS
The Phantom Shadow Reversal Engine is not just another indicator; it is a complete trading system designed for precision scalping and day trading.
Instead of relying on lagging signals, this system uses a "Proprietary Shadow Engine" that analyzes Market
FREE

Support Resistance Indicator The "Support Resistance" indicator is a versatile tool designed to help traders identify key support and resistance levels based on an underlying algorithm. These levels indicate price points where an asset historically experiences buying (support) or selling (resistance) pressure. The indicator allows traders to visualize these levels on their charts, making it easier to make informed decisions. All Products | Contact PARAMETERS: Timeframe :
Users can select the
FREE

Infinite Storm EA is a safe and fully automated expert advisor that analyzes market trend and price movements and thanks to that is able achieve high rate of winning trades. Every order has StopLoss (either real or virtual) and EA has implemented advanced filtering functions together with spread and slippage protections. This EA does NOT use any of the dangerous strategies like Martingale, Grid or Arbitrage. This EA is fully customizable by user. This EA is not limited by trading pair or time

概要 RainbowVolumeProfile は、指定したバー数の範囲における 価格帯別のティック出来高(Volume Profile) を表示するインジケーターです。
主要な出来高集中帯(POC)を上位5つまで自動検出し、 カラフルなヒストグラム として描画します。
計算は非常に軽量で、リアルタイム更新にも対応しています。 主な特徴 上位5つのPOC(Point of Control)を自動検出・色分け表示 チャート右端に水平ヒストグラムとして描画 時間足を指定して分析(M1〜H4など自由) 新しいバーの出現に応じて自動更新 描画オブジェクトは自動管理(再描画・削除処理付き) 軽量なアルゴリズム構成でスムーズに動作 ️ パラメータ設定 パラメータ名 説明 デフォルト値 CaluculationBars 計算対象とするバー数 120 PriceResolution 価格分割数(ヒストグラム解像度) 25 VolumeProfileWidth プロファイル描画幅(ピクセル) 180 VolumeColor 通常のボリュームカラー WhiteSmoke VolumeColo
FREE

Demand and supply zones Support and Resistance areas Show broken zones Show tested and untested zones Show weak zones Fractal factors Notifications when price reaches point of Interest with Push notifications and pop ups Customizable History Clickable Works on all Timeframes Works on all pairs.
Free for a while till further notice and changes. The demand and supply bot coming soon
FREE
Range Identifier v3 User Guide 1. Overview The Range Identifier v3 is a technical analysis tool designed to automatically detect and visualize periods of market consolidation, commonly known as ranges. this MQL5 version brings the same powerful logic to the MetaTrader 5 platform. The primary function of this indicator is to draw a channel around recent highs and lows during periods of low volatility. When the price breaks out of this channel, the indicator provides an alert, helping traders iden
FREE
SPECIAL INTRODUCTORY PRICE!! Bollinger Reversal Pro (MT5) is a professional, fully-customisable Expert Advisor that targets reversal setups at the outer Bollinger Bands , filtered by RSI and ADX to avoid weak, choppy signals. It’s simple to run in the MetaTrader 5 Strategy Tester, so you can backtest, optimise, and find parameters that suit any symbol and timeframe. Packed with features ATR-based SL & TP – Adapts to volatility; no more one-size-fits-all levels. Currency or % risk – Set a fixed c

Finally a Metatrader version of the very popular (and expensive) Market Cipher B indicator, or the Vumanchu Cipher B + Divergences very popular on Tradingview platform.
This tool is very heavy on calculations, total are 31 plots using 97 buffers from several indicators. On my mid end computer, timeframes below M15 start getting a bit laggy, so it would require a powerful computer to run it properly at very low timeframes. It's still usable here, but somewhat sluggish response in Metatrader (lik
FREE

Raymond Cloudy Day Indicator for MT5 – Pivot-Based Reversal and Trend Levels Raymond Cloudy Day Indicator is a pivot-based level indicator for MetaTrader 5 (MT5). It was developed by Ngo The Hung based on Raymond’s original idea and is designed to give a structured view of potential reversal zones, trend extensions and support/resistance levels directly on the chart. The default settings are optimised for XAUUSD on the H1 timeframe, but the indicator can be tested and adjusted for other symbols
FREE
Название советника : Survivor (есть расширенная версия: https://www.mql5.com/ru/market/product/36530 ) Валютные пары : USDJPY, EURUSD, GBPUSD, AUDUSD, GBPJPY, XAUUSD, EURCHF Рекомендованная валютная пара : USDJPY Таймфрейм : М5 Время торговли : круглосуточно Описание : Трендовый советник с возможностью мартингейла и построением сетки ордеров. В советнике используются три группы аналогичных сигналов для открытия, закрытия и дополнительных сделок. При наличии тренда(определяется МА) ловится отс
FREE

オープニングレンジEAは 、よく知られた市場原理に基づいて構築されています。指数は市場が開いた直後に強いモメンタムを示すことが多く、その最初の動きがセッションの残りの流れを決定づける可能性があります。このEAは、オープニングレンジを特定し、ブレイクアウト注文を自動的に出すことで、そのモメンタムを捉えます。その後、セッションが終了するまで取引を管理し、その日の方向性の動きから利益を得ることを目指します。 この製品は完全に無料です。初期設定ファイルは コメント欄から入手できます 。 戦略をさらに拡張またはカスタマイズしたい場合は、有料製品のいずれかを購入していれば、DM 経由でソース コードをリクエストできます。 他のEAもぜひご覧ください 取引仕様
対応機器 :US30、USTEC、DE40に最適。EA 設定: デフォルト設定はUS30とUSTECに最適化されています。VPS : 中断のないパフォーマンスのために推奨 主な特徴 カスタム時間ウィンドウ: 希望する開始時間と終了時間を選択して、開始範囲を定義します。 自動ブレイクアウト注文: EA は定義された範囲の上下に保留
FREE
Moving averages are very often used for analyzing currency pairs and trading. This Expert Advisor can analyze many moving averages at once and trade based on this. When the required number of moving averages signal a purchase, the adviser makes a purchase, if the indicators signal a sale, the advisor sells. Also, there is filtering spurious signals at low volatility based on the ADX indicator. In the settings of the adviser, you can set the required number of sliding ones, their period (the init
RSI + Grid Distance Strategy with 200 EMA Filter Overview The RSI + Grid Distance Strategy integrates momentum and mean-reversion principles within a structured grid trading framework. By combining the Relative Strength Index (RSI) with dynamic grid levels and a 200-period Exponential Moving Average (EMA) filter, the system seeks to optimize trade timing, trend alignment, and overall position efficiency. Core Logic 1. RSI Signal Generation
The algorithm utilizes a 17-period RSI , identifying b

Alert Indicator for exponential moving average cross blue arrow for buy alert , fast ema 14 crosses above 50 pink arrow for sell alert , fast ema 14 crosses below 50 Default 14 ema fast & 50 ema slow add these indicators to chart Full Alerts , push, email, phone inputs for moving average lengths and alarm on off settings Please contact for help of an indicator alert suggestion
FREE

Shadow Bands Pro – MT5 说明(中英文) English Description (MT5) Shadow Bands Pro – Advanced Reversion System for MT5 This MT5 edition of Shadow Bands Pro takes full advantage of the MT5 platform, offering faster calculations, more timeframes, and better testing capabilities.
It remains a non-repainting (on close) trend-reversal / mean-reversion tool with dynamic channels, entity-break logic, and an integrated statistics panel. Key Features Optimized for MT5’s 64-bit, multi-threaded architecture Non-
FREE

The Trend Line Reverse Expert Advisor is a highly innovative and powerful tool that enables traders to effortlessly identify and trade trends in the financial markets. With this advanced tool, you can easily draw trend lines on your MT5 chart, and the EA will automatically buy or sell when the price reaches the trend line. This EA is user-friendly and requires minimal setup. You can simply attach it to your chart and start drawing up to three trend lines where you anticipate the price to reverse
FREE
Ultra-short-term trading assistant
One-click quick trading(Preset types orders)
base lot: minimum lot placed
Market buy/sell: base lot * level1 times
Spread free buy/sell: base lot * level2 times
Custom distance buy/sell limit: base lot * level3 times
Shortcut key: Q - Market buy W - Bid price linked to buy limit E - Specify the distance to hang the buy limit R - Close buy order A - Sell at market price S - Ask price linked to sell limit D - Specify the distance to hang the sale F - Cl
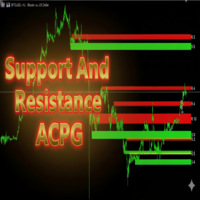
Support And Resistance ACPG Indicator
The Support And Resistance ACPG Indicator (developed by Grok by xAI) is an advanced tool for the MetaTrader 5 (MQL5) platform, designed to identify and visualize support and resistance zones on a price chart. Unlike traditional support and resistance indicators, the ACPG method combines a dynamic approach based on swing points, volatility analysis using the Average True Range (ATR), and an adaptive clustering system to detect high-relevance zones in the
FREE

Vantage FX Matrix Basic is a specialized market analysis dashboard designed for the MetaTrader 4 platform. It allows traders to monitor the relative strength and momentum of major global currencies in real-time. This edition is optimized for traders focusing on the four most liquid currencies: USD, GBP, JPY, and AUD . The dashboard combines multi-timeframe analysis with a proprietary RSI-based algorithm to identify potential trend continuations and reversals without switching charts. Functiona
FREE

MSX Hybrid HeikenAshi EA — Lite Version Product Description MSX DSHA Simple Free EA is a free educational Expert Advisor designed to demonstrate the basic working principles of the Double Smoothed Heikin Ashi (DSHA) core engine . This EA is released as a learning and demonstration tool , showing how DSHA candle patterns can be used to generate: Buy Entry Buy Exit Sell Entry Sell Exit based strictly on closed candle analysis , without repainting or advanced trade management. How the DSHA C
FREE

Breakout Monitor is a powerful trading tool designed to track price action within your custom-drawn zones. Simply draw a rectangle on your chart to define your consolidation or key levels, and the indicator will do the rest. It highlights the price range clearly and monitors it in real-time, ensuring you never miss a significant market move. When the price breaks through your defined boundaries, the indicator sends an instant Push Notification directly to your mobile phone in a clear, actionable
FREE

This is a buyer and seller aggression indicator that analyzes the shape of each candle and project this data in a histogram form. There are 4 histograms in one. On the front we have two: Upper - Buyer force. Lower - Seller force. At the background we also have two histogram, both with same color. They measure the combined strenght of buyers and sellers. This histograms can be turned off in Input Parameters. It is also possible to have the real or tick volume to help on this force measurement. IN
FREE

SQUIDに任せよう…
グリッドをコントロールしよう!
Squid Gridは、非常に使いやすいグリッドトレーダーシステムです。スタートボタンをクリックするだけで、あとはSquidがすべてをコントロールしてくれます!
この戦略は、ユーザー定義のポイントディスタンスシステムに基づいており、価格がXポイント変動するとポジションがオープンします。
条件付きロジックが成立している間、複数のポジションがオープンし続けます。ポジション数はカスタマイズ可能です。
リトレースメント率に基づいた利益保護システムも搭載しており、これもユーザー定義可能です。
パフォーマンスについては、関連動画とスクリーンショットをご覧ください。
EURUSD M1でこれまで見た中で最高の結果です。
シャープレシオ:21.43!!
プロフィットファクター:1.66
ドローダウン率:1.45%!!

Hetzer News Tradingは、主要なニュースリリース時に動作するように特別に設計されたインテリジェントな取引ロボットです。重要な経済および金融データが公開される際に、市場に参入する正確な時間間隔を設定することで、事前に取引を計画することができます。 Hetzer News Trading の主な利点: 柔軟な設定: ニュースカレンダーに基づいて取引スケジュールを事前に設定できます。たとえば、明日16:00と17:00に重要なニュースが発表されることが分かっていれば、その時間帯に自動的にロボットを作動させるように設定できます。 週間計画: 数日先のニュースイベントを確認できるため、迅速に戦略を調整し、リスクを最小限に抑え、利益の可能性を最適化できます。 取引操作の自動化: ロボットは指定された時間に自動的に起動し、常にニュースを監視して手動で市場に参入する必要がなくなります。 効果的なリスク管理: 事前に設定された時間間隔と戦略により、ニュースイベントに関連する市場のボラティリティの影響を低減するのに役立ちます。 Hetzer News Tradingを利用することで、事前
FREE

FusionAlert StochRSI Master is an indicator available for MT4/MT5 platforms, it is a combination of RSI & Stochastic indicator which provide "alerts" when the market is inside "overbought and oversold" regions combined for both indicators, results in more precise and accurate signals to be used as a wonderful tool, in the form of "buy or sell" signals. This indicator comes with many customization options mentioned in the parameter section below, user can customise these parameters as needful. Jo
FREE

Market Sessionsync** is a cutting-edge trading session indicator designed to enhance your trading experience by visually breaking down the market's daily rhythm. With a compact window overlaid on your chart, this indicator provides a split-second understanding of the current trading session through: Basic setup: Set Difference between your local time and your broker time , set DST(Daylight Saving Time) ON or OFF , set timescale sync you want to use (Local, Broker, CET) - A vertical time marker
FREE

Trading Admin EA is an algorithmic trading system specifically engineered for the MetaTrader 5 platform, optimized for low-capital environments. Its strategy is based on dynamic scalping, utilizing volatility and momentum indicators (Bollinger Bands and Stochastic) to identify precise entry points on short timeframes. Key Features: Total Accessibility: Designed to operate with minimum deposits starting from as low as $10 USD , allowing any trader to start without significant upfront investme
FREE

SuperTrend TV-Style replicates the classic SuperTrend indicator from TradingView, now available for MetaTrader. It uses ATR-based volatility to detect trend direction and plot dynamic buy/sell zones on the chart. Green line: uptrend Red line: downtrend Arrows: buy/sell signals at trend shifts Customizable source price (HL2, HLC3, etc.) and ATR method Simple, fast, and familiar - ideal for traders switching from TradingView or looking for a clean trend-following tool.
FREE

Schaff Trend Cycle (STC) "CON ALERTAS"
El Indicador Schaff Trend Cycle (STC) es una herramienta técnica utilizada en el trading e inversión para identificar tendencias y generar señales de compra o venta. ¿Qué es el Schaff Trend Cycle? El STC fue desarrollado por Doug Schaff para mejorar las medias móviles incorporando análisis de ciclos. Su objetivo es identificar tendencias y cambios de tendencia midiendo la fuerza y velocidad de los cambios de precio. Es un oscilador que mide la velocidad
FREE

BBMA by RWBTradeLab is a clean chart-plotting indicator for MetaTrader 5 that combines Bollinger Bands , Linear Weighted Moving Averages (LWMA) on High/Low , and an EMA on Close to help traders read market structure visually. What it plots Bollinger Bands (Upper / Basis / Lower) LWMA on Low : 5 & 10 periods LWMA on High : 5 & 10 periods EMA on Close : default 50 periods Key features Plot-only indicator (no alerts, no trade execution) Non-repainting calculations (standard indicator plotting) Opti
FREE

Neural FX is a high-performance automated trading solution specifically designed for the MetaTrader 5 platform. This system utilizes a sophisticated Trend-Following strategy to identify high-probability entries during strong market momentums, ensuring you stay on the right side of the market. Whether you are a professional trader or a beginner, this EA provides a "set-and-forget" experience with advanced risk management protocols.
FREE
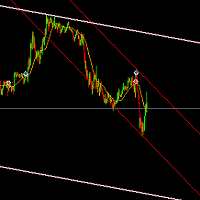
The indicator based on the trading channel in the MT5 trading terminal is a tool that automatically builds a channel formed by the peaks of the price chart in an upward and downward sequence. This indicator helps traders identify support and resistance levels, market trends, as well as set stop-loss and take-profit levels for optimal trade management. This version of the indicator is equipped with a basic trading logic, which can be disabled in the settings and used as an indicator for your tra
FREE

Utazima Universal AI – Institutional Smart Money Dashboard (FREE) Product Overview Utazima Universal AI is a professional manual trading indicator designed to help traders identify institutional price behavior with clarity and precision. The indicator combines Smart Money Concepts (SMC) , AI-based market filtering , and time-based session logic (Silver Bullet) into a single, clean non-repainting dashboard for MetaTrader 5. This tool is suitable for traders who want structure, confirmation,
FREE

Hull Suite by Riz | MT5 Indicator Overview: Hull Suite is a premium trend-following indicator that combines three powerful Hull Moving Average variations (HMA, EHMA, THMA) into one versatile tool. Designed for traders who demand clarity and precision, this indicator helps identify trend direction with minimal lag while filtering out market noise. Key Features: Three Hull Variations – Switch between HMA (classic), EHMA (exponential smoothing), and THMA (triple weighted) to match your trading styl
FREE

Gold Crush EA – Smart, Safe & Powerful Trading on Gold Gold Crush EA is a professional-grade Expert Advisor built by a trader with 7+ years of real market experience . Designed specifically for XAUUSD (Gold) , it offers safe, single-trade execution with strong risk management — making it ideal for both prop firm challenges and personal trading accounts. For Premium tools Contact Admin: Click Here Proven Performance
Passes multiple prop firm challenges with ease — no high-risk strategies li
FREE

Supply and demand in trading describes how buyer (demand) and seller (supply) actions set asset prices, with high demand/low supply raising prices (premium) and low demand/high supply lowering them (discount); traders identify these imbalances as "zones" on charts (e.g., Rally-Base-Rally for demand, Drop-Base-Drop for supply) to find potential entry/exit points, aiming to buy at discount demand zones and sell at premium supply zones, using volume and price action to confirm institutional acti
FREE

Based on the Extreme Trend Indicator on Trading View converted for MT5. Usage of the Indicator is free, but if you want the source code, you can purchase the source code by messaging me.
Extreme Trend is an indicator that identifies when a new trend is forming and creates a trading signal. This indicator can be used for many markets, forex, gold etc. If you have any inquiries or want to create an EA using this indicator, you can message me.
FREE

「HiperCube USD INDEX (DXY /USDX) 」は、株式、債券、商品などの特定の資産グループのパフォーマンスを米ドル建てで表す金融ベンチマークです。これらのインデックスは、投資家が特定のセクターまたは市場のパフォーマンスを時間の経過とともに追跡および比較するのに役立ちます。インデックスは米ドルで表現されるため、資産の現地通貨や地理的な場所に関係なく、投資を評価するための一貫した基準を提供します。 Darwinex Zero 20%割引コード: DWZ2328770MGM_20 パフォーマンス 情報をより明確にするために、別のウィンドウにインジケーターを配置 カスタムキャンドル、色の変更 インストールは簡単、必要な場合にのみアクティブ名を変更 Chat gptとAIが開発に使用されました
HiperCube USD インデックスの理解: パフォーマンス インジケーター : インデックスは、特定の市場またはセクターのパフォーマンスを示します。インデックス USD が上昇すると、基礎となる資産の価値が一般的に上昇していることを示します。逆に、インデックスが下がった場合
FREE
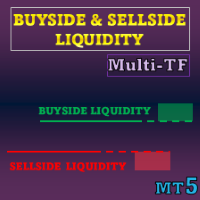
特別オファー : すべてのツール 、各 $35 。 新ツール は 最初の1週間 または 最初の3件の購入 まで $30 です! MQL5 の Trading Tools チャンネル :最新情報を受け取るには私の MQL5 チャンネルに参加してください 本インジケーターは 流動性レベル および 流動性ゾーン を ICT コンセプト に基づいて可視化し、さらに一方向の価格変動を強調する Liquidity Voids を表示します。ストップ注文や指値注文が集まりやすい箇所と、価格がそこを通過した後の推移に焦点を当てます。
MT5 版はこちら: Buyside and Sellside Liquidity MT5 Multi Timeframe MT4 版はこちら: Buyside and Sellside Liquidity MT4 Multi Timeframe その他の製品: All P roducts 主なポイント • カラー分けされたレベルとゾーンにより、双方向の流動性構造(buyside/sellside)を明確化 • レベル

Light Venus - Adaptive Grid Profit Maximizer *Users are encouraged to share their set files that have performed well in the comments section. Why Choose Light Venus? Master the Grid Strategy : Harness the power of grid trading, where orders are strategically placed at calculated intervals. This method allows you to profit from market fluctuations without being glued to your screen. Profit with Precision : Define your profit goals, and let Light Venus handle the rest. Its intelligent system clo
FREE

Elevate your trading with Kumo Cloud MT5 EA , a sophisticated automated trading solution built for MetaTrader 5. This EA harnesses the power of the Ichimoku Cloud (Kumo) and the momentum-confirming Awesome Oscillator to identify and trade high-probability breakout opportunities. Note: The program uses a rare signal generation logic that is double confirmed, using the Kumo Cloudstrategy. Make sure you understand the strategy! Backtest it in strategy tester on any currency pair of your choice and
FREE

このユーティリティは、経済ニュースをチャート上に直接表示します。今後のイベント、発表までの時間、重要性を表示し、通知を送信します。
対象:
経済ニュースをフォローしているトレーダー
ニュースに基づいて取引するトレーダー
タイムリーなアラートを受け取りたいトレーダー
チャート上でシンプルで直感的なカレンダーを必要とするユーザー
主な機能 ニュースパネル - 直近の経済イベントをチャート上に表示します
通貨フィルター - 取引銘柄の通貨のニュースのみを表示します
アラート - ニュースリリースの指定時間前に通知します
プッシュ通知 - MetaTraderモバイルデバイスに通知を送信します
サウンドアラート - カスタマイズ可能なサウンドアラート
カラーインジケーター - 重要度と緊急度を視覚的に表示します
設定 AlertMinutesBefore - イベントの何分前にアラートを送信するか
MinImportance - アラートの最小重要度
FilterByCurrency - 現在のシンボルの通貨でニュースをフィルタリングします
EnableSoun
FREE

If you love this indicator, please leave a positive rating and comment, it will be a source of motivation to help me create more products <3 What is Schaff Trend Cycle indicator? The Schaff Trend Cycle (STC) is a technical analysis indicator used in trading and investing to identify trends and generate trading signals. The STC is designed to identify trends and trend reversals by measuring the strength of the trend and the speed of price changes. The STC indicator helps to identify trends in a
FREE

Fibomathe Indicator: Support and Resistance Tool for MT5 The Fibomathe Indicator is a technical analysis tool designed for MetaTrader 5 (MT5) that assists traders in identifying support and resistance levels, take-profit zones, and additional price projection areas. It is suitable for traders who use structured approaches to analyze price action and manage trades. Key Features Support and Resistance Levels:
Allows users to define and adjust support and resistance levels directly on the chart.
FREE

The "Close All Order Tools" tool is designed to solve common problems faced by Forex traders when managing profitable orders—especially in highly volatile market conditions or when dealing with multiple open trades simultaneously. Problems This Tool Solves: Unable to close orders in time : “Just when it was rising nicely, the price suddenly dropped—I couldn’t close it in time, and the profit vanished.” Closing orders one-by-one is time-consuming : “With multiple orders open, closing each one ind
FREE

Unlock the full potential of your Pro Thunder V9 indicator with our revolutionary new plugin - Auto Trend Lines! Are you looking for a competitive edge in today's dynamic market? Look no further. With Auto Trend Lines, you can harness the power of precise market trend analysis to make informed trading decisions. This innovative plugin seamlessly integrates with your Pro Thunder V9 indicator, providing you with real-time trend data and pinpointing exact entry and exit points for your trades. Key
FREE
Volumized OrderBlocks MTF - Multi-Timeframe Volumetric Order Block Indicator
OVERVIEW
Volumized OrderBlocks MTF is an advanced Multi-Timeframe Order Block indicator that automatically detects, displays, and merges Order Blocks from up to 3 different timeframes on a single chart. Built with institutional Smart Money Concepts (SMC) method
FREE

LandBreaker is a meticulously engineered Expert Advisor (EA) designed for the EURUSD H1 chart, focusing on consistent performance and robust risk management . It has undergone extensive testing over a 15+ year period , from 2008 to 2024, based on a specific initial deposit. Out of 1,199 trades executed during this testing period, LandBreaker achieved a high success rate of 99.83% . The performance indicates a 99.79% success rate for short positions and a 100% success rate for long positions. Th
FREE

Quantum Breakout Lite - CPU-Optimized Breakout EA Quantum Breakout Lite is a sophisticated, CPU-optimized Expert Advisor designed for professional breakout trading. This lightweight version delivers institutional-grade breakout detection with minimal resource consumption, making it perfect for VPS deployment and continuous operation. Key Features Advanced Breakout Detection Dynamic Support/Resistance Analysis: Intelligent detection of key price levels using configurable lookback periods. Adapti
FREE
特別オファー : ALL TOOLS 、各 $35 ! 新ツール は 最初の1週間 または 最初の3回の購入 まで $30 ! MQL5 の Trading Tools チャンネル :最新情報を受け取るため、私の MQL5 チャンネルに参加してください Zero Lag Liquidity は、下位タイムフレームのヒゲプロファイルと高出来高のヒゲから流動性ゾーンを描画します。各異常ローソク足に対して、インジケーターはヒゲ内の出来高ヒストグラムを構築し、ローカルのポイント・オブ・コントロール(POC)を見つけ、その価格をレベルとして描画します。以降の価格の反応に基づき、ラベル、ブレイクシグナル、およびシンプルなトレンド状態をトリガーします。
MT5 版はこちら: Zero Lag Liquidity MT5 Scanner MT4 版はこちら: Zero Lag Liquidity MT4 Scanner その他の製品はこちら: All P roducts 概念 高出来高の長いヒゲ:上ヒゲ/下ヒゲが異常に長く出来高スパイクを伴うローソク足を、対向流動性イ
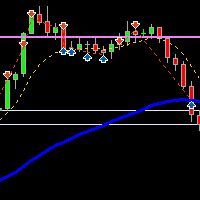
Relative Average Cost of Open Positions Indicator Description: The “Relative Average Cost of Open Positions” indicator is a powerful tool designed for traders who engage in mean reversion strategies. It calculates the average entry price for both buy and sell positions, considering the total volume of open trades. Here are the key features and advantages of this indicator: Mean Reversion Trading: Mean reversion strategies aim to capitalize on price movements that revert to their historical ave
FREE
多シングルと平倉を自動的に実現するEAです。ご利用ください。架台する前に何回かのヒストリカルデータテストを通過しました。以下はEAのマルチシングルと平倉の原理です。 1、2つの均等線から生まれた金叉は自動的に多単買いを実現します。2つの均等線の周期は自分で設定できます。小周期平均線のデフォルト値は5で、大周期平均線のデフォルト値は20です。 2、K線図の始値と終値を比較して減少したK線図かどうかを判断し、連続して3つの下げたK線図(すなわち三羽のカラス)の形態が現れた場合、EAは自動平倉の全部の多単である。 3、ユーザーはEAを開く時に購入の数量を設定できます。設置しないとデフォルトで0.1手となります。自分の資金状況によってこのパラメータを設定して、小さい資金の場合に投資の比率が高すぎることを防ぐように強く提案します。 4、平均線をどの時間周期で運転するかを設定してもいいです。設定しないとデフォルトでは1分間チャートとなります。これは超短線の設定値です。長い線の投資家なら、この値を変更することを勧めます。
FREE

Gold Pro SMC Big Player EA MT5 - Note This EA Can also be used on Indices such as US30, NASDAQ, FR40, DAX, UK, BTCUSD, Metals and Currencies. Write Separately to me for set files after purchase. Set file for Backtesting/forward testing is attached in Comment Section- Must Use it on XAUUSD/Gold in M30 time. The Gold Pro SMC Big Player EA MT5 is a next-generation trading system built on Smart Money Concepts (SMC) and institutional order flow logic .
It identifies high-probability zones where inst

コアラトレンドラインがバージョン1.2にアップグレードされました
最終アップグレードの改善:ユーザーがトレンドラインを2番目、3番目、またはX番目の最高点または最低点に接続できるようにする新しいパラメーターが追加されました。
私の要求 :
**親愛なるお客様はコアラトレンドラインであなたのレビューをリリースしてください、そしてあなたのフィードバックによって私に改善させてください。
コアラのトレンドラインが無料の指標である理由
無料の指標は適格なツールでなければならないと私は信じています。
他の無料製品についてはどうですか?
緑のコアラのロゴが入った商品はすべて私の無料商品です
https://www.mql5.com/en/users/ashkan.nikrou/seller#products
コアラトレンドラインの紹介:
トレーダーがトレンドをよりよく見つけるのを助けるためにこのインジケーターを作成しました。このインジケーターは現在のトレンドラインを示すことができます。
ご存知のように、トレンドラインは2つの最高点または最低点の間に描画する必要があります。
したがっ
FREE
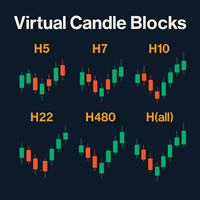
バーチャル・キャンドル・ブロック – 境界のない市場を視覚化 Virtual Candle Blocks は、MetaTrader 5向けの高度なインジケーターで、プラットフォームに本来存在しないカスタム時間足のローソク足を作成し、表示することができます。 主な特徴: カスタム時間足: 基本となるローソク足を、任意の期間(例:5時間、14時間、28時間、72時間など)のブロックにまとめ、新しいバーチャルローソク足を作成します。これにより、TradingViewなどのプレミアムプラットフォームでしか利用できない独自の時間足にアクセスできます。 クリアな表示: バーチャルローソク足を、実体とヒゲ付きでチャート上に直接描画します。色や実体の幅をカスタマイズでき、純粋なプライスアクション分析のためにヒゲを表示するかどうかも選択できます。 完全にカスタマイズ可能: このインジケーターには、選択されたバーチャル時間足を表示するミニマルなパネルが含まれています。MT5のすべての描画ツールと互換性があり、バーチャルローソク足の上にサポートライン、レジスタンスライン、トレンドラインをマークできます。 高
FREE
HEDGING ACCOUNTS ONLY!!! Double Trouble RSI uses 2 Moving averages to define trend then opens trades based on RSI over bought or over sold conditions. It also has a time filter to define trading times. Default settings are for 5 minute timeframe. This EA is highly configurable and can be optimized to be used on most instruments and currencies, including DAX and S&P 500
The money management section is also highly configurable and does not make use of any risky strategies like martingale etc..
FREE

The big figure is a crucial aspect of forex trading, serving as a reference point for trade execution, risk management, and technical analysis. By understanding the importance of the big figure and incorporating it into their trading strategies, forex traders can improve their decision-making process and increase the likelihood of successful trades. Why is the Big Figure Important? The big figure is important for several reasons: Simplification: Traders often refer to the big figure when discu
FREE

HEDGING ACCOUNTS ONLY!!! DO NOT USE DEFAULT SETTINGS!! Multifarious is a multiple strategy trading robot. With 9 indicators, 82 possible trading strategies your possibilities are endless. You can use the following indicators individually or use them together to. Bollinger Bands Moving averages Stochastics RSI Momentum indicator Fibonacci Levels MACD indicator ADX Indicator Fractals Indicator The EA also has a highly configurable money management section to ensure low risk trading. Extra Featu
FREE
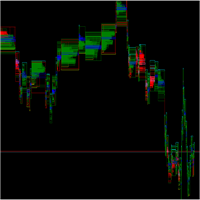
O SpreadFlow é um indicador para MetaTrader que gera um gráfico totalmente baseado no comportamento do fluxo de negócios, em vez de se limitar apenas a candles de tempo ou volume.
Ele organiza as informações de cada tick em quatro dimensões principais: Spread – monitora a diferença entre BID e ASK ao longo do tempo, mostrando momentos de compressão e alargamento do spread, associados a maior ou menor liquidez. Negócio no mesmo preço – identifica quando sucessivos negócios ocorrem no mesmo nível
FREE
Free Until 1st Jan 2026
VWAR 2.2 (Volume Weighted Average Roadmap) is an advanced institutional-grade MT5 indicator that brings you the most powerful multi-timeframe VWAP (Volume Weighted Average Price) analysis—plus filtered trade signals using robust trend and momentum confirmations. Key Features: Multi-Timeframe VWAP Lines:
Plots Daily, Weekly, and Monthly VWAP levels for instant market structure insight. Dynamic Buy/Sell Signals: Big, bold colored arrows indicate confirmed buy or sell opp
FREE

Are You Tired Of Getting Hunted By Spikes And Whipsaws?
Don't become a victim of the market's erratic moves.. Do Something About It!
Instantly make smarter decisions with Impulse Pro's precise balance of filters and accurate statistics.
Timing Is Everything In Trading
To learn more, please visit www.mql5.com/en/blogs/post/718212 Anticipate the next big move before it unfolds in 3 Simple Steps!
Advantages You Get
Early impulse detection algorithm.
Flexible combination to different trading s
- The Symbol Changer Utility for MetaTrader is a tool that enables traders to switch between various symbols on the MetaTrader trading platform easily and quickly. - It is designed to change the symbol of the current and all open chart windows and the timeframe of the current chart window (by clicking the button). - The tool retrieves symbols from the Market Watch, displaying only the necessary symbols in the market watch.
FREE
Simple Strategy Grid Pro is a trading advisor combining four indicators (RSI, Stochastic, MACD, ADX) into a grid-based strategy. Suitable for both novice and experienced traders due to its flexible settings and automation. Strategy The advisor enters trades on signal changes from FALSE to TRUE, using RSI > 50, Stochastic > 50, MACD above signal line, and ADX > 25 for long positions (opposite for shorts). Take Profit is calculated from VWAP, with grid steps adjusted via ATR. Key Features Combin
FREE

Zenith Session Flux is a professional-grade technical indicator for MetaTrader 5 designed to identify and visualize institutional trading windows known as ICT Killzones. The indicator automates the process of time-alignment by synchronizing your broker's server time with New York local time, ensuring that session boxes and price pivots appear at the precise institutional moments regardless of your broker's timezone. Indicator Features: Automatic Timezone Sync: Automatically calculates the offset
FREE

The Candle Countdown Timer for MetaTrader 4 (also available for MT5) is a vital indicator designed to help you manage your trading time effectively. It keeps you updated about market open and close times by displaying the remaining time before the current candle closes and a new one forms. This powerful tool enables you to make well-informed trading decisions. Key Features: Asia Range: Comes with an option to extend the range. Broker Time, New York, London Time: Displays the current broker time
FREE
MetaTraderマーケットはトレーダーのための自動売買ロボットやテクニカル指標を備えており、 ターミナルから直接利用することができます。
MQL5.community支払いシステムはMetaTraderサービス上のトランザクションのためにMQL5.comサイトに登録したすべてのユーザーに利用可能です。WebMoney、PayPal または銀行カードを使っての入金や出金が可能です。
取引の機会を逃しています。
- 無料取引アプリ
- 8千を超えるシグナルをコピー
- 金融ニュースで金融マーケットを探索
新規登録
ログイン