YouTube'dan Mağaza ile ilgili eğitici videoları izleyin
Bir alım-satım robotu veya gösterge nasıl satın alınır?
Uzman Danışmanınızı
sanal sunucuda çalıştırın
sanal sunucuda çalıştırın
Satın almadan önce göstergeyi/alım-satım robotunu test edin
Mağazada kazanç sağlamak ister misiniz?
Satış için bir ürün nasıl sunulur?
MetaTrader 5 için Uzman Danışmanlar ve göstergeler - 43

Harmonic Pattern Suite Pro Introduction Harmonic Pattern Suite Pro is an indicator designed to identify and display harmonic structures on the chart based on X-A-B-C-D sequences. Its purpose is to present pattern formations that meet geometric and proportional criteria, providing a clear visual representation directly on the chart. The indicator automates the detection process, removing the need for manual measurement of ratios and allowing the user to review the structural configuration withou
FREE
Introducing the BB Trader EA, an advanced trading tool harnessing insights from the Bollinger Band indicator. This expert advisor strategically makes use of the upper and lower bollinger bands. Key Features: Flexible trade options: Set the maximum number of trades for single or multiple entries. Optional ATR-adjusted system: Manage multiple trades while dynamically making adjustments for volatility. Versatile grid lot sizing: Choose between static or automatically increasing (non-martingale) op
FREE

GEN Ichimoku Signal Developer: gedeegi Overview GEN Ichimoku Signal is a technical indicator for the MetaTrader 5 platform. It combines two different trend analysis systems, Ichimoku Kinko Hyo and HalfTrend, into a single visual tool. The primary function of the indicator is to color the chart's candlesticks based on whether the conditions of these two systems are in alignment. The indicator provides a visual representation of market conditions by displaying one of three colors: one for aligned
FREE

Capital Vault System , MetaTrader 5 için geliştirilmiş, piyasa yapısını tanımlamak ve piyasa oynaklığını (volatilite) adaptif olarak filtrelemek için tasarlanmış profesyonel bir teknik analiz paketidir. Statik göstergelerin aksine, bu sistem yönlü trendler ile doğrusal olmayan konsolidasyon aralıklarını ayırt etmek için üç matematiksel modeli — Maksimum Entropi Spektral Analizi (MESA) , Fraktal Boyut ve Harmonik Geometri — entegre eder. Yatırımcının piyasa koşullarına göre gerçek zamanlı pozisyo
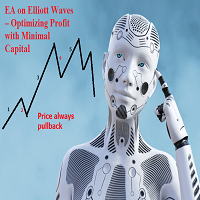
Introducing the Forex Trading EA on Elliott Waves – Optimizing Profit with Minimal Capital The Elliott Wave Theory is one of the foundational principles of technical analysis in any market. Most traders aim to trade within the primary market trend. However, through AI-powered analysis, I have tested and validated that predicting exactly when a main trend begins and ends is virtually impossible. My machine-learning algorithms revealed an intriguing insight during research: there are specific wave

Basic Theme Builder: Grafik Özelleştirmeyi Kolaylaştırın Ticaret deneyiminizi Basic Theme Builder göstergesi ile dönüştürün; MetaTrader 5'te grafik görünümünüzü basit bir panel aracılığıyla kişiselleştirmenizi sağlayan çok yönlü bir araçtır. Bu sezgisel gösterge, çeşitli temalar ve renk şemaları arasında zahmetsizce geçiş yapmanıza olanak tanır ve ticaret ortamınızın görsel çekiciliğini ve işlevselliğini artırır. Free MT4 version Basic Theme Builder göstergesi, MetaTrader 5 grafiklerinizi zahm
FREE

Ratio X AI Gold Fury — MT5 için Yapay Zeka Destekli Altın Ticareti DeepSeek AI mantığını teknik analiz ve disiplinli risk yönetimi ile birleştiren ilk XAUUSD Expert Advisor. Canlı Mod işlemi için DeepSeek API anahtarı gereklidir.
İşlem yapmadan önce, MT5 WebRequest'i deepseek API için etkinleştirin Eksiksiz Yapılandırma Kılavuzu: https://drive.google.com/file/d/17XMJ2yOuaRUKh6LoYzRe8uKGIK3--UJu/view Lansman Teklifi 10 Ekim'e kadar ÜCRETSİZ
Lansman döneminde ücretsiz indirin.
Erken benimse

Master the market: harness the power of statistical arbitrage
This indicator showcases the price action of multiple instruments on a single chart, enabling you to compare the fluctuations of different assets and seamlessly implement statistical arbitrage strategies. Its main usage is to find correlated symbols which are temporarily out of whack.
[ Installation Guide | Update Guide | Troubleshooting | FAQ | All Products ] Find overbought or oversold currency pairs easily Plot up to six currency
FREE

ADX göstergesi trendi ve gücünü belirlemek için kullanılır. Fiyatın yönü +DI ve -DI değerleriyle, ADX değeri ise trendin gücünü gösterir. +DI -DI'nin üzerindeyse piyasa yükseliş trendindedir, tam tersi ise düşüş trendindedir. ADX 20'nin altında ise kesin bir yön yoktur. Gösterge bu seviyeyi kırdığı anda orta güçte bir trend başlıyor. 40'ın üzerindeki değerler güçlü bir trendi (düşüş trendi veya yükseliş trendi) gösterir.
Ortalama Yönlü Hareket Endeksi (ADX) göstergesinin çoklu para birimi ve ç
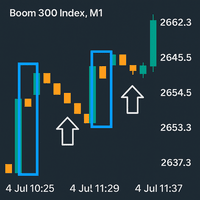
boom Spike Mitigation Zone Pro
A professional spike pattern indicator built for synthetic traders who scalp and swing Boom 500/300/1000/600/900with precision.
This indicator: Detects powerful 3-candle spike formations (Spike → Pullback → Spike) Automatically draws a clean box around the pattern Marks the entry price from the middle candle Extends a horizontal mitigation line to guide perfect sniper entries Automatically deletes & redraws the line once price touches it (mitiga
FREE
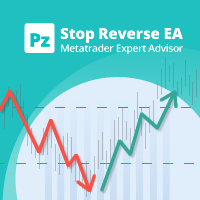
This EA recovers losing trades using a sequential and controlled martingale: it places consecutive trades with increasing lot sizes until the initial trade is recovered, plus a small profit. It offers a complete hassle-free trading framework, from managing initial trades to recovery. Please note that the EA implements a martingale, which means that it takes balance losses that are recovered later. [ User Guide | Installation Guide | Update Guide | Troubleshooting | FAQ | All Products ]
Feature

V12 Black Hole — High-Power Grid Trading EA for MT5 V12 Black Hole is a powerful and professionally engineered Expert Advisor for MetaTrader 5 , designed specifically for EURCAD on the H1 timeframe . Built with a strong execution framework and disciplined risk structure, V12 Black Hole operates as a grid-based trading system with a dynamic basket management model , engineered to handle complex market conditions with control and precision. The EA is designed to adapt its internal behavior to evol
FREE
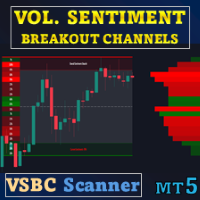
Özel teklif : ALL TOOLS , her biri sadece $35 . Yeni araçlar ilk hafta veya ilk 3 alışveriş için $30 olacaktır! Trading Tools Channel on MQL5 : MQL5 kanalına katılın, benden gelen en son haberleri alın Volume Sentiment Breakout Channels , dinamik fiyat kanalları içindeki hacim duyarlılığına dayalı kırılma bölgelerini görselleştiren bir göstergedir. Kırılmayı yalnızca basit bir teknik fiyat olayı olarak ele almak yerine, alış/satış hacminin konsolidasyon bölgeleri içinde nasıl dağıl

The indicator synchronizes eight types of markings on several charts of one trading instrument.
This indicator is convenient to use in conjunction with "Multichart Dashboard" or other similar assistant that allows you to work with several charts at the same time.
"Multichart Dashboard" can be found under the link on my youtube channel.
Settings:
enable vertical line synchronization
enable horizontal line synchronization
enable Trend Line synchronization
enabling Fibonacci Retracement synchron
FREE

Easy SMC EA – Smart Money Concept Trading Made Simple Easy SMC EA is a powerful automated trading tool based on Smart Money Concepts (SMC) and Fair Value Gap (FVG) logic. Designed for traders who want to leverage institutional strategies with ease, this EA identifies high-probability setups using price imbalances, liquidity sweeps, and momentum-based confirmations.
Key Features: Detects Fair Value Gaps automatically Filters trades based on liquidity zones and market structure Includes trend bia
FREE

Think of the Super Fractal Indicator as the Bill WIlliams Indicator on Steroids. Indicator Abilities: 1. Adjust Candle around Fractal High or Low. 2. Adjust Lookback period and only plot for a specific number of history candles avoiding cluttering your trading desk. 3. The Indicator uses buffers so you call and use it from any EA.
Note : The higher the candles around Fractal, the stronger the Turning point anfd viceversa is true.
FREE

Gold Crowd Density Flip Expert Advisor is a powerful, market-ready trading system designed exclusively for XAUUSD (Gold) on the 15-minute timeframe. Built with precision logic and advanced filters, this EA is engineered to capture explosive breakout opportunities during periods of market compression, while maintaining strict risk management and professional-grade trade execution.
Gold is one of the most volatile and liquid instruments in the financial markets, and trading it successfully requi
FREE

The Nadaraya-Watson Envelope is a non-parametric regression-based indicator that helps traders identify trends, support, and resistance levels with smooth adaptive bands. Unlike traditional moving averages or standard deviation-based envelopes, this indicator applies the Nadaraya-Watson kernel regression , which dynamically adjusts to price movements, reducing lag while maintaining responsiveness.
Key Features: • Adaptive Trend Detection – Smooths price action while remaining responsive to m
FREE
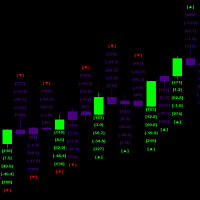
This indicator helps identify the start of significant market movements by analyzing candle patterns and their relative price action strength
the indicator runs multiple simultaneous calculation every millisecond and it also does a triple set verification historically in order to calculate future probabilities the historical processing has to be completed before new Candlestick can be processed as one total set out of the total available history from the starting date and time in order to
FREE

Dominator Gold Bot – Expert Advisor for XAUUSD (H1) Dominator Gold Bot is a fully automated trading system developed specifically for XAUUSD on the H1 timeframe .
The EA applies directional volatility analysis, session-based logic, and adaptive risk control to identify structured movement during high-liquidity periods.
It has been designed for stable long-term trading with controlled risk exposure. Important Notice The latest optimized set file is available in the Comments section.
Please downlo
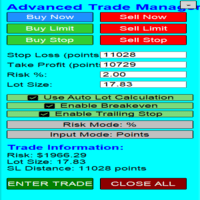
Overview Are you tired of complex manual calculations, emotional execution errors, and the constant fear of risking too much? The Advanced Trade Manager (ATM) is your all-in-one solution, a professional-grade Expert Advisor for MetaTrader 5 designed to give you institutional-level control over every aspect of your trade. From flawless risk calculation to intelligent, one-click execution, the ATM EA streamlines your entire trading process, allowing you to focus on your strategy, not the mechanics
FREE

OHLC Magnet adds the missing magnet points for Horizontal Lines and Price Labels. If you liked this utility, please rate, comment, and check out my other programs.
Instructions:
Simply drag one of the aforementioned objects to the desired Open, High, Low, or Close, within the Pixel Proximity, and OHLC Magnet will automatically attach the object to the exact price point you chose. Parameters:
Proximity (Pixels): The proximity, in pixels, to how close your mouse cursor must be to the Open/High/Low
FREE

The Round Level Indicator automatically draws psychologically significant price levels directly on your chart.
These round numbers often act as key support and resistance zones across all markets and timeframes.
Round Levels are used in my automated EA: Opal This indicator works best when combined with other tools and strategies, e.g.: Price Action Strategies
Round levels often align with key support/resistance. Use it with candlestick patterns (like pin bars or engulfing bars) to confirm high
FREE

Renko Trading Bot EA – MetaTrader 5 için Renko Grafikleri Otomatik Ticaret Danışmanı Tanım Renko Trading Bot EA 20. yüzyılın başlarında Japon traderlar tarafından geliştirilen Renko grafik sistemi temel alınarak oluşturulmuş profesyonel bir ticaret çözümüdür. Bu güçlü otomatik danışman, Renko dalga formasyonlarını yüksek doğrulukla tanır ve işler, traderlara fiyat hareket teorisini “tuğla” (brick) tabanlı kullanmaları için güvenilir bir çözüm sunar. Renko Trading Bot EA, yalnızca anlamlı fiyat
Coppy Master MT5, MetaTrader 4 ve MetaTrader 5 terminalleri arasında işlemleri kopyalamak için kullanılan bir araçtır. Her iki yönde kopyalamayı destekler:
MT5'ten MT4'e, MT4'ten MT5'e ve aynı tipteki hesaplar arasında. Doğru çalışması için tüm terminallerin tek bir bilgisayarda veya VPS'de başlatılması gerekmektedir.
[ Instruction and Demo ] MetaTrader 4'e kopyalamak için ürünün ayrı bir sürümüne ihtiyaç vardır - Coppy Master MT4 . Ana fonksiyonları: Bağlantı türü
Master ve Receiver mo
Günün yüzde değişim seviyelerini otomatik olarak gösterir ve bunları destek ve direnç seviyeleri olarak sunar — bu, 2MV Frequencies Full göstergesidir. Evandro Soares ’in özel metodolojisine dayanan bu gösterge, destek ve direnç bölgelerini yüzde seviyelerine göre (örneğin: %0,50, %1, %1,50) hızlı bir şekilde belirlemenizi sağlar. Tamamen özelleştirilebilir olup, trend dönüşlerini, kırılmaları ve yatay bölgeleri net ve doğru bir şekilde tahmin etmenize yardımcı olur. Destek ve direnç bölgel

VR Izgara göstergesi, kullanıcı tanımlı ayarlarla grafiksel bir ızgara oluşturmak için tasarlanmıştır . Standart ızgaradan farklı olarak, VR Izgarası dairesel seviyeler oluşturmak için kullanılır. Kullanıcının seçimine bağlı olarak tur seviyeleri arasındaki adım isteğe bağlı olabilir. Ek olarak, diğer göstergeler ve yardımcı programlardan farklı olarak VR Grid, zaman dilimi değiştiğinde veya terminal yeniden başlatıldığında bile ızgaranın konumunu korur . Ayarlar, set dosyaları, demo versiyonlar
FREE

Corazon is an EA that operates using the martingale method, with carefully selected entry points. When a trade goes in the wrong direction, the EA will open martingale orders with increasing lot sizes and distances, then average the price and reset the overall TP for all the orders. Corazon EA also has options for trailing functionality for individual orders, trailing all martingale orders together, or only trailing the initial order.
FREE

Pip Value Calculator - Instant Risk Assessment on Your Chart This powerful and lightweight utility instantly calculates the precise monetary value for any pip movement, displaying it directly on your chart so you can assess risk and potential profit at a glance. At its core, the indicator's sophisticated calculation engine runs silently with every price tick, ensuring the information you see is always up-to-date. It automatically detects the instrument you are trading—whether it's a Forex pair,
FREE

- Displays horizontal lines for Previous Day High (PDH) and Previous Day Low (PDL) on the chart. - Customizable line colors via input parameters. - Sends sound alerts, pop-up notifications, and mobile push notifications upon the initial crossover of PDH or PDL. - Alerts are triggered only once per crossover event; they re-trigger only if the price moves away and re-crosses after a specified minimum interval. - Automatically updates the PDH/PDL levels at the start of each new day. - All indicator
FREE

AlgoMatrix EMA Ribbon Trend Pro (MT5)
Professional EMA Ribbon Trend Indicator for MetaTrader 5
Overview – Built for Traders Who Respect Trends
AlgoMatrix EMA Ribbon Trend Pro is a professional-grade EMA ribbon trend indicator for MetaTrader 5, designed for traders who prefer clean trend confirmation, disciplined entries, and non-repainting signals.
This indicator focuses on one simple goal: helping you trade only when the market is actually trending, while avoiding sideways and cho

Genaral: Not martingale, not a grid; Use on EURUSD Use on M5 EA was opimized only on 2020 year
Signals: There is a good rational algorithm. Work of 3 indicators: WRP, DeMarker, CCI (from 3 timeframes) (you can set a separate Timeframe for each indicator)
Stop Loss/Take Profit: There is a good money management system (there are several type for trailing stop loss); There is virtual levels of Stop Loss / Take Profit; There is smart lot (percent by risk) or fix lot
Important: EA can work on
FREE

ARCA bot - a full-featured, non-syndicated, automated system that uses a time-tested grid strategy adapted to modern conditions. This methodology has appeared since the inception of the financial markets and is still used by many professional traders and hedge funds, as it has shown good results for decades. The expert is fully automated and must be on 24 hours a day to work, so we recommend to use VPS-server, which will provide uninterrupted work of the expert.
Characteristics: Platform: MT5
FREE

Introduction
The PF Maximizer is a game-changing non-repainting technical tool engineered to help traders distinguish genuine trend signals from erratic market fluctuations. By employing sophisticated algorithms and cutting-edge data analysis, this indicator efficiently filters out unwanted noise, empowering traders to identify the precise starting and ending points of substantial market moves.
Signal
Potential buy signal is generated when moving average is going up and the blue line cross a
FREE

YOU CAN NOW DOWNLOAD FREE VERSIONS OF OUR PAID INDICATORS . IT'S OUR WAY OF GIVING BACK TO THE COMMUNITY ! >>> GO HERE TO DOWNLOAD
The Volatility Ratio was developed by Jack D. Schwager to identify trading range and signal potential breakouts. The volatility ratio is defined as the current day's true range divided by the true range over a certain number of days N (i.e. N periods). The following formula is used to calculate the volatility ratio: Volatility Ratio (VR) = Today's True Range
FREE

MT4 Sürümü : https://www.mql5.com/en/market/product/110557 MT5 Sürümü : https://www.mql5.com/en/market/product/110558 Canlı Sinyal : https://www.mql5.com/en/signals/2047369
Son Teknoloji "FAST SCALPER" Uzman Danışmanını Tanıtıyoruz: Küresel Piyasaların Gücünü Hassasiyet ve Yeterlilikle Serbest Bırakın
Dinamik döviz ticareti alanında, eğrinin önünde kalmak, zeka ve teknolojinin eşsiz bir kombinasyonunu gerektirir.
"FAST SCALPER" Uzman Danışmanı, dünya para birimlerinin gücüne dayanan yenilikç

tanıtmak Bu, 21:00-22:00 saatleri arasında ticaret yapan gece ticareti için bir EA'dır. Uzun vadeli firma teklifleri kârlıdır Bir seferde yalnızca bir emirle işlem yapın ve büyük bir kayba neden olmaz Her sipariş için zararı durdur ve kar al, grid, Martin veya diğer yüksek riskli fon yönetimini kullanmayın. Aynı anda birden fazla para birimi için kullanılabilir Varsayılan olarak saat dilimini otomatik olarak ayarla
karakteristik Ticaret tablosu: M15 Takas edilebilir para birimleri: EURUSD,GBPSU
Tanıtım: Grafiklerde Yaratıcılığınızı Serbest Bırakın - "Çizim Yapma Göstergesi"!
Analiz yaparken grafiklerinizi not almakta zorlanmaktan, analizinizi anlamlı hale getirmekten veya fikirlerinizi etkili bir şekilde iletmekten sıkıldınız mı? Artık daha fazla aramanıza gerek yok! Sizlere, grafiklerinizde sadece birkaç tıklama veya kalem darbesi ile kolayca çizim yapmanıza ve not almanıza olanak sağlayan devrim niteliğinde bir araç olan "Çizim Yapma Göstergesi"ni sunmaktan heyecan duyuyoruz.
Yara
FREE

Nimora Price today is 200. When 10 copies are sold, the new price will be 296. Don’t miss the early slot. Currently sold: 1 .
Otomatik ticarette yeni bir çağa Nimora ile adım atın—piyasanın doğal “akış dinamiklerini” yorumlamak için tasarlanmış bir EA. Hassasiyet için tasarlanmış olan bu sistem, gerçek zamanlı moment kaymalarını okumaya, tükenme bölgelerini tespit etmeye ve trend tükenmesinin tersine dönme gücüyle buluştuğu noktada girişler gerçekleştirmeye odaklanır. Bu, katı mekanik ayarların

El AO Hybrid MA Master es un sistema de análisis de momentum avanzado para MQL5 que integra el Awesome Oscillator (AO) de Bill Williams con un modelo de confirmación basado en medias móviles duales . 1. Núcleo del Indicador (Core) Utiliza el algoritmo estándar del AO para medir la fuerza del mercado mediante la diferencia entre una SMA de 5 periodos y una SMA de 34 periodos del precio medio ( $High+Low/2$ ). El histograma está codificado cromáticamente para identificar la aceleración o desaceler
FREE

Venom Crown – Kurallara Dayalı Uzman Danışman Venom Crown, GBPUSD için tasarlanmış, H1 zaman diliminde çoklu uyum koşulları ve kontrollü günlük yürütme ile çalışan kural tabanlı bir Uzman Danışmandır.
Sistem; yapılandırılabilir zaman filtreleri, risk yönetimi kuralları ve isteğe bağlı haber filtresi sunar ve tüm ayarlar giriş parametrelerinden düzenlenebilir.
İşlemler yalnızca tüm dahili koşullar sağlandığında gerçekleştirilir. Live Signal : https://www.mql5.com/en/signals/2350520 Temel özellik

BitBot – BTCUSD için H1 Grafik Üzerinde Gelişmiş Alım Satım Robotu
BitBot, Bitcoin (BTCUSD) için H1 zaman diliminde özel olarak tasarlanmış akıllı ve uyarlanabilir bir alım satım robotudur. Tamamen teknik analiz temellidir ve özellikle kripto piyasalarının volatilitesine karşı işlem hacmine dayalı stratejilerle yüksek hassasiyetli kararlar almayı hedefler.
BitBot’un temel mantığı, Bitcoin ve önde gelen altcoinlerin gerçek zamanlı işlem hacimlerinin analizine dayanır. Farklı zaman dilimlerinde h

Extremum Scalper is a fully automated Expert Advisor, that uses a dynamic MM, probabilistic analysis and also strategy of breakout/rebound from the levels of daily and local extremes, and the candlestick Highs. The price Highs and the tick volume serve as the analyzed parameters. Works in different markets with all trade execution modes. Does not use martingale or hidden methods of increasing the position volume. The EA has 9 different extremum calculation algorithms. Uses a drawdown protection,
FREE
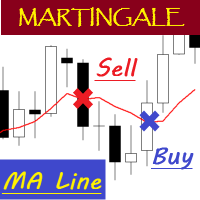
EA "MA Line" with martingale feature
To see how EA works, please watch the video below. In the video, I perform parameter optimization and do a backtest. The parameters that are optimized are: - MA Period - Stop Loss - Take Profit
For the future, I will try to optimize and test EA, especially the expert advisors in the mql5 community. hopefully it can be useful for colleagues in the mql5 community.
FREE

ICT Unicorn Hunter – Multi-Timeframe Smart Setup Detector IMPORTANT: This is a Multi-Timeframe Scanner, looking for 'Unicorn' setups. A Unicorn in this definition is a liquidity sweep, market structure shift and creation of a Fair Value Gap overlapping with the last opposite-close candle before the liquidity sweep (breaker). This scanner does NOT provide visualisation of the Unicorn on the chart.
For visualisation, use the Unicorn Tracker indicator, which is designed to work with the Unicorn
FREE
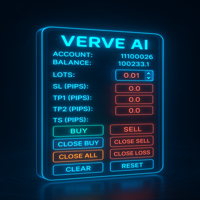
FXTrade Panel – Akıllı ve Hızlı MT5 İşlem Yöneticisi
FXTrade Panel, MetaTrader 5 için tek tıklamayla işlem yürütme ve yönetimi ile alım satım verimliliğinizi artırmak için tasarlanmış gelişmiş ama kullanımı kolay bir işlem aracıdır.
Ana Özellikler: • Hesap Genel Bakış: hesap numarası, kaldıraç, bakiye ve mevcut spread’i gösterir. • Lot Boyutu Kontrolü: sezgisel artı/eksi düğmelerle ayarlanabilir lot boyutu. • Risk Yönetimi: pip cinsinden Stop Loss (SL), Take Profit (TP1, TP2) ve Trailing
FREE

First Scalper is an Expert Advisor based on Scalping, Using the best and safest scalping EA on market. Large number of inputs and settings are tested and optimized and embedded in the program thus inputs are limited and very simple. Using EA doesn't need any professional information or Forex Trading Knowledge.
First Scalper can trade on all symbols and all time frames, using a special and unique strategy developed by the author.
Using EA :
General Options Trade Type : Long/Short/Both Stop

Indicator Description 4 Hull MA Color + Envelopes is a powerful trend-following indicator for MetaTrader 5 that combines four Hull Moving Averages (HMA) with Moving Average Envelopes to clearly identify market direction, trend strength, and potential reversal or pullback zones. This indicator is designed to reduce noise, react quickly to price movement, and provide a clean visual structure for professional trading. Key Features 4 Hull Moving Averages (20, 50, 100, 200) Automatic color change
FREE

This indicator was created based on posts from forex factory thread titled There is no Magic Moving Average - You need only one - by @andose2 a.k.a Andrei Florin. If you want to know about how to use this trading strategy please go and read https://www.forexfactory.com/thread/691864-there-is-no-magic-moving-average-you.
Note: Below are extracts some of the posts .
Estabilish a trend, based on Market Cycles, then go only long in the Markup Phase and only short in the Decline phase , st
FREE

Check out my TRADE PLANNER MT5 – strongly recommended to anticipate account scenarios before risking any money. This is the moving average convergence divergence (MACD) indicator based on Heikin Ashi calculations. Here you find multi-colored histogram which corresponds to bull (green) / bear(red) trend. Dark and light colors describes weakness/strenght of price trend in time. Also you can switch calculations between normal and Heikin Ashi price type.
Note: Buffers numbers for iCustom: 0-MACD,
FREE
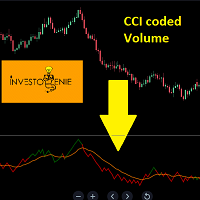
The Indicator is based on Commodity Channel Index (CCI) coded on Volume. The concept is to try and analyze the movement of Volume and Price in a certain direction
Concept:
If the Price of the indicator moves below the threshold price, it turns RED indicating the direction downwards is getting strong.
If the Price of the indicator moves above the threshold price, it turns GREEN indicating the direction upwards is getting strong.
The moving average acts as a great filter to decide entry/exit poi
FREE

Take full control of the market rhythm! The OHLC & Sessions Indicator is a precision analysis tool for MetaTrader 5, specifically designed to make the most important price levels and trading hours visible at a glance. Instead of cluttering the chart with messy lines, this indicator provides a clean, highly professional visualization of daily price action and global trading sessions. Why this Indicator? Real-Time Precision: Instantly identify the Daily High and Low as well as the exact start of t
FREE

Gold Breakout Session EA – Prop Firm & Long-Term Trading Optimized The Gold Breakout Session EA is a precision-based Expert Advisor developed specifically for XAUUSD (Gold) , designed to capture high-quality breakout trades using previous session High / Low levels . This EA focuses on quality over quantity , making it ideal for prop firm challenges and long-term, disciplined trading strategies. Key Features Session Breakout Logic Trades only when price breaks confirmed previous session High or L
FREE

Adaptive Moving Average (AMA) is a trend indicator using moving average and market noise filter. Indicator feature are blue and red points, showing the power of trend. Recommendations for trading: Auxiliary Indicator Detecting trend Detecting power of trend Detecting potential reversal points Main indicator Shows entry points for swing trading Serves as dynamic support and resistance Recommendations for use: Any instrument Any timeframe Input parameters: Period - AMA period Fast Period - fast MA
FREE

Graphical Interface for MT5 Works with Netting and Hedge Accounts; Transform your MT5 into a fully innovative and functional graphical interface. SHIFT/CTRL to place orders; Spacebar to activate the risk meter; P key to display the closing price, high, and low of the previous day; Trade management with stop-loss and take-profit by directly dragging the position line; Updates and improvements coming soon!
FREE

VWAP (Volume Weighted Average Price) indicator with ±1σ and ±2σ bands calculated from real traded volume. The start and end times of the session are fully configurable, as well as the standard deviation levels and the number of bands displayed. It shows the day’s volume-weighted average price and helps traders identify value areas, price extremes, and intraday trading opportunities with precision.
FREE

GridMaster ULTRA - Adaptive Artificial Intelligence The Most Advanced Grid EA on MT5 Market GridMaster ULTRA revolutionizes grid trading with Adaptive Artificial Intelligence that automatically adjusts to real-time market conditions. SHORT DESCRIPTION Intelligent grid Expert Advisor with adaptive AI, multi-dimensional market analysis, dynamic risk management and automatic parameter optimization. Advanced protection system and continuous adaptation for all market types. REVOLUTIONARY
FREE

"NagaRecoil" EA: A highly durable and resilient trading solution for long-term results
The long-awaited EA "NagaRecoil" has finally been released! This EA utilizes two high-performance indicators, RSI and RFTL, to skillfully capture market trend fluctuations and determine the optimal entry point. RSI sensitively detects market overheating, and RFTL predicts future price movements. This combination provides signals for buying and selling. Furthermore, as its name suggests, "NagaRecoil" develops
FREE

MSX AI SuperTrend EA Trend-Following Expert Advisor for MT5 Overview MSX AI SuperTrend EA is a clean, direction-based trading Expert Advisor built on the proven SuperTrend Double Smoothed indicator engine. This EA is designed to demonstrate pure trend execution logic without over-optimization, martingale, grid, or risky recovery systems.
It strictly follows the current SuperTrend direction and executes trades with broker-safe, validator-compliant logic . The system is ideal for traders who va
FREE
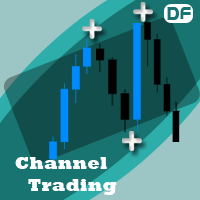
This Expert Advisor follows your channel lines that you draw. and when the price reaches these support and resistance trend lines, EA send open or close order automatically. You must draw two trend line with same color for EA to work, not equidistant channel line. and this color must be specified in ChannelColor parameter Strategies:
Inside Channel Strategy: If the price reaches bottom trend line, the EA will place a buy order. and when the price reaches the top trend point, EA send close order
FREE

This is an optimized version of the Waddah Attar Explosion (WAE) indicator, designed to adapt to different asset classes.
Standard WAE indicators often use a fixed "DeadZone" calculation (usually set to 20). This fixed value may not be suitable for high-volatility assets like Bitcoin, Gold, or Indices (US30), potentially leading to incorrect filtering. This Auto-Adaptive version addresses that calculation issue. The indicator implements a dynamic formula based on ATR and SMMA to automatically ca
FREE

Bu ürün, manuel işlem yöneten yatırımcılar için geliştirilmiş bir trade manager aracıdır.
Kendi başına işlem açmaz, sinyal üretmez veya piyasa tahmini yapmaz. Kullanıcının açtığı veya başka bir robot tarafından açılan işlemler üzerinde: risk hesaplama lot ayarlama kısmi kapama break-even yönetimi gibi işlemleri yardımcı araç olarak gerçekleştirir. ️ Yasal ve Teknik Uyum Kâr garantisi içermez Otomatik kazanç vaadi yoktur Dış bağlantı, reklam veya yönlendirme içermez Tamamen MetaTrader 5 Market
FREE
Stop guessing where the market will turn. Our advanced High/Low Indicator for MT5 is the ultimate tool for mastering price action and identifying key market structure. It automatically scans the chart to identify and clearly plot all critical swing highs and lows in real-time, helping you see the true story behind the candles. These crucial, non-repainting levels form the backbone of any successful trading strategy. Use them to instantly visualize the market's framework, allowing you to pinpoint
FREE
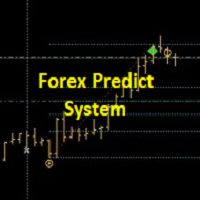
+++++++++++++++++++++++++++++++++++++++++++++++++++++++++++++++++++++++++++++++++++++++++++++++++ +++ Link to EURUSD Only Free Version --> https://www.mql5.com/en/market/product/156904?source=Unknown +++++++++++++++++++++++++++++++++++++++++++++++++++++++++++++++++++++++++++++++++++++++++++++++++ Hallo Trader, This is a traditional GANN & FIBONACCI strategy based on detection of an impulsive move in the opposite direction. This is called a Breakout. At the moment of Breakout, the indicator draw

A Fully Automated strategy with daily trading on high performance indicators to trade Gold (XAUUSD), Bitcoin (BTCUSD) and EURUSD. Inbuilt news filter avoids news and this EA has exit strategy options to reduce risk and protect profits. Safe stop loss and max lot size options for compatibility with funded accounts like FTMO. USE: Default settings on XAUUSD, XAUAUD & EURUSD on the M15 timeframe. Use ECN account for best results. MAIN SETTINGS Setting Value Description Magic Number 101
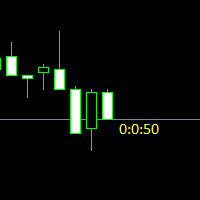
Простая утилита показывающая время до формирования свечи. Может быть очень полезна, если вход в сделку завязан на начале/завершении свечи.
Входные параметры FontColor - Цвет текста. FontSize - Размер текста. FontName - Шрифт текста. TimeOnly - Указывать только время, без дополнительного текста. TypeOfDrawing - Тип отображения информации Важно : в работе программы возможна задержка в 1 секунду.

Overview EMA Scalper is a technical indicator designed for the MetaTrader 5 platform. This tool helps traders identify potential trading signals based on the crossover between price and an Exponential Moving Average (EMA), combined with a dynamic price channel. The indicator is suitable for scalpers or day traders and works across various timeframes and financial instruments. How It Works The indicator's logic is based on two main components: EMA Crossover: The core signal is generated when the
FREE
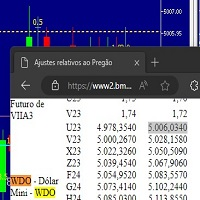
Este script marca no gráfico do ativo MINDOL da activ trades o ponto de ajuste do contrato futuro do Mini Dolar (WDO),
***ATENÇÃO*** para este script funcionar é necessário autorizar a URL da BMF Bovespa no Meta Trader. passo a passo: MetaTrader 5 -> Ferramentas -> Opções -> Expert Adivisors * Marque a opção "Relacione no quadro abaixo as URL que deseja permitir a função WebRequest" e no quadro abaixo adicione a URL: https://www2.bmf.com.br/ este indicador usa a seguinte página para buscar o a
FREE

Smart Fibo Zones are powerful, auto-generated Fibonacci Retracements that are anchored to key market structure shifts . These zones serve as critical Supply and Demand levels, guiding you to identify potential price reactions and confirm market direction. Fibonacci calculations, widely used by professional traders, can be complex when it comes to identifying highs and lows. However, Smart Fibo Zones simplify this process by automatically highlighting order blocks and key zones, compl
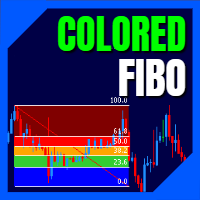
LT Colored Fibo is a simple indicator that paints the price zones between Fibonacci Retracement levels. Its configuration is extremely simple. It is possible to change the colors of each level of the retracement, choose between background or front of the chart and also work only with the current asset or all open. If you found a bug or have any suggestion for improvement, please contact me. Enjoy!
This is a free indicator, but it took hours to develop. If you want to pay me a coffee, I apprecia
FREE
MetaTrader mağazası - yatırımcılar için alım-satım robotları ve teknik göstergeler doğrudan işlem terminalinde mevcuttur.
MQL5.community ödeme sistemi, MetaTrader hizmetlerindeki işlemler için MQL5.com sitesinin tüm kayıtlı kullanıcıları tarafından kullanılabilir. WebMoney, PayPal veya banka kartı kullanarak para yatırabilir ve çekebilirsiniz.
Alım-satım fırsatlarını kaçırıyorsunuz:
- Ücretsiz alım-satım uygulamaları
- İşlem kopyalama için 8.000'den fazla sinyal
- Finansal piyasaları keşfetmek için ekonomik haberler
Kayıt
Giriş yap
Gizlilik ve Veri Koruma Politikasını ve MQL5.com Kullanım Şartlarını kabul edersiniz
Hesabınız yoksa, lütfen kaydolun
MQL5.com web sitesine giriş yapmak için çerezlerin kullanımına izin vermelisiniz.
Lütfen tarayıcınızda gerekli ayarı etkinleştirin, aksi takdirde giriş yapamazsınız.