YouTubeにあるマーケットチュートリアルビデオをご覧ください
ロボットや指標を購入する
仮想ホスティングで
EAを実行
EAを実行
ロボットや指標を購入前にテストする
マーケットで収入を得る
販売のためにプロダクトをプレゼンテーションする方法
MetaTrader 5のためのエキスパートアドバイザーとインディケータ - 45

AlphaPrice MT5 is a trading Expert Advisor (EA) designed for the Forex market and other financial markets via the MetaTrader 5 platform. It is based on a price momentum trading strategy, allowing it to effectively capture strong price movements while minimizing risks during stagnant periods. The EA uses minimal settings, making it easy to set up quickly, and completely avoids risky methods such as martingale and grid strategies. Key Features: Momentum Trading – The EA analyzes market mom
FREE

>>> CHRISTMAS SALE: -60% OFF! - Promo price: $68 / Regular price $169 <<< - The promotion will end soon!
Forex Trend Hunter Live Results: https://www.mql5.com/en/signals/2302404 Forex Trend Hunter is an entirely automated trading system for the MetaTrader 4 trading terminal, developed especially for the needs of ordinary forex traders, yet also used successfully by many professional traders.
Forex Trend Hunter is perhaps the best trend-following and long-term profitable Forex robot on the ma

VR カラー レベルは、トレンドライン、四角形、テキストなどの要素を使用してテクニカル分析を適用する人にとって便利なツールです。グラフにテキストを直接追加したり、スクリーンショットを撮ったりすることができます。 設定、設定ファイル、デモ版、説明書、問題解決方法は、以下から入手できます。 [ブログ]
レビューを読んだり書いたりすることができます。 [リンク]
のバージョン [MetaTrader 4] インジケーターの操作は ワンクリック で実行できます。これを行うには、線の付いたボタンをクリックすると、カーソルの下に傾向線が表示されます。次に、カーソルを移動して 線の位置 を選択し、もう一度クリックして修正します。 インジケーター の特徴は、スタイルと色のすべての変更が自動的に保存され、その後すべての 新しく作成された グラフィック オブジェクトに適用されることです。 このインジケーターには、異なるスタイルのトレンド ラインを設定するための 2 つの独立したボタン、異なるスタイルの 2 つの独立した四角形、独自のスタイルを持つ 1 つのテキスト フィールド、およびスクリーンショット
FREE

With Break Even Trader placed onto your chart, it will automatically place the stop loss and take profit levels when you open a buy or sell order. And when you are in profit by the amount defined in user settings, it will automatically move your stop loss to that break even level, thereby protecting your trade from a loss. Features :
Simple to trade with you just enter your trade it will place the stop loss and take profit as input in user inputs. Sends you an alert when your trade is in profit
FREE
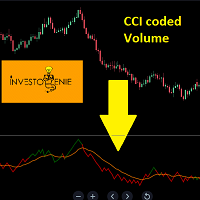
The Indicator is based on Commodity Channel Index (CCI) coded on Volume. The concept is to try and analyze the movement of Volume and Price in a certain direction
Concept:
If the Price of the indicator moves below the threshold price, it turns RED indicating the direction downwards is getting strong.
If the Price of the indicator moves above the threshold price, it turns GREEN indicating the direction upwards is getting strong.
The moving average acts as a great filter to decide entry/exit poi
FREE

Build your EA with Build EA Simple, with it you can build your strategy with the available indicators and tools.
Build EA Simple does not have any defined strategy, but with it you can use combinations of indicators and use them as signals or filters and build your strategy!
Build EA Simple is a simplified version of Build EA that doesn't have as many tools. Discover Build EA Pro https://www.mql5.com/pt/market/product/88859?source=Unknown%3Ahttps%3A%2F%2Fwww.mql5.com%2Fpt%2Fmarket%2Fmy
Indi
FREE

Aureus Prime Signal – Professional Gold Trend Hunter Unlock the core algorithm of the "Aureus Prime" ecosystem for manual trading. Precision, Logic, and Style combined. Aureus Prime Signal is not just another arrow indicator. It is the exact entry engine used in our flagship Expert Advisor (Aureus Prime X), now decoupled and optimized for discretionary traders who demand control over their execution. Optimized for XAUUSD (Gold) M15 This system is strictly tuned for Gold volatility . The defa
FREE

Astra Ea Exclusive Launch Offer: Intro Price: $199.99 Next Price: $1199.99 Limited copies available — act fast before the price increase!
Astra EA – Precision. Power. Perfection. Developed by Faizan & Huraira – The Astra Team
Astra EA is a modular trading engine built for robust performance across major FX pairs and XAUUSD. It merges multiple independent entry frameworks with disciplined exit and risk controls. All components are price-driven and fully automated.
️ Core Strateg
[ MT4 Version ] Are you tired of spending months on demo or live accounts to test your trading strategies? The Backtesting Simulator is the ultimate tool designed to elevate your backtesting experience to new heights. Utilizing Metatrader historical symbol information, it offers an unparalleled simulation of real market conditions. Take control of your testing speed, test ideas quickly or at a slower pace, and witness remarkable improvements in your testing performance. Forget about wasting tim

Major Swing Fibonacci Indicator - Professional Trading Tool What It Does Automatically detects major swing points not internal noise Generates buy/sell signals at key Fibonacci levels Displays professional GUI panel with real-time analysis Marks major swings with visual indicators Trading Strategy BUY at 38.2%-61.8% Fibonacci support in uptrends SELL Past performance is not indicative of future results. This indicator is for educational and informational purposes only and does not constitute in
FREE

MT4バージョン: https://www.mql5.com/ja/market/product/144741 MT5バージョン: https://www.mql5.com/ja/market/product/144742
STEALTH - 目に見えない力、目に見えてわかる利益 STEALTHは、レーダーに隠れて取引したいトレーダーのために開発された次世代エキスパートアドバイザーです。独自の隠し保留注文メカニズムを採用したこのEAは、ブローカーによる早期発見や、偽の市場変動によるスリッページを排除します。
STEALTHは、目に見える保留注文を出す代わりに、目に見えない水平線を執行トリガーとして使用します。価格がこれらのレベルに達すると、EAは隠しSL、TP、トレーリングストップを含む成行注文を即座に発注します。これにより、完全なコントロールと裁量権が確保されます。
主要機能 隠し保留注文 ブローカーに注文を公開することなく、売買ストップロジックを実行。価格がステルスラインに達した場合にのみ実行されます。
見えないSL/TP/トレーリングストップ すべてのリスク管理はプログ

MT4バージョン: https://www.mql5.com/ja/market/product/90950 MT5バージョン: https://www.mql5.com/ja/market/product/93706
Rebate Hunter – マルチペアヘッジグリッドEA(ダイナミックアダプティブ)
Rebate Hunterは、安定した取引量を確保しながら、バスケット利益をコントロールできるよう設計された、マルチペアヘッジグリッドEAです。このEAは、売買を同時に開始し(ヘッジエントリー)、ダイナミックアダプティブグリッドディスタンスと自動バスケットクローズシステムを用いてポジションを管理します。
このアプローチは、安定した利益サイクルと高い取引量を重視しつつ、様々なボラティリティ状況に対応できるEAを求めるトレーダー向けに構築されており、取引量ベースのリベートプログラムの恩恵を受ける口座に最適です。
主な機能 真のヘッジエントリー(買い+売り) Rebate Hunterは、エクスポージャーのバランスを保ち、方向性への依存を軽減するために、2つのポジションを同時に

Otter Scalper Gold は、ブレイクアウト戦略で動作するエキスパートアドバイザーです。EAは、指定されたキャンドルの範囲で高値と安値を検出し、それに基づいてストップオーダーまたはリミットオーダーを配置します。オッタースキャルパーゴールドには、さまざまなストップロスオプションが用意されており、トレード戦略に合わせて多様なストップロスを選択することができます。EAには、損失を最小化し利益を最大化するための高度なマネーマネジメントおよびリスクマネジメントシステムが搭載されています。オッタースキャルパーゴールドは、スキャルピングやトレンドトレードに使用できます。
最初の5つの価格は$99。次の価格:$129。
適用: EURUSD - USDJPY 1H
戦略: Otter Scalper Goldは、ブレイクアウト戦略に基づいています。指定されたキャンドルの範囲を分析して高値と安値を特定し、それらにストップオーダーまたはリミットオーダーを配置します。価格がこの注文を超えたときにポジションが取られます。最後に、選択されたストップロスタイプとテイクプロフィットに応じてポジショ

Level Breakout Indicator is a technical analysis product that works from upper and lower boundaries, which can determine the direction of the trend. Works on candle 0 without redrawing or delays.
In its work, it uses a system of different indicators, the parameters of which have already been configured and combined into a single parameter - “ Scale ”, which performs gradation of periods.
The indicator is easy to use, does not require any calculations, using a single parameter you need to select

The strategy is based on the Alligator technical indicator, described by Bill Williams in "Trading Chaos".
The system is based on three moving averages (Lips, Teeth and Jaw lines), and oscillators, calculated using the difference between them. The trading signals are generated after crossover of the Alligator lines, depending on trend, determined by order of these lines. In the case of upward trend the Lips line (with minimal period) is the highest, the next is the Teeth line, and the lowest is
FREE
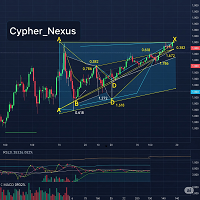
Cypher Pattern Detector A tool for automatic detection of Cypher harmonic patterns (XABCD) in financial charts. Overview The Cypher Pattern Detector identifies both bullish and bearish Cypher harmonic patterns in real time. It applies Fibonacci ratio validation and a quality scoring system to highlight patterns that closely match the defined structure. This helps traders observe and analyze potential market structures more consistently, without the need for manual drawing. Main Features Pattern
FREE

Discount on all my products until 01.05. Gold Veritas は、静かな時間のための完全に自動化された外国為替 Expert Advisor です。 アドバイザーの仕事の監視: https://www.mql5.com/en/users/bayburinmarat/seller 正しい GMT 設定: https://www.mql5.com/en/blogs/post/743531 最も理解しやすくシンプルな最適化に必要なすべてのパラメーターは、わずか6つの設定で利用できます.リスクレベルを調整するか、特定のブローカー用に自分でカスタマイズして、アドバイザーを好みに合わせることができます. XAUUSD、XAUJPY、XAUAUD、XAUEUR の 4 の通貨ペアのパラメータが EA コードに組み込まれています。すべてのブローカーが取引用にそのようなペアを提供しているわけではないことに注意してください。デフォルト設定を使用することも、必要に応じて設定を変更することもできます。
利点:
指値注文を使用することが可能です - これによ

Bring the popular "Crosshair with Magnet Mode" functionality from modern charting platforms directly to your MetaTrader 5 terminal. Crosshair for MT5 is a precision utility tool designed for traders who demand accuracy. Unlike the standard MT5 crosshair, this smart tool automatically detects Open, High, Low, and Close prices on your candles. When your mouse hovers near a candle, the crosshair "snaps" to the nearest wick or body price, ensuring you are looking at the exact price level every tim
FREE

Smart Trade R3 is a simple and easy-to-use trading panel.
It replaces the standard MetaTrader 5 panel. This Expert Advisor is a derivative of Trade Panel R3, already in use by traders worldwide.
It focuses on use in proprietary trading desks where risk controls and limits are very important.
When making a trade, you don't need to worry about lot size, or even entry and exit prices; what matters is the stop loss size in points, and Smart Trade R3 will do the rest.
Check the stop loss size (i
FREE

このダッシュボードは、選択したシンボルの取引戦略に応じて、スキャルピングと長期モードの両方で、チャート上の需給ゾーンを発見し表示します。さらに、ダッシュボードのスキャナーモードは、一目ですべての希望のシンボルをチェックし、適切なポジションを見逃さないようにするのに役立ちます / バージョンMT4 無料インディケータ: Basic Supply Demand
特徴
複数の通貨ペアの取引機会を見ることができ、需給ゾーンの近さに応じてランク付けされた全ペアを明確かつ簡潔に表示します。 色から検出パラメータまで、特定のニーズに合わせてカスタマイズ可能な設定
主な入力
Indicator mode : 新機能を備えたインジケーター・モードまたはパネル・モードから選択。 Symbols : "主要28通貨ペア "または "選択されたシンボル "から選択。 Selected Symbols : カンマで区切られた監視したいシンボル (「EURUSD,GBPUSD,XAUUSD」)。お使いのブローカーがペアに接尾辞または接頭辞を付けている場合は、次の2つのパラメータ(ペア接頭辞または

WARNING: Product is out of support! Don't buy it unless you know how it works! Please download free version and test it heavily - it is enough for most uses.
Grid Harvester is an advanced trading robot, that uses grid trading to harvest maximum out of trending and oscillating markets. This method of trading is often used to attain high percentage account growths by social traders on a highly unpredictable markets, where simple buy/sell robots are having hard time operating. It can be also use

Big Figure Levels – Key Psychological Price Zones for MT5 Big Figure Levels is a professional trading tool designed for MetaTrader 5 that automatically identifies and draws major psychological price levels, including quarter and half levels. These levels are known to act as powerful support and resistance zones due to their influence on both institutional and retail trader behavior. This indicator is perfect for any trading style—whether you're a scalper, day trader, or swing trader—and is compa
FREE

Crystal Prop Passer — ゴールド(XAU/USD)5分足専用、プロップチャレンジ突破用の自動売買ボット Crystal Prop Passer は、FTMO、MyForexFunds、The5ers などのプロップファームのチャレンジを自動で通過するために設計された高性能なトレーディングアルゴリズムです。XAU/USD(ゴールド)を対象に、5分足で取引を行い、高頻度で正確なエントリーを実現します。 適応型ロジックと厳格なリスク管理により、初心者から上級者まで幅広く活用できます。 Crystal Prop Passer の特徴: 5分足での取引に特化、高頻度かつ高速なチャレンジ達成 ゴールド(XAU/USD)のみ取引、ボラティリティが高くチャレンジに最適 プロップファームのルールに最適化(ドローダウン、日次リスク、利益目標) MetaTrader 4 / 5 に対応 セットアップは簡単で、フルサポートあり 特別価格:
最初の 3本のみ 特別価格 99ドル
その後は 299ドル に値上げされます。 数量限定、早めの購入をおすすめします。

Advanced Risk Manager EA - Complete User Guide What is Advanced Risk Manager EA? The Advanced Risk Manager EA is a professional risk management and account protection system for MetaTrader 5. It's NOT a trading robot that opens trades - instead, it protects your account by monitoring your trading activity and enforcing strict risk limits. Core Purpose Prevent account blowups by enforcing daily loss limits Protect profits with automatic profit targets Monitor trading remotely via Telegram Close u

Indicador com regra de coloração para estratégias que utilizam Inside Bar! Quando rompe a barra inside, se for para cima, compra e posiciona o stop loss na mínima da barra inside. Se romper para baixo, vende e posiciona o stop loss na máxima da barra inside. Pode ser aliada a tendências de outros tempos gráficos e outros filtros.
Grupo de sinais gratuito no telegram: https://t.me/InsideBarRST
FREE

This trading strategy uses HeikenAshi candles to smooth out market noise and 2 SMAs for more accurate market entry points. It is suitable for trading any currency pairs, commodities (e.g., gold and oil), and stocks. The strategy was tested on EURUSD with a 1-hour timeframe. Period 01.01.2024 - 27.07.2024 Recommended parameters: Lots = 1 StopLoss = 490 TakeProfit = 310 Moving averages parameters: FastMA = 66 SlowMA = 32 Before starting, make sure that the Heiken Ashi indicator, located in Indicat
FREE

Quantum Hedge - プロフェッショナルレベルのヘッジEA
本EAは、動的なリスク管理とリアルタイムの回復プロトコルにより柔軟性を再定義し、急速に変化する市場で常に一歩先を行けるようにします。
***購入後、最新のセットファイルを受け取るために開発者へご連絡ください***
主な特徴: 比類なき適応型リスク管理とヘッジ戦略 カスタムヘッジ&ロット管理 — ヘッジ距離とロットサイズを微調整し、厳格なリスク管理を維持しながら回復ポテンシャルを最大化します。
高度なインジケーター統合 ストキャスティクス、ボリンジャーバンド、複数のEMA、ADXを組み合わせ、あらゆる市場環境で正確なエントリーとエグジット判断を提供します。
高インパクト市場向けに最適化 マルチアセット対応 — 高ボラティリティ銘柄やさまざまな市場シナリオにシームレスに適応し、豊富なカスタマイズが可能です。 精密トレード — トレンド相場・レンジ相場の両方で、外科手術レベルの精度で利益機会を捉えます。
リアルタイムで適応する次世代テクノロジーでトレードを進化させましょう — 高い柔軟

Gold Prop Breakerは、あらゆるプロップトレーディングチャレンジを制覇するために特別に設計された革新的な自動取引ロボットです。15分および1時間の時間枠に最適化された、綿密に開発された戦略を使用して金の取引に焦点を当てています。 主な特徴: チャレンジの多様性: プロップトレーディングプログラムの厳格な要件を念頭に置いて構築されており、どんなテスト条件でも確実に対応し、安定したパフォーマンスを発揮します。 金市場へのフォーカス: 金市場の独自の特徴を徹底的に分析することで、Gold Prop Breakerは有利な取引シグナルを迅速に特定し、市場機会を捉えます。 柔軟な時間枠設定: 15分チャートと1時間チャートの両方で運用できるため、急速な日内変動から持続的な時間帯のトレンドまで、さまざまな市場環境に適応可能です。 革新的なアルゴリズムとリスク管理: 高度なテクニカル分析手法と適応型リスク管理戦略により、変動の激しい市場環境でも高い取引効率を維持します。 Gold Prop Breakerは、安定した利益を目指し、高頻度の金取引分野であらゆるチャレンジを乗り越える準備

This indicator is designed to detect high probability reversal patterns: Double Tops/Bottoms with fake breakouts . Double top and bottom patterns are chart patterns that occur when the trading instrument moves in a similar pattern to the letter "W" (double bottom) or "M" (double top). The patterns usually occur at the end of a trend and are used to signal trend reversals very early. What this indicator detects: This indicator detects a special form of Double Tops and Bottoms, so called Double To

PipsCounter Basic は MetaTrader 5 用のインジケーターで、未決済ポジションのリアルタイムでのピップ変動を表示し、当日にクローズされた取引のサマリーを提供します。 すべての情報は、チャートのメインウィンドウにわかりやすく控えめな形式で表示されます。 機能 リアルタイムのピップ追跡
各未決済ポジションのピップ差を、市場のティックごとに継続的に更新します。 デイリーピップ合計
当日のすべてのクローズ済み取引の純ピップ値を表示します。 TP/SL 価格ラベル(新機能)
テイクプロフィットおよびストップロスの価格を、それぞれのライン上に自動的に表示。色、フォント、位置はカスタマイズ可能です。 表示のカスタマイズ
パネルの位置(チャートの四隅)、フォント、文字サイズ、利益/損失/ニュートラル状態の色を自由に設定可能。 幅広い互換性
通貨ペア、株価指数、金属、商品、シンセティック資産など、すべての MetaTrader 5 インストゥルメントに対応。ティックサイズ、小数点精度、価格形式に依存しません。 使用例 未決済ポジションのピップ変動を視覚的にモニター。
FREE

Original supertrend indicator in Tradingview platform. Indicator type: Price Action indicator Introduction: The Supertrend Indicator - Enhancing Your Trend Analysis. If you haven't yet found a Supertrend indicator with good graphics on the MQL5 platform, this is the indicator for you. Overview: The Supertrend Indicator is a powerful tool designed to provide traders with valuable insights into the current and historical trends of financial markets. It serves as a valuable addition to any t
FREE
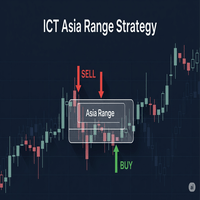
CT Asia Range EA: Trade the "Judas Swing" Like a Pro Are you tired of setting your bias correctly, only to be stopped out by a sudden, manipulative spike before the market moves in your intended direction? Do you see the market constantly engineering liquidity grabs above the Asian session high, only to reverse moments later? It's time to stop being the victim of stop hunts. The ICT Asia Range EA is meticulously engineered to turn this common market manipulation into your most reliable trading s
FREE

AnomalyLogReturn: Statistical Edge & Mean Reversion AnomalyLogReturn is a high-precision statistical tool based on Log Returns . It identifies volatility anomalies and exhaustion points before price reversals occur. Why Log Returns? Unlike standard price action, Log Returns reveal "abnormal" movements that are invisible to the naked eye, providing a true statistical edge. Key Features: Anomaly Detection: Automatically flags when price is statistically overextended. Smart Ad
FREE

Adaptive Hull MA Pro – Trend & Momentum Filter
We value your feedback and believe that your experience with the Hull Moving Average (HMA) is essential to us and other traders. Help us continue to improve and refine our product by sharing your thoughts and insights through a review!
The Hull Moving Average (HMA) Indicator – Your Key to Smoother Trends and Profitable Trades! Are you tired of lagging and choppy moving averages that hinder your ability to spot profitable trading opportunities? Loo
FREE

Forex Shogun: JPY市場の達人 Forex Shogunは、JPYクロス通貨ペアの高速な世界を支配するために綿密に設計された次世代の自動取引システムです。汎用ロボットとは異なり、ShogunはUSDJPY、GBPJPY、EURJPY、NZDJPY、CHFJPY、XAUJPYといった最も変動の激しい日本円シンボル全体で精度と強さを提供することに完全に焦点を当てたスペシャリストです。 H1タイムフレームで動作するShogunの力の核心は、新開発の相関ベースアルゴリズムにあります。これは単なるインジケーターではなく、JPY市場構造のためだけに特別に設計、調整、訓練された多通貨分析システムです。この堅牢なロジックは、長期的な一貫性と信頼性を確保するために、20年以上の履歴データの分析を使用して洗練され、テストされました。 これら6つのJPY関連資産すべてを同時に監視することで、Forex Shogunは単一ペアシステムが見逃す重要な市場間関係と同期した価格変動を検出します。これにより、ロボットは分析上の優位性を獲得し、高確率の機会を特定し、一貫したパフォーマンスを最大化します。
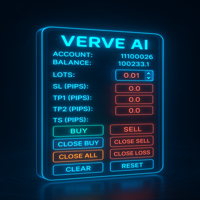
FXTrade Panel – 賢く高速な MT5 トレードマネージャー
FXTrade Panel は、ワンクリックでの注文実行と管理機能を備え、取引効率を大幅に向上させる MetaTrader 5 向けの高機能かつ使いやすいトレーディングツールです。
主な機能: • アカウント概要:口座番号、レバレッジ、残高、現在のスプレッドを表示。 • ロットサイズ制御:直感的な+/−ボタンでロットサイズを調整可能。 • リスク管理:ピップス単位で Stop Loss(SL)、Take Profit(TP1、TP2)、トレーリングストップ(TS)を設定。 • ワンクリックトレード:BUY/SELL注文を即時実行。
ポジション管理: • Close Buy — アクティブな全買いポジションをクローズ。 • Close Sell — アクティブな全売りポジションをクローズ。 • Close All — 全てのポジションを決済。 • Close Profit — 利益のあるポジションのみクローズ。 • Close Loss — 損失のあるポジションのみクローズ。
FREE
Volumized OrderBlocks MTF - Multi-Timeframe Volumetric Order Block Indicator
OVERVIEW
Volumized OrderBlocks MTF is an advanced Multi-Timeframe Order Block indicator that automatically detects, displays, and merges Order Blocks from up to 3 different timeframes on a single chart. Built with institutional Smart Money Concepts (SMC) method
FREE

"Pattern 123" is an indicator-a trading system built on a popular pattern, pattern 123.
This is the moment when we expect a reversal on the older trend and enter the continuation of the small trend, its 3rd impulse.
The indicator displays signals and markings on an open chart. You can enable/disable graphical constructions in the settings.
The indicator has a built-in notification system (email, mobile terminal, standard terminal alert).
"Pattern 123" has a table that displays signals from se
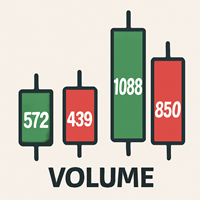
Volume Data on Candles Indicator for MetaTrader 5 Maximize your trading insights with the Volume Data on Candles indicator for MetaTrader 5. This powerful tool provides real-time volume data directly on each candle, allowing you to identify significant shifts in market activity. When the volume of a candle exceeds the average of the last 50 candles, it will be clearly highlighted , ensuring you don't miss out on potential high-volume movements. Key Features: Real-Time Volume Data : Displays volu
FREE

Description: Protect your live or evaluation accounts by not letting it hit the maximum daily draw down! This utility is best for prop firms such as FTMO and MFF(MyForexFunds) and etc. Guide: Apply to EURUSD 1m Chart.
Default Settings: Maximum Draw Down Balance: 4% Account Balance. Maximum Draw Down Equity: 4% Account Balance Target Profit Balance: 1% Account Balance. Target Profit Equity: 1% Account Balance. Time To Reset: 16:57 to 16:58 GMT
Behavior: Setting starting_balance to 0 will auto
FREE

GEN Ichimoku Signal Developer: gedeegi Overview GEN Ichimoku Signal is a technical indicator for the MetaTrader 5 platform. It combines two different trend analysis systems, Ichimoku Kinko Hyo and HalfTrend, into a single visual tool. The primary function of the indicator is to color the chart's candlesticks based on whether the conditions of these two systems are in alignment. The indicator provides a visual representation of market conditions by displaying one of three colors: one for aligned
FREE

The key to success is always good optimisation.
The system has a number of variables and in this case its simplicity is the key to its success. The system looks for the different "Gaps" as market entry failures and then debugs them through a stochastic analysis, i.e. the analysis of two moving averages to see if the price is overvalued or undervalued, and once this is done, the expert advisor will decide whether to perform an action or refrain from performing it. It is a very simple but powerf
FREE

Time Candle with Sound Alert
This indicator will be display the time left candle Features : 1. Multi Time Frames, Multi Pairs 2. Time Left 2. Position dynamic with Bid Price or Edge of Chart Screen 3. Font Size and Color 4. Display Current Spread, Maximum Spread and Minimum Spread
Note: Maximum and Minimum Spread will be reset when you change TF Tested On MT5 Version 5 Build 5200
If you want the source code, just PM me
FREE

BUILD YOUR GRID
The expert is a system to help any trader to make a grid of orders (without martingale, lite martingale, or full martingale) easy and simple. Please make your test to find your settings. Default settings are just to take an idea of how the expert works. The expert can make according or contrary grid of orders. You can set the expert to work in hedge mode if the losses are huge. The system uses a high-risk strategy. It's better to test it first in a demo account. Version for MT4:
FREE

The Nadaraya-Watson Envelope is a non-parametric regression-based indicator that helps traders identify trends, support, and resistance levels with smooth adaptive bands. Unlike traditional moving averages or standard deviation-based envelopes, this indicator applies the Nadaraya-Watson kernel regression , which dynamically adjusts to price movements, reducing lag while maintaining responsiveness.
Key Features: • Adaptive Trend Detection – Smooths price action while remaining responsive to m
FREE

RSI with moving average is great to see when the price is overbought and oversold instead of RSI only.
INPU T PARAME TERS : RSI:
Period - RSI period.
Price - RSI applied price.
Color scheme - RSI color scheme (4 available). MOVING AVERAGE:
Period - MA period.
Type - MA type.
Apply - MA applica tion.
Shift - MA shif t (correc tion). PRICE LINE:
Show - specify if line with price, only line or nothing.
Style - line style. OTHER:
Overbought level - specify the level .
Overbought descriptio
FREE

ゴールドトレーダーの皆様へ! H1のXAUUSD(ゴールド)向けに、新しい無料EAが登場しました。プロフィットファクターは 3.59 、勝率は**69.47%**を誇り、当社のシステムの可能性を垣間見ることができます。 確かな統計に基づき、このEAは 合計利益$7844.71 を生成し、最小ドローダウンは**0.33%**です。ゴールド市場で実績のある戦略を探求したい方に最適なツールです。 ️ 重要! この無料版は 当社のアルゴリズムの強力さを示すサンプル です。利益を最大化し、ゴールド取引で最も高度なツールの全潜在能力を解放したい場合は、フルバージョンとそのプレミアム機能をお見逃しなく。 免責事項: 過去のパフォーマンスは将来の結果を保証するものではありません。EAによる取引にはリスクが伴い、資金を失う可能性があります。 プレミアム版はこちらから入手してください: https://www.mql5.com/es/market/product/141332?source=Site+Profile 今すぐ無料ボットをダウンロードして、その違いを体験してください!
FREE

このユーティリティは、経済ニュースをチャート上に直接表示します。今後のイベント、発表までの時間、重要性を表示し、通知を送信します。
対象:
経済ニュースをフォローしているトレーダー
ニュースに基づいて取引するトレーダー
タイムリーなアラートを受け取りたいトレーダー
チャート上でシンプルで直感的なカレンダーを必要とするユーザー
主な機能 ニュースパネル - 直近の経済イベントをチャート上に表示します
通貨フィルター - 取引銘柄の通貨のニュースのみを表示します
アラート - ニュースリリースの指定時間前に通知します
プッシュ通知 - MetaTraderモバイルデバイスに通知を送信します
サウンドアラート - カスタマイズ可能なサウンドアラート
カラーインジケーター - 重要度と緊急度を視覚的に表示します
設定 AlertMinutesBefore - イベントの何分前にアラートを送信するか
MinImportance - アラートの最小重要度
FilterByCurrency - 現在のシンボルの通貨でニュースをフィルタリングします
EnableSoun
FREE

The Super Boom and Crash Robot operates based on two key indicators: the Relative Strength Index (RSI) and the 200-period Moving Average (MA). It buys when the RSI is above 30, signaling potential for upward momentum, and the 200-period MA is positioned above the current price, indicating a bullish trend. Conversely, it sells when the RSI falls below 70, suggesting overbought conditions, and the 200-period MA is below the price, signaling a bearish trend. This strategy aims to capitalize on pric
FREE

LandBreaker is a meticulously engineered Expert Advisor (EA) designed for the EURUSD H1 chart, focusing on consistent performance and robust risk management . It has undergone extensive testing over a 15+ year period , from 2008 to 2024, based on a specific initial deposit. Out of 1,199 trades executed during this testing period, LandBreaker achieved a high success rate of 99.83% . The performance indicates a 99.79% success rate for short positions and a 100% success rate for long positions. Th
FREE

# QuickTrade Panel - Professional Trading Panel
## Overview
QuickTrade Panel is a professional quick trading panel designed for MT5, integrating market orders, pending orders, iceberg orders, grid orders, smart close functions, and history statistics analysis. It helps traders execute various trading operations quickly and analyze trading performance in depth.
## Core Features
### 1. Market Orders - One-click buy/sell with real-time Ask/Bid prices - Quick lot switching with 6 preset lot siz
FREE

Forex Trade Manager MT5 simplifies managing open orders in MetaTrader 5. If you open a new order, the manager automatically sets Stop Loss and Take Profit. When price will move, then the program could move Stop Loss to Break Even (stop loss = open price) or continuously moving Stop Loss (Trailing Stop) to protect your profits. Forex Trading Manager is able to control orders for only current symbols (where EA works) or for all opened orders (regardless symbol) and hide the Stop Loss and Take Prof
FREE

The indicator shows the time until the candle closes, as well as the server time on the current chart.
Very easy to use, with only four settings.:
Lable Location-the location of the timer on the graph;
Display server time-to show the server time or not;
Sound alert when the candle is closed-to use a sound signal when closing the candle or not;
Color-the color of the timer digits.
Other useful free and paid products can be viewed here: https://www.mql5.com/ru/users/raprofit/seller
FREE

Overview: The US Dollar Index (DXY) is a key financial indicator that measures the strength of the US Dollar against a basket of six major world currencies. This index is crucial for traders and investors as it provides a comprehensive view of the overall market sentiment towards the US Dollar and its relative performance. All Products | Contact Composition: The DXY's composition is as follows: Euro (EUR): 57.6% Japanese Yen (JPY): 13.6% British Pound (GBP): 11.9% Canadian Dollar (CAD): 9.1%
FREE

Product Name: HTF Candle Insight (EurUsd) - See the Big Picture Description: IMPORTANT: This version works EXCLUSIVELY on the EURUSD symbol. (It supports all broker prefixes/suffixes, e.g., pro.EURUSD, EURUSD.m, but will NOT work on Gold, Bitcoin, or other pairs). Experience the full power of "HTF Candle Insight" completely on EURUSD! Stop switching tabs constantly! This indicator allows you to visualize Higher Timeframe price action directly on your current trading chart. Whether you are a Sca
FREE

アクティブな戦略と高度な平均化システムを備えた完全に自動化されたトレンドEA。注文は、信号のセキュリティを強化するためにオシレーターを使用するトレンドフィルターに従って開かれます。シンプルで明確なセットアップがあります。 EAはあらゆる機器や時間枠での使用に適しています 利点: 手動注文を追加する機能を備えた自動システム 調整可能なオーバーラップ回復アルゴリズム 一方向または両方向に取引する能力 反対方向に移動するときに平均化を使用します プラグ可能な自動ボリューム計算 トレンドインジケーターの時間枠を調整する すべてのタイプの通知を送信する組み込み機能 MT4バージョン-> ここ /問題解決-> ここ 入力変数: MAIN SETTING Size of the first order - Volume of orders to open Enable Autolot calculation - Use automatic lot calculation. Autolot allows you to save risk settings when changing the
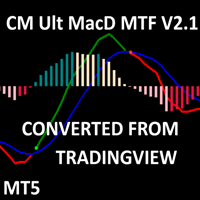
CM MACD Custom Indicator - Multiple Time Frame (V2.1) This advanced MT5 indicator, adapted from ChrisMoody’s TradingView script, delivers a powerful Multi-Timeframe MACD with customizable visuals and alerts. Plotting MACD lines, signal line, and a color-coded histogram, it highlights trend direction and momentum with distinct colors for growing/falling histograms above/below zero. Cross signals are marked with arrows, and users can enable alerts, email, or mobile notifications for buy/sell oppo
FREE

Envelopes RSI Zone Scalper MT5 EA Unleash your trading edge with the Envelopes RSI Zone Scalper MT5 EA , an Expert Advisor for MetaTrader 5, engineered to thrive in any market—forex, commodities, stocks, or indices. This dynamic EA combines the precision of Envelopes and RSI indicators with a zone-based scalping strategy, offering traders a versatile tool to capitalize on price movements across diverse instruments. Whether you’re scalping quick profits or navigating trending markets, this EA del
FREE

EA_XAU_PreLondon_MicroRange_FINAL
XAUUSD – ロンドン市場開始前のマイクロレンジレベル取引 EA
概要
EA_XAU_PreLondon_MicroRange_FINAL は、ロンドン市場開始前に狭いマイクロレンジを形成する XAUUSD 用の時間枠ベースのエキスパートアドバイザーであり、明確に定義された価格レベルを突破した場合にのみ取引を行います。
この EA は、高い取引頻度ではなく、明確な市場構造、制御された執行、一貫したリスク管理に重点を置いています。
取引ロジック(概念)
時間枠(ロンドン前)
この EA は、07:00~08:00(サーバー時間 UTC+1)の固定時間枠で動作します。
マイクロレンジの形成
時間枠の最初の N 分間に、狭い取引レンジ(高値/安値)が形成されます。
小さすぎる、または大きすぎるレンジは除外されます。
レベルベースのブレイクアウト
このレンジレベルが破られた後にのみ、取引が開始されます。
追加のブレイクアウトバッファ付き
オプションで、レンジ外のローソク足終値の場合のみ(フェイクアウトフィ
FREE

Trading can be quite tiring when you need to look at several things at the same time.
Format of candles, supports, resistances, schedules, news and indicators.
This tool aims to facilitate the analysis of the ADX indicator. It colors the candles based on the levels of the indicator and the DI lines.
The period, the limit of the indicator and the colors of the candles are customizable. You can also place a visual aid on the lower right side of the graph to view the values of ADX, DI + and DI-
FREE

BigBull EA (BigB) — XAUUSD Trend-Following Expert Advisor for MetaTrader 5 BigBull EA is a precision-engineered trend-following system built for traders who demand high-confidence entries, disciplined risk control, and adaptive market behavior. Designed primarily for XAUUSD/Gold , BigB dynamically adjusts to different market environments and can be deployed across Forex and other instruments with its flexible system profile. What BigBull EA Does BigBull EA identifies emerging trends, validates

GridMaster ULTRA - Adaptive Artificial Intelligence The Most Advanced Grid EA on MT5 Market GridMaster ULTRA revolutionizes grid trading with Adaptive Artificial Intelligence that automatically adjusts to real-time market conditions. SHORT DESCRIPTION Intelligent grid Expert Advisor with adaptive AI, multi-dimensional market analysis, dynamic risk management and automatic parameter optimization. Advanced protection system and continuous adaptation for all market types. REVOLUTIONARY
FREE
Master Oscillatorsという、取引をシンプルかつフレキシブルに行うことができるボットをご紹介します!RSI、CCI、またはStochasticのシグナルから選択し、あなた自身の戦略を構築してください。このボットは、MAフィルター、ダイナミックロットサイズ、ケリー基準計算機、ダイナミックSLおよびTPレベルなど、多くのツールを提供します。 あなたの取引スタイルに関係なく、Master Oscillatorsはあなたのためにここにあります。重要な情報、統計データなどを提供し、常に取引を安全に保ちます。自分の取引ボットを作りたいと思っていたが方法がわからなかったという方も、Master Oscillatorsがあなたを助けることができます。 今日からMaster Oscillatorsを使い始めて、あなたの取引を向上させましょう!
ユーザーガイド: https://www.mql5.com/en/blogs/post/753361
新着情報!!! アンチマーチンゲールシステムが導入されました!非常に低いリスクで高い利益を得ることができます!
https://www.mql

This panel offers the following features: stop loss, partial sell, take profit, and trailing breakeven levels.
Customizable settings
1: In this area you can set the risk for the order. 2: Likewise, Stop Loss and Take Profit are set manually in the chart. 3: Trailing stop and breakeven can also be activated. Distance adjustable. 4: Order comment can be created. 5: Partial sale by CRV and percentage (if the order is percentage in profit). 6: Partial sale can also be carried out manually an
FREE
Volatility Monitor – リアルタイム変動検出インジケーター 概要 Volatility Monitor は軽量でプロフェッショナルな MT5 インジケーターで、急激な価格変動を監視しトレーダーにリアルタイムで通知します。Forex、ゴールド、JPY ペア、暗号資産などに対応し、ATR 自動検出または手動ピップ閾値で明確なシグナルを提供します。 主な機能 リアルタイム変動検出。 ATR 自動モードまたは手動モード。 漸進的アラート (音、ポップアップ、プッシュ通知)。 色分けマーカー (黄・橙・赤)。 背景に自動適応。 内蔵ダッシュボード。 全シンボル対応。 設定 モード: ATR / Manual。 計算: 過去バー数。 マーカー: 有効/無効、サイズ、色。 アラート: 音、ポップアップ、通知。 ダッシュボード: 位置調整。 使用方法 任意のチャートに追加。 ATR または手動を選択。 マーカーとアラートを確認。 ダッシュボードで確認。 互換性 プラットフォーム: MT5 対応シンボル: Forex, Gold, JPY, Crypto, Indices 時間足: 全
FREE
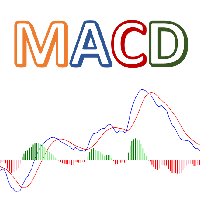
Colorful MACD is MT5 version of TradingView default MACD. This indicator has 4 different colors for MACD histogram, so it's so easy to detect fluctuations in histogram. Features: Colorful Histogram Bars Show/Hide Signal Line Show/Hide MACD Line Flexible price control Please call me if you need more input parameters or modified version of this indicator.
FREE

ScriptBot é um robô multi estratégia desenvolvido para ser prático e robusto, com o ScriptBot você é capaz de criar diferentes estratégias próprias, instale até 51 indicadores do seu gosto e monte o seu próprio gatilho utilizando uma expressões lógica simples.
WARN: Este Expert esta desatualizado , um novo ScriptBot esta sendo reescrito do zero. Abaixo contaremos um pouco sobre a estrutura: Indicadores: ScriptBot não possui indicadores na sua codificação, isso significa que você tem total co
FREE
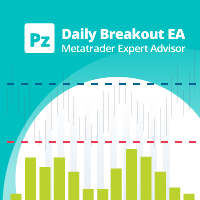
This EA trades daily breakouts placing bidirectional pending orders using the last day's trading range -or using market orders, as desired-, provided these price levels have not been yet tested. It offers many trading behaviors and flexible position management settings, plus a martingale and inverse martingale mode. [ Installation Guide | Update Guide | Troubleshooting | FAQ | All Products ] Easy to use and supervise Customizable break-even, SL, TP and trailing-stop Works for ECN/Non-ECN broker
FREE

Setup Tabajara was created by a Brazilian trader known as "The OGRO of Wall Street" .
The idea of this setup is to indicate to the trader the current trend of prices and the type of operation should be looked for in the graph.
Operation
It does this through the relation of the closing price position and the of 20 periods, by painting the candles in 4 possible colors : Green -> Price rising in upward trend (Search entry points for PURCHASE) Black -> Price correcting in Bullish Trend (Sear
FREE

概要 RainbowVolumeProfile は、指定したバー数の範囲における 価格帯別のティック出来高(Volume Profile) を表示するインジケーターです。
主要な出来高集中帯(POC)を上位5つまで自動検出し、 カラフルなヒストグラム として描画します。
計算は非常に軽量で、リアルタイム更新にも対応しています。 主な特徴 上位5つのPOC(Point of Control)を自動検出・色分け表示 チャート右端に水平ヒストグラムとして描画 時間足を指定して分析(M1〜H4など自由) 新しいバーの出現に応じて自動更新 描画オブジェクトは自動管理(再描画・削除処理付き) 軽量なアルゴリズム構成でスムーズに動作 ️ パラメータ設定 パラメータ名 説明 デフォルト値 CaluculationBars 計算対象とするバー数 120 PriceResolution 価格分割数(ヒストグラム解像度) 25 VolumeProfileWidth プロファイル描画幅(ピクセル) 180 VolumeColor 通常のボリュームカラー WhiteSmoke VolumeColo
FREE
MetaTraderマーケットはMetaTraderプラットフォームのためのアプリを購入するための便利で安全な場所を提供します。エキスパートアドバイザーとインディケータをストラテジーテスターの中でテストするためにターミナルから無料のデモバージョンをダウンロードしてください。
パフォーマンスをモニターするためにいろいろなモードでアプリをテストし、MQL5.community支払いシステムを使ってお望みのプロダクトの支払いをしてください。
取引の機会を逃しています。
- 無料取引アプリ
- 8千を超えるシグナルをコピー
- 金融ニュースで金融マーケットを探索
新規登録
ログイン