Ultimate Double Top Bottom Indicator MT5 FREE
- インディケータ
- バージョン: 1.1
- アップデート済み: 9 7月 2018

This indicator is designed to detect high probability reversal patterns: Double Tops/Bottoms with fake breakouts.
This is the FREE version of the indicator: https://www.mql5.com/en/market/product/29957
The free version works only on EURUSD and GBPUSD!
Double top and bottom patterns are chart patterns that occur when the trading instrument moves in a similar pattern to the letter "W" (double bottom) or "M" (double top). The patterns usually occur at the end of a trend and are used to signal trend reversals very early.
What this indicator detects:
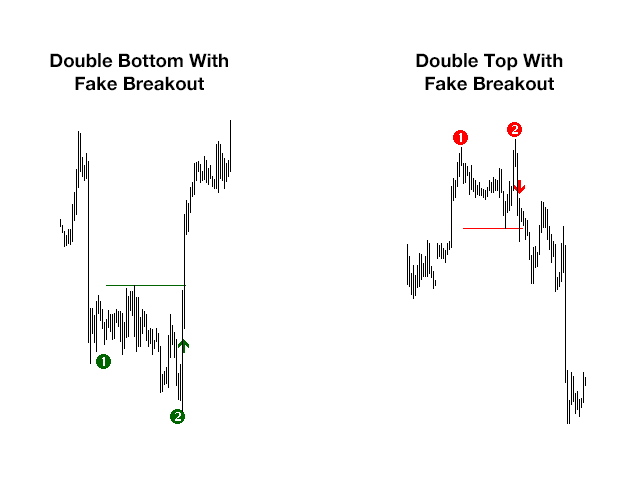
This indicator detects a special form of Double Tops and Bottoms, so called Double Tops/Bottoms with fake breakouts.
For double tops with fake breakouts the highest price of the right shoulder must be higher than the left shoulder. For double bottoms with fake breakouts the lowest price of the right leg must be lower than the left leg.
These special Double Tops/Bottoms are created by the smart money to accumulate its own position size. With the fake breakout the smart money traps as much traders on the wrong side of the market as possible. Then the smart money reverses the direction very sharply. The trapped traders are in panic and exit their position or even reverse their position. This makes the reversal very strong and profitable. The indicator detects exactly these games of the smart money and therefore gives you high probability entry signals.
Please read also the blog post "Professional Trading With Double Tops/Bottoms And Divergences!" which explains the concepts behind the ULTIMATE Double Top/Bottom indicator and how you can use a professional top-down approach.
The provided video shows many example signals and the maximum performance of the indicator.
With maximum performance, I mean that this could have been the profit if you would have exited every trade at the optimal price level. Of course, this can’t be achieved during real trading conditions where you don’t know future price moves.
But the video shows that the raw signals of the indicator (without visual filtering) produced 24 winning trades and only 11 losing trades. In the video, I count a trade as a winning trade if it reaches at least 1R profit (1R = initial risk of the trade). So, these raw signals would be already very profitable if you place the target for all trades at 1R and then leave the trade alone, without trying to find the optimal exit.
This indicator draws the double tops/bottoms on the chart and gives alerts via Email, Push and via MT5-alert in the moment when a high probability double top/bottom entry signal is created.
This indicator does NOT repaint. You can test it in the strategy tester. Then you will see that these good signals come in real-time on every trading instrument and on any timeframe!
Tips:
- I use this indicator on M30 and higher. Then there is less noise in the price moves and I have usually more time to react on entry signals.
- When a signal occurs then ask yourself if there is enough room for a big subsequent move in direction of the trend (support/resistance far away?).
Parameters
- candlesCalculated: With this parameter you can define how many candles backward the indicator should show the double tops/bottoms. The default 2000 means that the indicator will show double tops/bottoms on the newest 2000 candles only.
- alertsLong: True = Yes, False = No - if true, then the indicator alerts occurrences of "Double Bottom"-signals for long entries
- alertsShort: True = Yes, False = No - if true, then the indicator alerts occurrences of "Double Top"-signals for short entries
- alertsViaMT5: True = Yes, False = No - if true, then the indicator gives alerts via MetaTrader 5 popup
- alertsViaEmail: True = Yes, False = No - if true, then the indicator gives alerts via email


Just an excellent indicator. This creator is basically throwing free money our ways. It even signals double tops/bottoms that I would have missed without having this integrated. Prompts me through the platform. 5 stars. Thank you for your time and expertise!