YouTubeにあるマーケットチュートリアルビデオをご覧ください
ロボットや指標を購入する
仮想ホスティングで
EAを実行
EAを実行
ロボットや指標を購入前にテストする
マーケットで収入を得る
販売のためにプロダクトをプレゼンテーションする方法
MetaTrader 5のためのエキスパートアドバイザーとインディケータ - 44
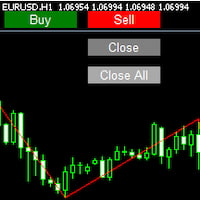
Imagine flying a real aircraft without ever stepping into a flight simulator. That's what trading is like. You have to simulate your strategy before you can take it to a live market. It is good if you can simulate things speedily before even stepping into any live market, or before coming up with an automated system. People don't have all day to stare at a higher timeframe chart until the entry signal finally arrives. That's why I built this so that you can simulate your strategy with speed. Th
FREE
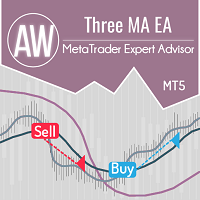
2 つの移動平均線の交点で取引する Expert Advisor は、3 番目の移動平均線を使用して現在のトレンド方向をフィルタリングします。柔軟でありながら、シンプルな入力設定も備えています。 問題解決 -> こちら / MT4版 -> こちら / 説明書 -> ここ 利点: 直感的な簡単セットアップ あらゆる種類の商品とあらゆる時間枠に適しています 3種類の通知があります 最初のオーダーと最後のオーダーをオーバーラップするプラグ可能なシステム 取引量を自動計算する機能 Expert Advisor 戦略。 EA は 3 つの移動平均を使用してポジションをオープンします。主なものは、高速と低速の 2 つの移動するものです。 3 つ目は、市場のノイズを除外するためのスライドです。 動きの速い方が動きの遅い方を下から上に横切る場合、これは買いシグナルです。 動きの速い方が動きの遅い方を上から下に横切る場合、これは売りシグナルです。 3 番目のスライドを使用する場合: 高速移動平均と低速移動平均がフィルタリングされた移動平均を下回っている場合 (下降トレンド)、売

FourAverageは、トレンド検出の新しい単語です。 情報技術の発展と多数の参加者に伴い、金融市場は時代遅れの指標による分析にあまり適していなくなっています。 移動平均や確率などの従来のテクニカル分析ツールは、純粋な形でトレンドの方向やその反転を決定することはできません。 1つの指標は、14年の歴史に基づいて、そのパラメータを変更することなく、将来の価格の正しい方向を示すことができますか? 同時に、横向きの市場の動きで妥当性を失うことはありませんか? 答え:はい、それはできます。 私たちのチームは、変化する市場の状況に適応するためのかなり強力で効果的なメカニズムを持つ指標を開発しました。 2025年には、主要なトレンド指標"Four平均"は開発の新しい段階に入っています。 現代の暗号通貨と株式市場は、この指標のために作成されたようです。 独自の平滑化式を使用すると、通貨ペアまたは他の楽器の任意の機能のための指標を調整(パターンを識別)することができます。 さて、利益を上げるためには、1つの指標で十分であり、これはほんの始まりに過ぎません。 他のツールと組み合わせて、または信号フィル

Major Swing Fibonacci Indicator - Professional Trading Tool What It Does Automatically detects major swing points not internal noise Generates buy/sell signals at key Fibonacci levels Displays professional GUI panel with real-time analysis Marks major swings with visual indicators Trading Strategy BUY at 38.2%-61.8% Fibonacci support in uptrends SELL Past performance is not indicative of future results. This indicator is for educational and informational purposes only and does not constitute in
FREE

KT Volume Profile は、取引量の蓄積データをY軸上にヒストグラムとして表示するインジケーターです。指定された時間範囲や価格帯におけるトレーディングアクティビティを視覚的に把握することが可能です。
Volume Profile における POC(ポイント・オブ・コントロール)
POC は、プロファイル全体の中で最も取引量が多かった価格レベルを示します。この価格帯はサポートやレジスタンスとして、また価格が方向転換前に再度試す重要なレベルとして使われることが多いです。
特徴 非常に簡単に使えます。チャート上で四角形をドラッグ&ドロップするだけで、リアルタイムでボリュームプロファイルが更新されます。 価格がPOCを越えたときにアラートを出すことが可能です。 ゼロから設計され、CPUとメモリの使用を最小限に抑えています。
入力パラメーター ボリュームソース: ティックボリューム / 実際の取引量。 プロファイルの色: ヒストグラムの表示色。 ボックスの幅: 四角形の横幅。 ボックスの色: 四角形の色。 POC を表示: true/false POCの色:

Embark on an exploration of an unparalleled strategy: "Support and MACD." Meticulously designed for USD/CHF on a one-hour timeframe, this intelligent strategy harnesses the power of robust support levels and the unwavering reliability of MACD indicators. While the number of trades executed might be limited, each trade executed is nothing short of exceptional in its impact and potential.
Free until the next update.
For any information, contact me.
FREE
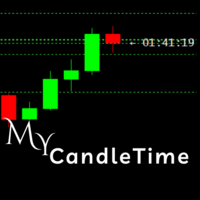
My CandleTime
This indicator displays the remaining time until the current candle closes directly on the chart.
It is designed to help traders keep track of candle formation without constantly checking the platform’s status bar. Main Features Shows countdown timer for the active candle. Works on any symbol and timeframe. Lightweight, does not overload the terminal. Adjustable font size and name. How to Use
Simply attach the indicator to a chart.
You can customize font size, color, and font to
FREE

Introducing Order Blocks Breaker , a brand-new way to identify and leverage order blocks in your trading strategy. After developing multiple order block tools with unique concepts, I’m proud to present this tool that takes things to the next level. Unlike previous tools, Order Blocks Breaker not only identifies order blocks but also highlights Breaker Order Blocks —key areas where the price is likely to retest after a breakout. MT4 - https://www.mql5.com/en/market/product/124101/ This t
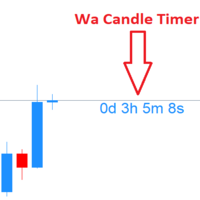
Wa Candle Timer MT5 は、次のローソク足が形成されるまでの残り時間をMT5チャート上に表示する、強力で使いやすいインジケーターです。ローソク足の終了時間を把握することで、より正確なトレードと意思決定を支援します。 主な機能 :
現在のローソク足のカウントダウンを表示
残り時間がユーザー定義のパーセンテージを下回ると色が変化
指定したパーセンテージに達するとアラート通知
フォントとカラーの完全なカスタマイズが可能
時間管理とトレード精度の向上 カスタマイズ可能な設定 :
1️⃣ 閾値以上のタイマー色
2️⃣ 閾値以下のタイマー色
3️⃣ フォントサイズ
4️⃣ フォントスタイル
5️⃣ アラート発生パーセンテージ(%)
FREE

収益性の高い取引機会を簡単に特定するのに役立つ強力な外国為替取引インジケーターをお探しですか?ビースト スーパー シグナル以外に探す必要はありません。 この使いやすいトレンドベースのインジケーターは、市場の状況を継続的に監視し、新しいトレンドを検索したり、既存のトレンドに飛びついたりします。ビースト スーパー シグナルは、すべての内部戦略が一致し、互いに 100% 合流したときに売買シグナルを発するため、追加の確認は不要です。シグナル矢印アラートを受け取ったら、単に売買します。
購入後、プライベート VIP グループに追加されるようにメッセージを送ってください! (完全な製品購入のみ)。
購入後、最新の最適化されたセット ファイルについてメッセージを送ってください。
MT4版は こちらから。
Beast Super Signal EA は こちらから 入手できます。
コメント セクションをチェックして、最新の結果を確認してください。
ビースト スーパー シグナルは、1:1、1:2、または 1:3 のリスクと報酬の比率に基づいて、エントリー価格、ストップ ロス、テイク プ

XAUUSD Scalper Pro Ichimoku MACD
Ichimoku+MACD+マルチタイムフレームトレンドフィルター(MTF)を搭載した、スマートでアグレッシブなXAUUSD M1専用ゴールドスキャルピングEA 概要
XAUUSD Scalper Pro Ichimoku MACD は、 XAUUSD(ゴールド) の M1(1分足) に特化して設計された完全自動スキャルピングEAです。
このEAは、 Ichimoku(雲) と MACD の分析を組み合わせ、短期的な強いモメンタムを検出します。さらに、 H4(4時間足)トレンドフィルター を使用し、主要トレンドの方向にのみエントリーします。 また、 ドル(USD)ベースのテイクプロフィット/ストップロス(TP/SL) システムを採用しており、リスク管理をより直感的に行えます。
スマートトレーリングストップ 機能も搭載しており、利益を動的に確保します。 スピード、安定性、効率性を求めるトレーダーに最適な、論理的で透明性の高いスキャルパーEAです。 主な特徴
ダブルエントリー確認: Ichimoku(転換線/基準線のク

MT4 バージョン: https://www.mql5.com/en/market/product/126488
MT5 バージョン: https://www.mql5.com/en/market/product/126489
Goldie Gold エキスパート アドバイザーは、Metal Gold (XAU/USD) の取引専用に設計された高度に専門化された取引アルゴリズムです。この EA には、複数のブレイクアウト戦略の洗練された組み合わせが組み込まれており、変動の激しい取引セッション中に重要な市場の動きを捉えることができます。マーチンゲール リスク管理アプローチを好むか、従来の固定リスク モデルを好むかにかかわらず、Goldie Gold はさまざまな取引の好みに合わせてカスタマイズできます。
主な機能
ブレイクアウト戦略の統合:
複数の実証済みのブレイクアウト戦略を組み合わせて、高確率のセットアップを識別して取引します。
高度なロジックを使用して偽のブレイクアウトをフィルターし、精度と収益性を高めます。
トレンドとレンジ バウンドの両方の市場状況に適応し、一

A very simple indicator, but one that cannot be missed when carrying out your operations.
Fast and accurate Spreed information before entering a trade as well as the time to start another candlestick.
Spread refers to the difference between the buy (purchase) and sell (offer) price of a stock, bond or currency transaction.
Come and see our mql5 signals too. https://www.mql5.com/pt/signals/899841?source=Site +Signals+From+Author
FREE

Technical Description Daily Trend Lines Pro is an advanced indicator developed in MQL5, designed to provide accurate insights into the market’s daily movements. Based on the moving average calculated from the first candle of each day, the indicator plots a daily trend line that resets at the start of each new day, ensuring visual clarity and clearly delineating trading sessions. Main Features: Dynamic and Accurate Calculation:
The daily line is derived from the moving average value computed fr
FREE

Adaptive Session Trend Pro Easy Plug-and-Play Auto-Optimized Session Trend Indicator for MT5 Adaptive Session Trend Pro is a fully automatic, session-aware trend indicator for MetaTrader 5 that intelligently adapts to the symbol, instrument type, and broker trading session — with zero manual configuration required . Simply attach the indicator to any chart and it instantly: Detects the traded instrument (XAUUSD, US30, EURUSD, Forex pairs) Detects broker server time automatically Applies the cor
FREE

Like most things that work in trading, it's really simple. However, it's one of the most powerful tools I have that makes entries of many systems much more precise.
In its essence, it measures the recent volatility against the medium-term average. How does it work? Markets tend to be prone to strong trending movements when relative volatility is low and tend to be mean-reverting when relative volatility is high.
It can be used with both mean-reversion systems (like the Golden Pickaxe) and mo
FREE
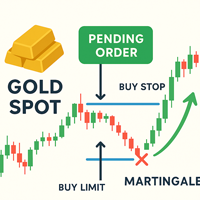
Gold Matrix Pending Pro v1.1 Gold Matrix Pending Pro v1.1 is an automated Expert Advisor developed for trading XAUUSD (Gold) using a pending-order-based execution model .
The Expert Advisor operates strictly according to predefined technical rules and does not provide any performance guarantees. Strategy Overview The Expert Advisor places Buy Stop or Buy Limit pending orders based on current market conditions and user-defined parameters.
All trade decisions are generated automatically without m
FREE

Spike Detector Rider – Intelligent Trading in Volatile Markets Introduction
The Spike Detector Rider is an advanced system for MetaTrader 5 designed to detect explosive price movements in high-volatility assets such as synthetic indices and commodities.
It combines volatility filters, trend analysis, and automated risk management to provide intelligent trade confirmations. After purchase, please send me a private message via MQL5 to receive the installation manual and setup instructions. Asset
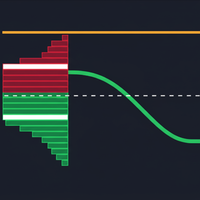
The "Volume Range Profile with Fair Value" (VRPFV) indicator is a powerful volume analysis tool designed to help traders better understand market structure and identify key price areas where significant institutional activity occurs. Instead of just looking at volume on individual candlesticks, VRPFV analyzes the distribution of volume by price level within a specific time range, providing deep insights into the "footprint" of smart money. VRPFV consists of the following core components: Upper &
FREE

The "YK-LOT-SIZE" is a custom indicator for MetaTrader 5 (MT5) that displays the total lot sizes and profits for both buy and sell positions on the current chart. Key features of the indicator: It calculates the total lot sizes for all open buy and sell positions of the current symbol. It calculates the total profits (including commissions and swaps) for all open buy and sell positions. The indicator displays the information on the chart using two lines of text: "BUY Lots: [total buy lots] | BUY
FREE

Volume Weighted Average Price (VWAP) is a trading benchmark commonly used by Big Players that gives the average price a Symbol has traded throughout the day. It is based on both Volume and price. Additionally we put in this indicator the MVWAP (Moving Volume Weighted Average Price). For those who do not know the usage and the importance od this indicator I recommend a great article about this subject at Investopedia ( https://www.investopedia.com/articles/trading/11/trading-with-vwap-mvwap.asp )
FREE

DawnDuskDynamics EA DawnDuskDynamics is a sophisticated trading algorithm that leverages the well-known Morning Star and Evening Star candlestick patterns to identify potential market reversals. This Expert Advisor is designed for traders looking to automate their trading strategies on major currency pairs, ensuring a systematic approach to forex trading. Key Features: Trading Strategy : Utilizes the Morning Star and Evening Star patterns to determine entry points, enhancing the probability of
FREE

ボリンジャーブルートはブルートフォースです ボリンジャーバンドのブレイクアウトとリバージョンEA
(!!!期間限定プロモーション価格をチェック!!!)
リスクが嫌いな場合はゆっくりとカスタマイズするか、リスクが問題にならない場合はカスタマイズして、利益を強引に取ります!
一部のクライアントは、完全な取引ツールではなく、自動化された取引戦略のみを求めていたため、予算を考慮して Bollinger Brute を作成しました。
経済的な価格で、これはそれらのニーズに応えるはずです.
(その大部分は、Traders Toolbox EA から抽出されたコードです)
主な特長:
バンド スクイーズ フィルター - 平均バンド サイズの調整可能な % でバンド スクイーズがある場合にのみ取引を行います。 2 つのカスタマイズ可能な戦略モード - トレード ブレイク アウトのみ、またはブレイク アウトと復帰。 資金管理 - リスクベースまたは固定ロット、マーチンゲールなし。 スタティック / トレーリング ストップ - テイク プロフィットとストップ ロスの両方ですべてのオー

This indicator recognizes a special type of Inside Bar formation which is formed by a big Master candle followed by 4 smaller candles (please see the strategy explanation below). Features Plots buy/sell stop lines on the chart as well as well as take profit and stop loss levels. The TP/SL levels are based on the Average True Range (ATR) indicator. Object colors are changeable. Sends you a real-time alert when a Master candle formation is identified - sound / popup / email / push notification. On

これは無料の取引ボットです。Tick-Bot はユーザーからの入力を受け取り、利益を最大化します。
必要なのは、バックテストで試行錯誤しながら、次の完璧な組み合わせを見つけることだけです。
1. スプレッド - 現在の市場価格と買い/売り指値注文の間の距離。
2. テイクプロフィット - オープンポジションの TP。(TP が不要な場合は 0 を入力してください)
3. ストップロス - オープンポジションの SL。(SL が不要な場合は 0 を入力してください)
4. 待機期間 - アルゴリズムがキャンセルして新しい指値注文を出すまで待機する時間 (ティックで測定)。
Tick-Bot は「マーケットメイキング」のアイデアからヒントを得たもので、このバージョンはまもなくアップロードされる多くのバージョンの中で最もシンプルなバージョンです。
「マーケットメイキング」の概念に精通している方は、コメントで自由に要件を共有してください。
FREE

Eagle Spikes Detector v1.50 - Professional Trading Signal System Ultimate Precision Trading with Advanced SuperTrend Filtering Technology join my telegram channel to trade with me: https://t.me/ +9HHY4pBOlBBlMzc8
The Eagle Spikes Detector is a sophisticated, professional-grade trading indicator designed for serious traders who demand precision, reliability, and visual excellence. Combining advanced multi-timeframe analysis with cutting-edge SuperTrend filtering, this indicator identifi
FREE

Blitz Gold Trader Proの紹介: ゴールド取引を前例のないスピードと精度で実行する最先端のソリューションです。経験豊富なトレーダーと開発者のチームによって作成されたこの高度なトレーディングロボットは、プライスアクション分析、トレンド追跡を組み込み、複数のインジケーターでカスタマイズ可能な強力なアルゴリズムを使用しています。M1タイムフレームで取引を最適化するように設計され、リスクを最小限に抑えながら利益機会を捉えます。 Proバージョンは、無料バージョンとは異なるインジケーターのセットを使用しています。 Blitz Gold Trader Proは、リスク回避の明確な戦略で運用されます: グリッドなし、マーチンゲールなし、ヘッジなし。ロボットは一度に1つのポジションしか開かず、制御されたフォーカスのある取引を保証します。このバージョンはニュースフィルターに依存せず、変動するスプレッドに適応し、ボラティリティの高い市場状況でも継続的に取引を行うことが可能です。 Blitz Gold Trader Proの設定は簡単です。直感的なセットアップにより、ロットサイズを調整し、

BEHOLD!!!
One of the best Breakout Indicator of all time is here. Multi Breakout Pattern looks at the preceding candles and timeframes to help you recognize the breakouts in real time.
The In-built function of supply and demand can help you evaluate your take profits and Stop losses
SEE THE SCREENSHOTS TO WITNESS SOME OF THE BEST BREAKOUTS
INPUTS
MaxBarsback: The max bars to look back
Slow length 1: Period lookback
Slow length 2: Period lookback
Slow length 3: Period lookback
Slow leng
FREE

この強力なツールは、トレンドラインを自動的に識別し、取引戦略を合理化し、より多くの情報に基づいた決定を下すのに役立ちます。 mt4バージョン
重要な機能 自動トレンドライン検出 :「基本的なトレンドライン」インジケーターは、潜在的なトレンドラインの市場をスキャンし、チャートに即座に表示します。これにより、貴重な時間を節約し、重要な傾向を見逃すことはありません。 ユーザーフレンドリーパネル :私たちのインジケータには、さまざまなトレンドラインを簡単に描画できる美しく直感的なパネルが付属しています。パネルは、すべてのエクスペリエンスレベルのトレーダー向けに設計されているため、数回クリックしてトレンドラインを追加、編集、または削除できます。 お気に入りのトレンドラインを保存して管理 :あなたにとって最も重要なトレンドラインを追跡します。私たちのインジケータを使用すると、好みのトレンドラインを保存し、チャートを再訪するたびに常に利用できるようにします。 汎用アプリケーション :外国為替、株、または暗号通貨を取引しているかどうかにかかわらず、「基本的なトレンドライン」インジケーターはさまざまな
Timeframe Simulator Indicator This indicator redraws candlestick structures from a higher timeframe onto your current chart. It helps visualize higher-period price action without switching timeframes, making it easier to analyze trends and key levels while trading on lower timeframes. Main features: Customizable Candles – Adjust the appearance of higher timeframe candles (bull/bear colors, wick style, gaps, and history length). Higher Timeframe Lines – Optionally display dynamic high, low,
FREE

Automatic Trend Line Fit. This indicator automatically plots the straight line and parabolic (curved) trend to any symbol at any timeframe. The plotted straight line is a good indication of the current trend and the curved line is an indication of a change momentum or change in the current trend. Plotting the straight line over about 2/3 the number of candles as the curved line is usually a good way to determine entry and exit points as it shows the current trend and momentum of the market. This
FREE

Ignition Candle Guard is a visual indicator for MetaTrader 5 designed to identify candles with excessive movement relative to the ATR. The indicator highlights candles whose range (High–Low) exceeds a configurable ATR multiple, helping traders avoid late entries after overextended price movements. This indicator does not generate buy or sell signals , does not repaint , and does not execute automated trades .
It works as a visual risk filter and can be used with any strategy, asset, or timeframe
FREE
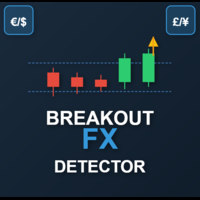
This is a powerful, session-aware breakout indicator designed for serious traders who thrive on volatility and structure. Engineered for precision, it identifies high-probability breakout zones during the London and New York trading sessions—where the market moves with intent. Key Features: Session Range Detection
Automatically detects and highlights the key price range of London and New York sessions. Breakout Confirmation
Identifies breakout candles after the session range, with clear bullis
FREE

Solarwind No Repaintは、正規化された価格データにフィッシャー変換を適用する技術的オシレーターで、潜在的な市場転換点を特定するヒストグラムベースの指標を作成します。この指標は価格変動をガウス正規分布に変換し、周期的パターンとモメンタムシフトをトレーダーにとってより見やすくします。 動作原理 この指標は、いくつかの計算ステップを通じて価格データを処理します: 高値安値分析 :指定期間内の最高値と最安値を計算 価格正規化 :各バーの高値安値レンジの中点を取り、期間レンジに対して正規化し、-1から+1の間で値をスケーリング フィッシャー変換適用 :数学的フィッシャー変換式 0.5 * ln((1+x)/(1-x)) をスムージングとともに適用 トレンドシグナル処理 :値の変化とモメンタム閾値に基づいて方向性シグナルを生成 主要機能 ヒストグラム表示 :別のインジケーターウィンドウでカラーバーとして描画 トレンドベースの色分け :強気モメンタムには緑バー、弱気モメンタムには赤バー ノーリペイント設計 :現在バーでのシグナル変更を防ぐため、完了したバーのみを使用 適応感度 :市
FREE
チャート上で描画するインジケーターをご紹介します:チャート上で創造力を解放しましょう!
トレードチャートに注釈をつけるのに苦労して、分析を理解したりアイデアを効果的に伝えるのに苦労していませんか?それならお探しのものはこちらです!私たちは、チャート上で簡単に描画や注釈をすることができる画期的なツール、「チャート上で描画するインジケーター」をご紹介できることを喜んでいます。わずか数回のクリックやペンのストロークで、あなたのチャートに直接描画や注釈を追加できます。
私たちの革新的なチャート上で描画するインジケーターは、チャート体験を向上させ、あなたの創造力の可能性を引き出すことを目指しています。この強力なツールを手にすれば、思考を簡単に表現し、重要な水準を示し、パターンを強調表示し、トレード戦略を視覚的に表現することができます。経験豊富なトレーダー、テクニカルアナリスト、またはトレーディングの魅力的な世界を探求する初心者であっても、チャート上で描画するインジケーターは、チャートとの対話方法を根本から変える非常に価値のあるツールです。
主な特徴:
使いやすいインターフェース:シーム
FREE

このインジケーターは有名なフラクタルインジケーターに基づいていますが、多くのカスタマイズ と柔軟性があり、
これは、トレンドの反転を特定し、潜在的な利益を最大化するための強力なツールです。
高度な機能とユーザーフレンドリーなインターフェイスを備えた、あらゆるレベルのトレーダーにとって究極の選択肢です。 MT4 バージョン : Ultimate Fractals MT4 特徴 :
カスタマイズ可能なフラクタル キャンドルの数。 反転ライン。 カスタマイズ可能な設定。 ユーザーフレンドリーなインターフェイス。 主なパラメータ: 左側のキャンドル - フラクタルを形成する左側のバーの数。 Candle On Right - フラクタルの右側のバーの数。
市場の不確実性によって行動を妨げないようにしてください。 「究極のフラクタル」インジケーターでトレーディング ゲームをレベルアップさせましょう。
このツールを利用して自信を持って意思決定を行い、財務目標を達成する成功したトレーダーの仲間入りをしましょう。 特定の「Ultimate Fractals MT5」インジケーターの独自の機
FREE
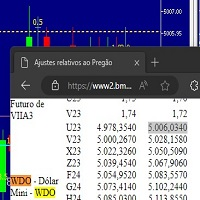
Este script marca no gráfico do ativo MINDOL da activ trades o ponto de ajuste do contrato futuro do Mini Dolar (WDO),
***ATENÇÃO*** para este script funcionar é necessário autorizar a URL da BMF Bovespa no Meta Trader. passo a passo: MetaTrader 5 -> Ferramentas -> Opções -> Expert Adivisors * Marque a opção "Relacione no quadro abaixo as URL que deseja permitir a função WebRequest" e no quadro abaixo adicione a URL: https://www2.bmf.com.br/ este indicador usa a seguinte página para buscar o a
FREE

バブルインジケーター ― 価格減速 + 出来高スパイク検出 価格が突然減速し、同時に出来高が急増したときに、チャート上に色付きの四角を表示するシンプルなビジュアルツールです。
(塗りつぶし機能と同心円状のバブル効果を含む)
市場が動き出す前の重要なタイミングを見極めるのに役立ちます。 インジケーターの役割: 市場が動く前に「ためらう」瞬間を検出 出来高が増えても価格があまり動かないポイントを表示 ブレイクアウトや転換の可能性を事前に察知 動作の仕組み: 現在のチャートよりも小さいタイムフレームを分析 異常に小さいローソク足を検出(価格の減速) 異常に高い出来高を検出(出来高スパイク) 緑(強気)または赤(弱気)の四角を表示 主な設定項目: 価格感度: 値が低いほど反応が敏感 出来高倍率: 値が高いほど検出が厳密 バブルサイズ: 表示の見やすさを調整 なぜ便利なのか: シンプルで視覚的にわかりやすい 複雑な計算は不要 興味深い市場パターンを見つけやすい 完全にカスタマイズ可能 レンジ相場、ブレイクアウト、または市場のダイナミクスを理解するのに最適です。
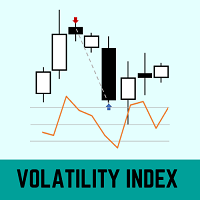
This indicator uses historical volatility and a 21-period moving average to define the price distortion in relation to the average.
The calculation of historical volatility was based on the book (Odds: The Key to 90% Winners) written by Don Fishback.
A Volatility Index with a value greater than 30 may indicate that the price is distorted from its fair price.
QUESTIONS ABOUT THE INSTALLATION OF PRODUCTS AT META TRADER You can also find some instructions on how to install a robot in the Me
FREE
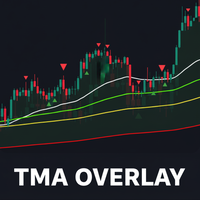
TMA Overlay Indicator for MT5 - User Guide 1. Introduction TMA Overlay is a versatile technical analysis indicator for the MetaTrader 5 platform. The indicator's goal is to provide traders with a comprehensive overview of the trend, potential entry signals, and key trading sessions, all integrated into a single chart. This is not a trading system, but a comprehensive analysis tool designed to help you make more informed decisions. 2. Core Indicator Components The indicator consists of multiple c
FREE
A Smart Price Imbalance Tool with Arrows, Labels, and FVG Zones The Fair Value Gap (FVG) Indicator is designed to automatically detect price imbalance zones on the chart – a widely used concept in Smart Money Concepts (SMC) and Institutional Trading Models (ICT) . These gaps, also known as imbalances or inefficiencies , often highlight areas where price may return to "rebalance" liquidity. Many professional traders consider these levels as high-probability zones for potential reversals, retrace

HEDGING ACCOUNTS ONLY!!! DO NOT USE DEFAULT SETTINGS!! Multifarious is a multiple strategy trading robot. With 9 indicators, 82 possible trading strategies your possibilities are endless. You can use the following indicators individually or use them together to. Bollinger Bands Moving averages Stochastics RSI Momentum indicator Fibonacci Levels MACD indicator ADX Indicator Fractals Indicator The EA also has a highly configurable money management section to ensure low risk trading. Extra Featu
FREE

This indicator is the mql version of the Smoothed Heiken Ashi Candles. Find out more here: https://www.mql5.com/en/users/rashedsamir/seller Heikin-Ashi charts resemble candlestick charts , but have a smoother appearance as they track a range of price movements, rather than tracking every price movement as with candlesticks.
Because the Heikin Ashi candlesticks are calculated based on averages, the candlesticks will have smaller shadows than a regular Japanese candlestick. Just like with
FREE

対称的な三角形のチャートパターンは、価格が上昇または崩壊することを余儀なくされる前の収縮と統合の期間を表しています。下のトレンドラインからのブレークアウトは新しい弱気トレンドの始まりを示し、上のトレンドラインからのブレークアウトは新しい強気のトレンドの始まりを示します。
MT4バージョンはこちらから入手できます:https:// www.mql5.com/en/market/product/68709/
このインジケーターはこれらのパターンを識別し、4つのキーポイントが形成され、価格が再び三角形に戻ったときにアラートを出すので、潜在的なブレイクアウトの準備をすることができます。対称的な三角形は常に完全に対称であるとは限らず、価格は上下する可能性がありますが、通常、最も成功するブレイクアウトは、三角形の最初のポイントを形成した高または低の方向です。したがって、インジケーターはブレイクアウトに対して強気または弱気のバイアスを与え、色分けされ、その特定の方向を警告します。一方向だけで取引を行う必要はありませんが、どちらの方向へのブレイクアウトも可能ですが、最初のポイントのトレンドに沿っ

このダッシュボードは、市場構造反転インジケーターで使用するためのアラートツールです。主な目的は、特定の時間枠での取消の機会と、インジケーターと同様にアラートの再テスト(確認)についてアラートを出すことです。ダッシュボードは、それ自体でチャート上に配置され、バックグラウンドで動作して、選択したペアと時間枠でアラートを送信するように設計されています。多くの人々が1つのMT4の複数のチャートで市場反転インジケーターを実行するのではなく、一度に複数のペアと時間枠を監視するためにダッシュを要求した後に開発されました。 M5、M15、M30、H1、H4、およびD1の時間枠でアラートを出します。もちろん、取引の場合と同様に、より高い時間枠が最も効果的です。 長方形を描画し、特定のペアの市場構造の変化を警告するために作成したインジケーターがダッシュボードを実行します。 ダッシュボードを使用すると、複数のペアと時間枠を監視し、1つのチャートを開いたときにアラートを受け取ることができます。
このダッシュボードは、市場構造反転インジケーターのアドオンとして設計されています。それは独立して機能し、マーケッ

A fully automatic expert
Designed and produced 100% by artificial intelligence This robot is built by the free ChatGPT Ai. Also, to use the AI tool (a great assistant in MetaTrader), you can see this product : https://www.mql5.com/en/market/product/136348 All trades have profit and loss limits
Attributes: Usable:
in currency pair: EURUSD
in time frame: M30
on Account type: Any
in various brokers
in prop companies
with minimum capital ($100)
FREE

概要 RainbowVolumeProfile は、指定したバー数の範囲における 価格帯別のティック出来高(Volume Profile) を表示するインジケーターです。
主要な出来高集中帯(POC)を上位5つまで自動検出し、 カラフルなヒストグラム として描画します。
計算は非常に軽量で、リアルタイム更新にも対応しています。 主な特徴 上位5つのPOC(Point of Control)を自動検出・色分け表示 チャート右端に水平ヒストグラムとして描画 時間足を指定して分析(M1〜H4など自由) 新しいバーの出現に応じて自動更新 描画オブジェクトは自動管理(再描画・削除処理付き) 軽量なアルゴリズム構成でスムーズに動作 ️ パラメータ設定 パラメータ名 説明 デフォルト値 CaluculationBars 計算対象とするバー数 120 PriceResolution 価格分割数(ヒストグラム解像度) 25 VolumeProfileWidth プロファイル描画幅(ピクセル) 180 VolumeColor 通常のボリュームカラー WhiteSmoke VolumeColo
FREE

アドバンスド・ギャンパターン・インジケーター - あなたのトレードを永遠に変える プロトレーダーがあなたに知られたくない、勝率70~95%の秘密のトレードシステムを発見しましょう! リペイントしたり、誤ったシグナルを出したり、エントリーとエグジットのタイミングを間違えたりするインジケーターにうんざりしていませんか?アドバンスド・ギャンパターンが、すべてを変えます。W.D.ギャンの伝説的なパターン123理論(彼が90%以上のトレード精度を達成したのと同じシステム)に基づいて構築されたこのインジケーターは、1世紀にも及ぶ知恵を現代の自動取引に取り入れています。
アドバンスド・ギャンパターンが全てを変える理由 ほとんどのインジケーターの問題点: 偽シグナルが多すぎる 明確なエントリー/エグジットポイントがない 曖昧なターゲットレベル 常にリペイントされている 実際の勝率データがない 使い方が複雑 アドバンスド・ギャンパターンのソリューション: 予備ターゲットの精度:95% 主要利益ゾーンの勝率:70~80% 明確な買い/売り矢印 正確な
FREE

A heatmap is a graphical representation of data in two dimensions, using colors to display different factors. Heatmaps are a helpful visual aid for viewers, enabling the quick dissemination of statistical or data-driven information. The MP Heatmap indicator provides a graphical representation of the relative strengths of major currencies compared to others, organizing data from pairs into color-coded results and producing a clear overview of the entire Forex market. The MP Heatmap indicator dis
FREE

Description (English): Trend Test by Subho – Advanced Trend & Step Channel System Trend Test by Subho is a powerful all-in-one trend trading system designed to filter noise and provide clear market direction. This indicator combines two sophisticated algorithms: the Trend Test () and the Subho Step Channel into a single chart overlay. It also features a stylish Live Dashboard that alerts you to the current trend status in real-time. Key Features: Trend Test () Logic: An advanced tr
FREE

Atlas EAは、RSIと移動平均線を組み合わせたトレンドフォローシステムで、完全に調整可能です。市場が弱気相場に転じ、矢印が赤に変わるとEAは売り、強気相場に転じ、矢印が青に変わるとEAは買います。このEAは上昇トレンドと下降トレンドの始まりを正確に検知し、TPに達するまでマーチンゲール/グリッドスタイルでオープントレードを制御します。 推奨ペア:eurusd、audusd、gbpusd、nzdusdなどの主要通貨ペアに加え、audcad、nzdcad、eurnzd、eurcad(xauusdを含む)などのマイナーペア(m15時間枠) 設定: 開始時間 – EA の開始時間 開始分 – EA の開始分 終了時間 – EA の終了時間 終了分 – EA の終了分 ロット – 取引を開始する最初のロット 可変ロットの使用 – True/False – 資金管理を使用する True/False 0.01 ロットごとのフリー マージン – 0.01 ロットごとのフリー マージン 乗算 – 1.5 などの乗数 最大ロット – 許可される最大ロット 利益確定 – ポイントでの利益確定 ポイン

強力なNRTR(Nick Rypock Trailing Reverse)インディケーターをご紹介します。トレンドの反転を特定し、効果的なトレーリングストップレベルを設定することを目指すトレーダーにとって必須のテクニカルツールです。ニック・ライポックによって開発されたこのインディケーターは、常に変化する市場条件に適応する独自のアルゴリズムを採用しており、どんなトレーダーのツールキットにも欠かせない存在となっています。
以下は、トレーダーがこのインディケーターを使用する人気のある方法です:
1. トレンドの反転:NRTRインディケーターは、トレンドが反転する予兆があるときに明確なシグナルを生成します。インディケーターラインが価格チャートを交差することに注意し、トレンドの方向が変わる可能性を示します。
2. トレーリングストップ:NRTRは、トレンド市場で利益を保護する頼りになるトレーリングストップツールとしても機能します。価格が望む方向に動くと、NRTRラインが価格の下または上に動的に追随し、適応可能なストップロスレベルを提供します。
カスタマイズ可能なパラメータ:NRTRイン
FREE

The EA is a Heikin Ashi–based breakout Expert Advisor (EA) designed for automated pending order trading on the H1 timeframe. By analyzing the previous Heikin Ashi candle’s high and low values, it places Buy Stop and Sell Stop pending orders above and below these levels with a configurable offset.
The EA is built with a time-triggered mechanism that automatically places orders at a specified EST (Eastern Standard Time) hour and minute, ensuring precise trade timing regardless of broker time zon
FREE
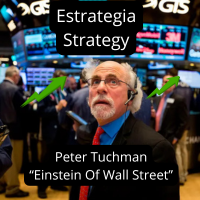
Who is he?: Peter Tuchman, a stock trader on the NYSE.
Why is he famous?: He's known as the "Einstein of Wall Street" because of his physical resemblance to the famous trader and his hairstyle. He's frequently photographed by the media, earning him the nickname "the most photographed trader on Wall Street." His image is often used to illustrate market volatility. Career history: He started in 1985 as a telegraph operator and has held various positions before becoming a stockbroker.
AND THIS I
FREE
フラワーインジケーターは、主にトレンドを特定し、スキャルピングやデイトレード戦略を支援するテクニカル分析ツールです。
フラワーインジケーターは、テクニカル分析と価格動向分析に基づいたシグナルトレンドインジケーターです。色付きの花を使ってトレンドを視覚的に示します。青い花は上昇トレンド、赤い花は下降トレンドを示します。
各レベルはサポートラインとレジスタンスラインのように機能します(チャート上に+/- 200レベルとドットが表示されたら注意してください)。
買われ過ぎ/売られ過ぎの静的レベル、付随するバンド、両方、またはどちらかを突破した時にドットが表示されるように設定できます。
このインジケーターは、アキュムレーション/ディストリビューションゾーンを特定しながら、市場の反転の可能性を探ります。あらゆる銘柄と時間枠に対応しており、パラメータは自由に調整できます。各レベルはサポートラインとレジスタンスラインのように機能します。
FREE

If you love this indicator, please leave a positive rating and comment, it will be a source of motivation to help me create more products <3 Key Takeaways Provides both trend and momentum signals in a single view. Entry and exit signals are based on the crossover of the RSI and Signal Line. Market Base Line offers insight into the overall trend direction. Volatility Bands help identify overbought and oversold market conditions.
FREE
Heiken Ashi Plus is a trading tool in the form of an expert advisor. This EA works based on the change in the color of the Heiken Ashi candle. called a plus because there are additional indicators such as Moving Averages, Stochastic and RSI which you can combine its use with Heiken Ashi candles.
Update V2. = Add Multi TimeFrames Features
Explanation of EA parameters LotMethod : 1 = Fixed Lot, 2 = RiskLot (Freeze of Balance), 3 = Martingale System TrailingStart : Trailing will activated after

BUY INDICATOR AND GET EA FOR FREE AS A BONUS + SOME OTHER GIFTS! ITALO TRIANGLE INDICATOR is the best triangle indicator ever created, and why is that? Using Geometry and Fibonacci the Indicator works on all time-frames and assets, indicator built after 7 years of experience on forex and many other markets. You know many triangle indicators around the internet are not complete, does not help, and it's difficult to trade, but the Italo Triangle Indicator is different , the Italo Triangle Indi

This EA uses two moving averages one slow and one fast, when ever they cross it checks if the RSI value is greater or lesser than 50 depending on the signal given by the Moving averages. After that it checks if the Stochastics lines are going up or down and not in the Over Bought or Over sold zone. so in total it uses an RSI, 2 Moving Averages ,Stochastics and an ATR to try to evade stop hunting.Also has a trailing function to hold the profits if price moves X pips tested on a 5 min time frame
FREE

FVG Detector Multi-TF ( БЕЗ ФЛИКЕРА ) Автоматический индикатор для обнаружения и отображения ключевых ценовых уровней на основе концепций Smart Money Concept (SMC) . Индикатор идентифицирует Ценовые Разрывы Справедливой Стоимости (FVG) и Свинг High/Low одновременно на текущем графике и с нескольких старших таймфреймов. Особенности и преимущества 1. Усовершенствованный Анти-Фликер В отличие от стандартных индикаторов, вызывающих мерцание при тиковых обновлениях, здесь реализована оптимизированна
FREE

EMTB GOLD REAPER – Advanced Multi-Filter Gold Trading EA Experience the Precision of a Professional Gold Trading System. Designed for XAUUSD. Built for Results. Forget guesswork and emotional trading. The EMTB GOLD REAPER is a high-precision, multi-timeframe Expert Advisor engineered exclusively for the gold market (XAUUSD) . It combines robust candlestick logic with a multi-layered, configurable filter system to identify high-probability opportunities and manage risk with institutio
FREE

Maximize your profits and protect your capital on any symbol, any broker, any digits. Demonstration video: https://youtube.com/shorts/enSPf2qCsVU?si=1LBVjmVzgFJE751C The Universal Trailing Stop and Breakeven EA is a powerful, beginner-friendly tool that automates trailing stop management across all your open trades. Whether you are scalping XAUUSD, swinging BTCUSD, or day trading EURUSD, this expert advisor ensures you are always locking in gains while minimizing risk.
What's New in 2.0? Perce
FREE

ADAPTIVE BITCOIN MASTER BOT M10
A sophisticated automated trading solution optimized for Bitcoin Trading on the 10 minute time frame. This powerful Expert Advisor combines multiple technical indicators, candlestick pattern recognition, and adaptive strategy adjustments to deliver consistent results in various market conditions.
Key Features include:
-M10 Timeframe Optimization
-Multi-Indicator Approach
-Advanced Pattern Recognition
-Adaptive Strategy
-Intelligent Risk Management
-Partial
FREE

This indicator is especially for the binary trading. Time frame is 1 minutes and exp time 5 or 3 minutes only. You must be use martingale 3 step. So you must put lots size is 10 % at most. You should use Mt2 trading platform to connect with my indicator to get more signal without human working. This indicator wining rate is over 80% but you may get 100% of profit by using martingale 3 step. You should use MT2 Trading Platform to connect meta trader platform and binary platform . You can get mt2
FREE

Volumized Breaker Blocks MTF Supreme Volumized Breaker Blocks MTF Supreme is a powerful and user-friendly multi-timeframe (MTF) indicator that automatically detects and visualizes Order Blocks (OB) and Breaker Blocks (BB) on your chart. This advanced tool is designed for both beginners and professional traders who want a clean, fast, and insightful way to identify key market levels with volume context. Key Features Multi-Timeframe Support : Instantly plot OB/BB zones from up to three customizab
FREE
EMTB Pro Scalper - Precision Forex Scalping Robot Overview The EMTB Pro Scalper is an advanced Expert Advisor (EA) for MetaTrader 5, built for precise Forex scalping. Using EMA, ATR, and RSI, it identifies high-probability entry/exit points on the M1 timeframe. Ideal for traders seeking profits from rapid market movements without manual monitoring, it suits beginners and experts alike. Supports broker-specific symbol prefixes (e.g., EURUSD_x). Key Features Precision Scalping: Targets small, c
FREE
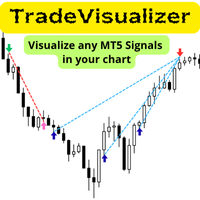
Trade Visualizer インジケーターは、取引データを視覚化し、MT5チャート上にすべての取引履歴を直接表示します。自分のパフォーマンスを分析する場合も、MQL5のシグナル提供者の取引を研究する場合も、このツールは生データを分かりやすいビジュアルに変換します。各トレードはエントリーとエグジットの矢印、接続ライン、価格・利益・ロット数・pipsなどのツールチップで示されます。 注: インジケーターをダウンロードした方は、メールアドレスを添えてご連絡ください。 Trade Visualizer Template を無料でお送りします。 特徴:
• 最新版 ProTrading Analytics Excel Template v1.7 と完全連携。
• 複数トレーダー・戦略を同一銘柄上で比較可能。
• 売買ごとの色・線のスタイル・矢印サイズを自由に設定。
• CSVとブローカーのGMT差を自動調整。
• 複数ブローカーのシンボル接尾辞に対応。
• 戦略ロジックやエントリー精度の可視分析に最適。
FREE

Global Trading Sessions is a technical indicator for MetaTrader 5 designed to identify and mark the opening times of the four major financial sessions: Tokyo, London, New York, and Sydney . The indicator addresses the common challenge of varying broker server times by utilizing a GMT-based calculation logic . By synchronizing with Global Mean Time (GMT), the indicator ensures that session boundaries are accurately placed regardless of the brokerage platform’s local time zone. This makes it an es
FREE

プロ仕様のマルチタイムフレーム・スキャルピングインジケーター。リアルタイムのモバイルアラート、スマートな売買ゾーン、日次シグナル統計を搭載。精度を求めるデイトレーダーとスキャルパー向けに設計。 概要 このインジケーターは、 精度・スピード・明確さ を重視する デイトレーダーとスキャルパー のために作られました。マルチタイムフレーム分析とインテリジェントなシグナルフィルタリングを組み合わせ、高確率のトレード機会を提供します。 リアルタイムアラート 、 売買ゾーン 、 日次パフォーマンス統計 により、市場状況を常に把握できます ― 推測も雑音も不要です。 トレンドフォローでも逆張りでも、このツールはあなたのスタイルに適応し、市場を先取りします。 主な機能 マルチタイムフレーム・シグナルエンジン メイントレンド (H4) → 市場方向フィルター カウンタートレンド (H1) → プルバックと反転 エントリートレンド (M15) → シグナルタイミング確認 レイヤー (M5) → スキャルピング精度 フロートレンド & カウンタートレンドモード フロートレンドシグナル :全タイムフレームが一致

Smart Money Concepts Indicator - Professional ICT/SMC Trading System Transform Your Trading with Institutional-Grade Smart Money Analysis Unlock the power of Smart Money Concepts (SMC) and Inner Circle Trader (ICT) methodologies with this advanced indicator that identifies high-probability entry zones and intelligently sets Take Profit targets at the next Point of Interest (POI). Stop guessing where to exit your trades - let institutional logic guide you to the next Order Block or key market
FREE
MetaTraderマーケットはトレーダーのための自動売買ロボットやテクニカル指標を備えており、 ターミナルから直接利用することができます。
MQL5.community支払いシステムはMetaTraderサービス上のトランザクションのためにMQL5.comサイトに登録したすべてのユーザーに利用可能です。WebMoney、PayPal または銀行カードを使っての入金や出金が可能です。
取引の機会を逃しています。
- 無料取引アプリ
- 8千を超えるシグナルをコピー
- 金融ニュースで金融マーケットを探索
新規登録
ログイン