YouTubeにあるマーケットチュートリアルビデオをご覧ください
ロボットや指標を購入する
仮想ホスティングで
EAを実行
EAを実行
ロボットや指標を購入前にテストする
マーケットで収入を得る
販売のためにプロダクトをプレゼンテーションする方法
MetaTrader 5のためのエキスパートアドバイザーとインディケータ - 46
Master Oscillatorsという、取引をシンプルかつフレキシブルに行うことができるボットをご紹介します!RSI、CCI、またはStochasticのシグナルから選択し、あなた自身の戦略を構築してください。このボットは、MAフィルター、ダイナミックロットサイズ、ケリー基準計算機、ダイナミックSLおよびTPレベルなど、多くのツールを提供します。 あなたの取引スタイルに関係なく、Master Oscillatorsはあなたのためにここにあります。重要な情報、統計データなどを提供し、常に取引を安全に保ちます。自分の取引ボットを作りたいと思っていたが方法がわからなかったという方も、Master Oscillatorsがあなたを助けることができます。 今日からMaster Oscillatorsを使い始めて、あなたの取引を向上させましょう!
ユーザーガイド: https://www.mql5.com/en/blogs/post/753361
新着情報!!! アンチマーチンゲールシステムが導入されました!非常に低いリスクで高い利益を得ることができます!
https://www.mql

Sure, here's a description:
Introducing the Arbitrage Forex Scalper Expert Advisor - your ultimate solution for precise and lightning-fast trading in the forex market. Designed with cutting-edge algorithmic technology, this expert advisor (EA) empowers traders with the ability to capitalize on micro price differentials across various currency pairs, effortlessly exploiting arbitrage opportunities.
Built upon years of meticulous research and development, the Arbitrage Forex Scalper EA operates
FREE

[ZhiBiDW Trend]は、トレンドとショックのシンプルで直感的で効果的な指標です。 これは、15分以上4時間未満のチャート期間に適しており、すべての市場の種類に適しています。
買いシグナル:青い上向き矢印が表示され、その矢印にストップロスとテイクプロフィットのプリセット価格が表示されます。
売りシグナル:赤の下向き矢印が表示され、矢印がストップロスとテイクプロフィットのプリセット価格と共に表示されます。
パラメータ設定の説明
[Send_Alert]:これはアラームスイッチで、trueに設定されていて、矢印が表示されていれば自動的にプロンプトに警告し、falseに設定されていれば警告しません。 [Send_Email]:これはメールを送信するためのスイッチで、trueに設定します。矢印が表示されればMT4で設定したメールボックスにメールを送信し、falseに設定されたらメールを送信しません。 [Send_Notification]:インスタントメッセージを送信するためのスイッチで、trueに設定します矢印が表示されている場合はモバイルデバイスにメッセージを送信し、fal
FREE
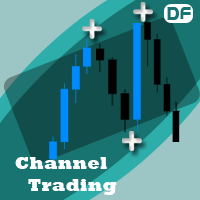
This Expert Advisor follows your channel lines that you draw. and when the price reaches these support and resistance trend lines, EA send open or close order automatically. You must draw two trend line with same color for EA to work, not equidistant channel line. and this color must be specified in ChannelColor parameter Strategies:
Inside Channel Strategy: If the price reaches bottom trend line, the EA will place a buy order. and when the price reaches the top trend point, EA send close order
FREE

NEXA Bb Volatility Trap MetaTrader 5 用エキスパートアドバイザー 1. 概要 NEXA Bb Volatility Trap は、ボリンジャーバンド幅(Bollinger Band Width)の収縮と拡張を基に、市場のボラティリティ変化を検出する自動売買エキスパートアドバイザー(Expert Advisor)です。 本システムは、低ボラティリティ期間の後に発生する価格の拡張的な動きを検出することを目的としています。
すべての取引判断は 確定したローソク足(クローズ足) のデータのみを使用して行われます。 本製品は自動売買ツールであり、すべての取引には損失のリスクが伴います。 2. 取引ロジック 本エキスパートアドバイザーは、2つの異なる時間足を使用します。 2.1 ボラティリティ収縮の検出 上位時間足において、ボリンジャーバンド幅を統計的 Z スコアで分析します。 ボラティリティが平均水準より大きく低下した場合、取引準備状態に入ります。 2.2 エントリートリガー 収縮状態の後、下位時間足で以下の条件がすべて同時に満たされた場合、取引が検討されます
FREE

TCM Breakeven Calculator Ultra is a professional utility designed to instantly visualize your True Weighted Average Entry Price with the Total Lot Size . Unlike simple averages, this tool mathematically accounts for Lot Sizes , giving you the exact price where your net position reaches zero loss. It automatically scans your terminal and isolates trades based on the chart you are viewing. If you are trading multiple pairs (e.g., EURUSD and Gold) simultaneously, this indicator will onl
FREE
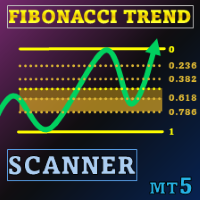
スペシャルオファー : ALL TOOLS 、1つあたり $35 のみ! New tools will be $30 for the first week or the first 3 purchases ! Trading Tools Channel on MQL5 : Join my MQL5 channel to update the latest news from me ボラティリティの高いトレード環境では、パワフルで直感的な分析ツールがあれば、チャンスを素早く捉えることができます。Fibonacci Trend Scanner は従来のFibonacciインジケーター機能とSuperTrendを統合しただけでなく、通貨ペアのスキャン、マルチタイムフレームのモニタリング、そしてトレンドが強気から弱気へ(またはその逆)転換する際にインテリジェントアラートを出す機能など、機能を拡張しています。 See more MT4 version at: Fibonacci Trend MT4 Scanner See more products at: A

Overview Trade Signal Manager Ultimate v7.0 connects MetaTrader 5 to Telegram, enabling you to share professionally formatted trading signals with your group or channel in seconds. The system auto-detects all open positions, displays them on a clean on-chart dashboard, and lets you select and send signals with a single click. No manual typing, formatting, or data transcription required. How It Works The dashboard displays all open positions with complete details including symbol, direction, lot
FREE
Zero Lag SMA for MT5 The Zero Lag SMA (ZLSMA) indicator for MT5 provides a variation of the Simple Moving Average (SMA) designed to minimize lag, offering traders a more responsive moving average that adjusts more quickly to price changes. This makes it useful for identifying potential trend reversals and key price levels in a timely manner.
If you want to see more high-quality products or order the development/conversion of your own products, visit my partners' website: 4xDev
Get 10% OFF on m
FREE

Accurate Gold インジケーターは、経験レベルに関係なく直感的で使いやすいユーザーフレンドリーなツールです。このインジケーターは、ゴールド市場のM5タイムフレームで正確なシグナルを探しているトレーダーを対象に設計されています。このインジケーターは、価格の動きと出来高ダイナミクスを分析するために高度な数学的アルゴリズムを使用し、正確な買いと売りのシグナルを生成します。このインジケーターの特長的な要素、リペイントしない性質を含め、トレーダーには市場の逆転の可能性に対する貴重な洞察を提供し、情報を元にした意思決定を可能にします。チャート上での視覚的な表示、聞こえるアラート、およびプッシュ通知により、ユーザーエクスペリエンスが向上し、正確性と信頼性を求めるゴールドトレーダーのツールキットに貴重な追加となります。 $ XX – 期間限定で、最初の 5 人の支援者には価格が $ XX になります。 ( % 売り切れ)
$88 – その後、発売価格の $88 に戻り、ゴールド シンボルのみに制限されます。
$88 + X ($100) – 5 回購入
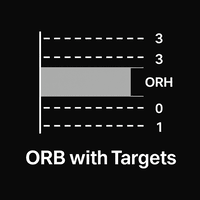
Opening Range Breakout Pro MT5: Stop Guessing, Start Trading the Open. Most traders spend the first 30 minutes of the market open sweating over their keyboards, wondering which way the wind is blowing. Opening Range Breakout Pro does the heavy lifting for you, pinning down the Initial Balance like a pro wrestler so you can stop chasing candles and start hitting targets. Whether it is the London Open volatility or the New York chaos, this indicator draws the line in the sand. You just decide whi
Stop guessing where the market will turn. Our advanced High/Low Indicator for MT5 is the ultimate tool for mastering price action and identifying key market structure. It automatically scans the chart to identify and clearly plot all critical swing highs and lows in real-time, helping you see the true story behind the candles. These crucial, non-repainting levels form the backbone of any successful trading strategy. Use them to instantly visualize the market's framework, allowing you to pinpoint
FREE
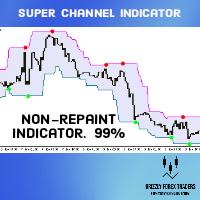
Super Signals Channel Indicator Its channel is a non-repaint indicator that reacts more with recent price movements. For this reason, the Super Signals Channel Indicator is a better match for short-term or day trading strategy. The Super Signals Channel only plots swing trading opportunities. So most of its trade signals appear during consolidation or sidelined periods of the market. Super Signals Channel Indicator for MT5 Explanation The green band below the price shows the dynamic support lev

Original supertrend indicator in Tradingview platform. Indicator type: Price Action indicator Introduction: The Supertrend Indicator - Enhancing Your Trend Analysis. If you haven't yet found a Supertrend indicator with good graphics on the MQL5 platform, this is the indicator for you. Overview: The Supertrend Indicator is a powerful tool designed to provide traders with valuable insights into the current and historical trends of financial markets. It serves as a valuable addition to any t
FREE

This EA trades using the RSI Indicator. It offers many trading scenarios and flexible position management settings, plus many useful features like customizable trading sessions, a martingale and inverse martingale mode. [ Installation Guide | Update Guide | Troubleshooting | FAQ | All Products ] Easy to use and supervise It implements three different entry strategies Customizable break-even, SL, TP and trailing-stop Works for ECN/Non-ECN brokers Works for 2-3-4-5 digit symbols Trading can be NF
FREE

Take Control of Risk with Smart Trailing Stop Manager for MetaTrader 5 Looking for MetaTrader 4 version? I t is available separately in the Market: Smart Trailing Stop Manager MT4 Full User Guide – Public channel: CLICK HERE Tired of missed profits or manual stop loss adjustments?
Smart Trailing Stop Manager is a powerful utility for MetaTrader 5 designed to automate your trailing stop, breakeven, partial close, and SL management. Whether you're a discretionary trader, signal follower, o

ゴールドトレーダーの皆様へ! H1のXAUUSD(ゴールド)向けに、新しい無料EAが登場しました。プロフィットファクターは 3.59 、勝率は**69.47%**を誇り、当社のシステムの可能性を垣間見ることができます。 確かな統計に基づき、このEAは 合計利益$7844.71 を生成し、最小ドローダウンは**0.33%**です。ゴールド市場で実績のある戦略を探求したい方に最適なツールです。 ️ 重要! この無料版は 当社のアルゴリズムの強力さを示すサンプル です。利益を最大化し、ゴールド取引で最も高度なツールの全潜在能力を解放したい場合は、フルバージョンとそのプレミアム機能をお見逃しなく。 免責事項: 過去のパフォーマンスは将来の結果を保証するものではありません。EAによる取引にはリスクが伴い、資金を失う可能性があります。 プレミアム版はこちらから入手してください: https://www.mql5.com/es/market/product/141332?source=Site+Profile 今すぐ無料ボットをダウンロードして、その違いを体験してください!
FREE

スキャルパーのための VWAP
セッション対応 VWAP ラインで高速で正確なスキャルピングが可能。 ️ 入力(MT4/MT5) Enable_Hourly_VWAP: 時間別 VWAP を有効にします。 Enable_Asia_VWAP: アジア セッション VWAP を有効にします。 Enable_Europe_VWAP: ヨーロッパ セッション VWAP を有効にします。 Enable_NA_VWAP: 北米セッション VWAP を有効にします。 Enable_Extended_VWAP: 拡張セッション VWAP を有効にします。 Enable_Daily_VWAP: 日次 VWAP を有効にします。 アジア セッション(GMT) Session_Asia_Start_Hour: アジア セッション開始時刻。 Session_Asia_End_Hour: アジア セッション終了時刻。 ヨーロッパ セッション(GMT) Session_Europe_Start_Hour: ヨーロッパ セッション開始時刻。 Session_Europe_End_Hour: ヨーロッパ セッショ
FREE

Hunt markets with Hunttern ZigZag . Easy to use with one parameter
You can use it for the following: -Classic patterns -Heads and shoulders -Harmonic patterns -Elliott Wave -Support and resistance -Supply and Demand
Single parameter: -Period (1-120)
Features: -Candle time -Single parameter -Light mode template
This is version 1 of Hunttern ZigZag. We are very happy to receive feedback from you.
FREE
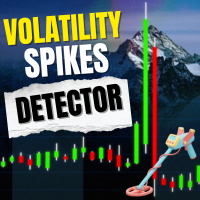
Volatility Monitor – リアルタイム変動検出インジケーター 概要 Volatility Monitor は軽量でプロフェッショナルな MT5 インジケーターで、急激な価格変動を監視しトレーダーにリアルタイムで通知します。Forex、ゴールド、JPY ペア、暗号資産などに対応し、ATR 自動検出または手動ピップ閾値で明確なシグナルを提供します。 主な機能 リアルタイム変動検出。 ATR 自動モードまたは手動モード。 漸進的アラート (音、ポップアップ、プッシュ通知)。 色分けマーカー (黄・橙・赤)。 背景に自動適応。 内蔵ダッシュボード。 全シンボル対応。 設定 モード: ATR / Manual。 計算: 過去バー数。 マーカー: 有効/無効、サイズ、色。 アラート: 音、ポップアップ、通知。 ダッシュボード: 位置調整。 使用方法 任意のチャートに追加。 ATR または手動を選択。 マーカーとアラートを確認。 ダッシュボードで確認。 互換性 プラットフォーム: MT5 対応シンボル: Forex, Gold, JPY, Crypto, Indices 時間足: 全
FREE

序章
Deriv AlgoTraders EA (ボット) は、一貫した利益を上げながら取引資本を維持することを目標に、長年の経験を持つ熟練した市場の専門家によって設計および開発されました。 これは、実世界またはシミュレートされた市場から派生した幅広い資産を提供する証券会社である Deriv Limited が提供する MT5 プラットフォームで動作します。 このタイプの市場の利点のいくつかは、年中無休で利用できることと、経済ニュースや活動からの影響が限られていることです。
将来のユーザーのための詳細
Deriv AlgoTraders EA (ボット) は、BOOM & CRASH 1000/500/300 合成インデックスのみで取引します。
一度に取引できるインデックスは 1 つだけで、一度に最大 2 つの取引 (売買) が可能です。
EA は、配置した TF に関係なく、1 M のタイムフレームで取引されます。
ドローダウンを制限するための回復のためのインテリジェントなヘッジ戦略を使用して、安全なゾーンでスパイクを辛抱強くキャッチしようとします。
調整不可能な

「NagaRecoil」EA:長期にわたり成果を積み重ねるための高耐久・高回復力トレードソリューション 待望のEA「NagaRecoil」がついにリリースされました!このEAは、RSIとRFTLの二つの高性能インジケーターを活用し、市場のトレンド変動を巧みに捉え、最適なエントリーポイントを見定めます。RSIが市場の過熱状態を敏感に感知し、RFTLが価格の将来的な動きを予測。この組み合わせにより、買い時と売り時のシグナルを提供します。 さらに、「NagaRecoil」はその名の通り、蛇のようにしなやかで粘り強いトレードを展開。市場の動きに合わせて柔軟に対応します。自動的な利食い・損切り設定に加え、高度なトレーリングストップ機能が搭載されています。 このEAは、シンプルで直感的な操作性を実現しつつ、初心者から上級者まで全てのトレーダーに適した設計となっています。自由度の高いパラメータ設定により、様々な市場環境や個々のトレーディングスタイルに柔軟に対応。また、ATP対応で使いやすさとテストのしやすさを兼ね備えています。
FREE

If you like this free tool, check out my EA which is currently on a Launch Sale for only $39 ! https://www.mql5.com/zh/market/product/159132?source=Site Summary: Tick Delta Flow is a professional order flow analysis tool designed for Scalpers and Day Traders . Unlike standard volume indicators, it decomposes every price tick to reveal the actual aggressive buying and selling pressure (Delta) inside each candlestick. It provides a real-time "X-Ray" view of the market microstructure. Key Features:
FREE

This indicator was developed to support multiple timeframe analysis. In the indicator settings, the user can set the color, width, and style of the horizontal lines for each timeframe. This way, when the horizontal lines are inserted into the chart, they will be plotted with the timeframe settings.
MTF Lines also allows visibility control of another objets like rectangles, trend lines and texts.
This is a product developed by Renato Fiche Junior and available to all MetaTrader 4 and 5 users!
FREE

This auxiliary indicator displays time left before closing on the current timeframe with continuous update . It also shows the last trade price and variation from a previous day close in percentage and points. This indicator is pretty handy for daytraders and scalpers who want to precisely monitor closing and opening of candles.
Indicator parameters Show in shifted end - Default: False. Display time and values on screen. If True, Displays only time to close aside last candle. Distance from the
FREE

エントリー、テイクプロフィット、ストップロスのレベルをチャートに簡単に描画し、トレードシグナルを分析・追跡できます。 主な機能 エントリー、TP1、TP2、TP3、SL の値を簡単に入力 シグナルの発生時刻を示す垂直線(オプション) 各ラインのラベルや色を自由にカスタマイズ可能 シグナルの精度やリスクリワード比を視覚的に確認 すべての銘柄・時間足に対応 再描画なし、遅延なし、常に安定した表示 使用例 Telegram、WhatsApp などのチャンネルからのシグナルを可視化 過去のシグナルを分析し、市場の反応を学ぶ クライアントやコミュニティに対し、分かりやすいシグナル構成を提示 手動または自動戦略と組み合わせて使用 キーワード シグナル, ライン描画, エントリー, テイクプロフィット, ストップロス, 外国為替, テレグラム, ビジュアルシグナル, マニュアルトレード, シグナル分析, TP, SL, チャート, レベル, 評価, 教育, インジケーター, ツール
FREE

Introduction The Parabolic SAR (Stop and Reverse) indicator is a technical analysis tool designed to identify potential trend reversals and provide trailing stop-loss levels. This enhanced version of the standard Parabolic SAR for MetaTrader 5 offers improved visual clarity, customizable alerts, and an optional trend confirmation filter to assist traders in their analysis. Features Enhanced Visualization: Displays Parabolic SAR dots in two distinct colors (Lime for uptrends, Red for downtrends)
FREE

Overview
Support & Resistance (MTF) is a MetaTrader 5 indicator that automatically identifies swing highs (resistance) and swing lows (support) across up to three timeframes. It merges nearby levels to reduce clutter, adapts zone width to market volatility using ATR, and offers optional alerts when price breaks or retests those levels. Features Multi-timeframe pivot detection
Identify pivots on the current chart plus two higher timeframes using a configurable pivot length. Merge-distance grou
FREE

Extremum Scalper is a fully automated Expert Advisor, that uses a dynamic MM, probabilistic analysis and also strategy of breakout/rebound from the levels of daily and local extremes, and the candlestick Highs. The price Highs and the tick volume serve as the analyzed parameters. Works in different markets with all trade execution modes. Does not use martingale or hidden methods of increasing the position volume. The EA has 9 different extremum calculation algorithms. Uses a drawdown protection,
FREE

The Ultimate Dashboard New Year Sale - save $20 (normal price $79) Indicators are useful for traders, but when you put them into a dashboard that can scan 28 symbols at once they become even better, and when you can also combine different indicators and timeframes to give you synchronized alerts, then they become awesome. This easy to use dashboard provides you with 32 leading indicators, use them individually or together, to create powerful combination alerts. So when you want to know that RS

EA_XAU_PreLondon_MicroRange_FINAL
XAUUSD – ロンドン市場開始前のマイクロレンジレベル取引 EA
概要
EA_XAU_PreLondon_MicroRange_FINAL は、ロンドン市場開始前に狭いマイクロレンジを形成する XAUUSD 用の時間枠ベースのエキスパートアドバイザーであり、明確に定義された価格レベルを突破した場合にのみ取引を行います。
この EA は、高い取引頻度ではなく、明確な市場構造、制御された執行、一貫したリスク管理に重点を置いています。
取引ロジック(概念)
時間枠(ロンドン前)
この EA は、07:00~08:00(サーバー時間 UTC+1)の固定時間枠で動作します。
マイクロレンジの形成
時間枠の最初の N 分間に、狭い取引レンジ(高値/安値)が形成されます。
小さすぎる、または大きすぎるレンジは除外されます。
レベルベースのブレイクアウト
このレンジレベルが破られた後にのみ、取引が開始されます。
追加のブレイクアウトバッファ付き
オプションで、レンジ外のローソク足終値の場合のみ(フェイクアウトフィ
FREE

Supply and Demand indicator does not repaint as it counts the number of tests/retests occurred in the past x number of times. As a trader you need a path to be able to place your buy and sell trades such as: Supply and Demand, Falling & raising channels . Experienced trades will draw the key levels and channels around the timeframes. But, they will not be able to draw them on the small time frames as the price changes too frequent. This indicator is based on Shved supply and demand indicator, b
FREE

Bring the popular "Crosshair with Magnet Mode" functionality from modern charting platforms directly to your MetaTrader 5 terminal. Crosshair for MT5 is a precision utility tool designed for traders who demand accuracy. Unlike the standard MT5 crosshair, this smart tool automatically detects Open, High, Low, and Close prices on your candles. When your mouse hovers near a candle, the crosshair "snaps" to the nearest wick or body price, ensuring you are looking at the exact price level every tim
FREE

This is an indicator of trading sessions that can display all levels (Open-High-Low-Close) for four sessions . The indicator can also predict session levels. Sessions can be drawn with lines or rectangles (empty or filled), lines can be extended to the next session. You can easily hide/show each session by pressing hotkeys (by default '1', '2', '3', '4') You can see ASR (Average Session Range) lines (default hotkey 'A'). This is similar to the ADR calculation, only it is calculated based on t
Quant Levels Indicator is a premium component of the Quantitative Trading Analysis Toolkit , designed to transform subjective trading into data-driven decision making. This advanced tool provides institutional-grade support and resistance analysis directly on your MT5 charts. " Please support our work by leaving a review ". As a thank-you gift , we’ll share a special template that helps you display signal trade history directly on your chart. Free indicator to visualize any MT5/MT4 signals i
FREE

ScriptBot é um robô multi estratégia desenvolvido para ser prático e robusto, com o ScriptBot você é capaz de criar diferentes estratégias próprias, instale até 51 indicadores do seu gosto e monte o seu próprio gatilho utilizando uma expressões lógica simples.
WARN: Este Expert esta desatualizado , um novo ScriptBot esta sendo reescrito do zero. Abaixo contaremos um pouco sobre a estrutura: Indicadores: ScriptBot não possui indicadores na sua codificação, isso significa que você tem total co
FREE

Adaptive Moving Average (AMA) is a trend indicator using moving average and market noise filter. Indicator feature are blue and red points, showing the power of trend. Recommendations for trading: Auxiliary Indicator Detecting trend Detecting power of trend Detecting potential reversal points Main indicator Shows entry points for swing trading Serves as dynamic support and resistance Recommendations for use: Any instrument Any timeframe Input parameters: Period - AMA period Fast Period - fast MA
FREE

Free Session High Low Indicator for MetaTrader 5.
This indicator displays the High and Low levels
of a selected trading session.
Features:
Calculates session High and Low levels
Uses closed candles only (non-repainting)
Clean and simple visual display
Suitable for manual trading
Free version limitations:
- Single session
- No alerts
- No breakout logic
This free indicator is provided for educational purposes.
If you need:
Alerts
Multiple sessions
Breakout strategy
Expert Adv
FREE

Enhance your price action strategy: inside bar breakouts at your fingertips
This indicator detects inside bars of several ranges, making it very easy for price action traders to spot and act on inside bar breakouts. [ Installation Guide | Update Guide | Troubleshooting | FAQ | All Products ] Easy to use and understand Customizable color selections The indicator implements visual/mail/push/sound alerts The indicator does not repaint or backpaint An inside bar is a bar or series of bars which is/a
FREE

Aureus Prime Signal – Professional Gold Trend Hunter Unlock the core algorithm of the "Aureus Prime" ecosystem for manual trading. Precision, Logic, and Style combined. Aureus Prime Signal is not just another arrow indicator. It is the exact entry engine used in our flagship Expert Advisor (Aureus Prime X), now decoupled and optimized for discretionary traders who demand control over their execution. Optimized for XAUUSD (Gold) M15 This system is strictly tuned for Gold volatility . The defa
FREE
A simple indicator for calculating risk and automatically calculating the take profit line. In the settings, you enter the desired risk to profit ratio, the indicator will automatically calculate the volume for entry and show where to set the take-profit line to maintain the proportion. The risk is calculated based on your balance data. The information panel can be moved around the screen. The stop-loss line can also be moved, this will recalculate the entry volume and the take-profit position.
FREE

Position Size Tool – Smart Risk Management & Trade Execution Panel The Position Size Tool is a powerful and intuitive MT5 panel that simplifies your trading by combining position sizing , risk calculation , risk/reward visualization , and order placement —all in one place. ️ Clean & Functional Interface The tool features a compact, real-time panel with the following: Balance & Equity display Live Price tracking Customizable Risk % input Auto-calculated Lot Size based on SL and Risk Input for S
FREE

Advanced SatoshiMind AI Bitcoin Robot MT5 - JUST PLUG & PLAY ON BTCUSD CHART in M5 time- For Back test Use 1 Mint OHLC Mode Upgraded with Best AI & Neural Network Features for Higher Accuracy in BTCUSD Trading- MUST BUY THIS PROFITABLE AI ROBOT!! - Upgraded version Date 22Dec 2025 Introducing Advanced SatoshiMind AI Bitcoin Robot MT5 — a next-generation Expert Advisor built to trade Bitcoin/BTCUSD with intelligent precision, using a unique blend of technical mastery and AI-driven decision-maki

SmartTradeコントロールパネル — アルゴリズム取引のコントロールセンター SmartTradeコントロールパネルは、あらゆる取引においてコントロール、柔軟性、効率性を重視する方のために開発された多機能トレーディングパネルです。視覚的な利便性と強力な注文追跡ロジックを組み合わせ、日常的な取引を制御されたプロセスへと導きます。
以下のことが可能になります。
スキャルピングからグリッドトレードまで、あらゆる取引アイデアを実行可能
エントリー/エグジットロジックに合わせて注文追跡をカスタマイズ
リスク、利益、スプレッド、統計をリアルタイムで管理
コードを書かずに高度なアルゴリズム(マーチンゲール、損益分岐点、タイマー)を使用可能
主な機能: 注文追跡機能付き注文の発注
自動制御による成行注文と指値注文(売買指値)の即時発注
時間取引 タイマーによる市場参入スケジュール設定 — ニュースやボラティリティの高いセッションに最適
損益分岐点システム 注文(またはグリッド全体)が指定水準に達すると、自動的に損益分岐点へ移行
制御機能付きマーチンゲール 乗数とグリッドステ
FREE

Edgezone Strategy Monitor The Edgezone Strategy Monitor is a professional analysis and monitoring tool for MetaTrader 5, designed for the objective evaluation of trading strategies (Expert Advisors, manual strategies, and portfolio setups) based on real account history. The tool is used exclusively for analysis and visualization of trading performance. It makes no trading decisions and does not execute any trades . Main Features Monitoring of up to 30 strategies via Magic Numbers Flexible time r
FREE
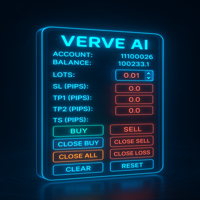
FXTrade Panel – 賢く高速な MT5 トレードマネージャー
FXTrade Panel は、ワンクリックでの注文実行と管理機能を備え、取引効率を大幅に向上させる MetaTrader 5 向けの高機能かつ使いやすいトレーディングツールです。
主な機能: • アカウント概要:口座番号、レバレッジ、残高、現在のスプレッドを表示。 • ロットサイズ制御:直感的な+/−ボタンでロットサイズを調整可能。 • リスク管理:ピップス単位で Stop Loss(SL)、Take Profit(TP1、TP2)、トレーリングストップ(TS)を設定。 • ワンクリックトレード:BUY/SELL注文を即時実行。
ポジション管理: • Close Buy — アクティブな全買いポジションをクローズ。 • Close Sell — アクティブな全売りポジションをクローズ。 • Close All — 全てのポジションを決済。 • Close Profit — 利益のあるポジションのみクローズ。 • Close Loss — 損失のあるポジションのみクローズ。
FREE

Money Mind BTC — BTCUSD H1(v13.00) グローバルリスク管理と適応型動作を備えた自動売買システム Money Mind BTC 13.00 は、BTCUSD 取引のために設計されたエキスパートアドバイザーです。完全なリスクコントロールと自動適応ロジックを備え、安定した動作、柔軟な設定、そして市場状況に応じて動作を調整するグローバル管理構造を兼ね備えています。 主な特徴 シンボル:BTCUSD 推奨タイムフレーム:H1 感度調整可能な内部フィルター 適応距離による段階的エントリー 取引方向の設定(買いのみ、売りのみ、または両方) 固定・算術・幾何ロットモード 残高割合によるグローバルテイクプロフィットおよびストップロス 口座残高の増加に応じた自動ロットスケーリング 最大ポジション数の制限 新規ポジション前の内部リスク検証 バージョン 13.00 の新機能 新しいエントリー感度構造(レベル 1〜5) 市場状況に応じた動的なポジション間距離 システム応答を調整する新パラメータ EscalaVelocidad 資金と証拠金の検証を改善 最適化のためのマルチオブジェ

LandBreaker is a meticulously engineered Expert Advisor (EA) designed for the EURUSD H1 chart, focusing on consistent performance and robust risk management . It has undergone extensive testing over a 15+ year period , from 2008 to 2024, based on a specific initial deposit. Out of 1,199 trades executed during this testing period, LandBreaker achieved a high success rate of 99.83% . The performance indicates a 99.79% success rate for short positions and a 100% success rate for long positions. Th
FREE

Recommended EA Settings for Bitcoin Honey Badger For BTCUSD (Main Strategy):
Symbol: BTCUSD Recommended brokers: Deriv and XM or a broker with ECN/RAW/LOW spread type (check the article) Timeframe: H1 (recommended) Lot Size: 0.10 (adjust based on account size) Risk Percent: 1.0% ATR Multiplier: 2.0 Max Positions: 4 Pyramid Distance: 0.5 Installation Steps:
Download and install MetaTrader 5 Open a BTCUSD M15 chart Drag the Honey Badger EA onto the chart Enable AutoTrading in MT5 Set lot size
This EA has no stop loss. All risks are at your discretion.
CHIQUITA MT5 EA is a fully automatic Expert Advisor for Scalping Trading on XAUUSD timeframe M1. The basic strategy starts with Market order in Trend Following, so this EA Follow the Trend . M1 Trend…. very very fast. MT4 version Recommendations The Expert is programmed to work on XAUUSD M1, but you can use all others timeframes with the appropriate settings. An ECN broker is always recommended A low latency VPS is alwa
FREE

The "YK-LOT-SIZE" is a custom indicator for MetaTrader 5 (MT5) that displays the total lot sizes and profits for both buy and sell positions on the current chart. Key features of the indicator: It calculates the total lot sizes for all open buy and sell positions of the current symbol. It calculates the total profits (including commissions and swaps) for all open buy and sell positions. The indicator displays the information on the chart using two lines of text: "BUY Lots: [total buy lots] | BUY
FREE

Opening Range Indicator
Idea Toby Crabel introduced this way of trading in the ealy ninties in his book "Day Trading with Short Term Price Patterns and Opening Range Breakout". In simple terms this means to trade the brekouts from the limits of the first trading hour with the stop loss at the opposite side. I.e. if the first hourly candle meausres 40 points (Crabel calls this the "stretch") you set the stop loss at breakout level minus 40 points and the take profit at the breakout level plus 4
FREE

News Radar Pro transforms MT5’s built-in economic calendar into a live, on-chart trading tool. View upcoming macroeconomic events directly on your chart with impact-based filtering, countdown timers, and intelligent alerts, all in your chosen timezone. No external websites, APIs, or data feeds required. How It Works Economic Calendar Integration
Access MT5’s global economic events database directly on your chart. Event Filtering
Filter economic events by impact level (High, Medium, Low) and cu
FREE
The Ultimate Signal Builder Basic combines the features of other 3 expert advisors, providing all their trading signals in one single place: 1. the Price Action Builder Basic ; 2. the Bollinger Bands Builder Basic ; 3. the Chart Patterns Builder Basic .
The Ultimate Signal Builder Basic expert advisor shares the same characteristics as the 3 underlying experts: usage of stop loss orders, maximum 1 managed open trade, automatic trade closure and configurable validation mechanism. While being ess
FREE

General Description Volatility Breakout Master is an Expert Advisor designed to capture market volatility through a “breakout + reversal” strategy.
The system detects when the price breaks the high or low of the last X candles within a configurable time window, enters in the breakout direction, and—if the market reverses—opens a new position in the opposite direction following a dynamic model.
Once a cycle is completed (when one direction prevails), all trades are closed, and the system automat
FREE

オープニングレンジEAは 、よく知られた市場原理に基づいて構築されています。指数は市場が開いた直後に強いモメンタムを示すことが多く、その最初の動きがセッションの残りの流れを決定づける可能性があります。このEAは、オープニングレンジを特定し、ブレイクアウト注文を自動的に出すことで、そのモメンタムを捉えます。その後、セッションが終了するまで取引を管理し、その日の方向性の動きから利益を得ることを目指します。 この製品は完全に無料です。初期設定ファイルは コメント欄から入手できます 。 戦略をさらに拡張またはカスタマイズしたい場合は、有料製品のいずれかを購入していれば、DM 経由でソース コードをリクエストできます。 他のEAもぜひご覧ください 取引仕様
対応機器 :US30、USTEC、DE40に最適。EA 設定: デフォルト設定はUS30とUSTECに最適化されています。VPS : 中断のないパフォーマンスのために推奨 主な特徴 カスタム時間ウィンドウ: 希望する開始時間と終了時間を選択して、開始範囲を定義します。 自動ブレイクアウト注文: EA は定義された範囲の上下に保留
FREE

MT4版 | FAQ Owl Smart Levels Indicator は、 Bill Williams の高度なフラクタル、市場の正しい波構造を構築する Valable ZigZag、エントリの正確なレベルをマークする Fibonacci レベルなどの一般的な市場分析ツールを含む 1 つのインジケーター内の完全な取引システムです。 利益を得るために市場と場所に。 戦略の詳細な説明 インジケータを操作するための指示 顧問-取引助手 プライベートユーザーチャット ->購入後に私に書いて、私はプライベートチャットにあなたを追加し、あなたはそこにすべてのボーナスをダウンロードすることができます 力はシンプルさにあります!
Owl Smart Levels 取引システムは非常に使いやすいので、専門家にも、市場を勉強し始めて自分で取引戦略を選択し始めたばかりの人にも適しています。 戦略と指標に秘密の数式や計算方法が隠されているわけではなく、すべての戦略指標は公開されています。 Owl Smart Levels を使用すると、取引を開始するためのシグナルをすばやく確認し、注文を出すための

Are you tired of drawing trendlines every time you're analyzing charts? Or perhaps you would like more consistency in your technical analysis. Then this is for you. This indicator will draw trend lines automatically when dropped on a chart. How it works Works similar to standard deviation channel found on mt4 and mt5. It has 2 parameters: 1. Starting Bar 2. Number of bars for calculation The starting bar is the bar which drawing of the trend lines will begin, while the number of bars for c
FREE

Smart Money Concepts Indicator - Professional ICT/SMC Trading System Transform Your Trading with Institutional-Grade Smart Money Analysis Unlock the power of Smart Money Concepts (SMC) and Inner Circle Trader (ICT) methodologies with this advanced indicator that identifies high-probability entry zones and intelligently sets Take Profit targets at the next Point of Interest (POI). Stop guessing where to exit your trades - let institutional logic guide you to the next Order Block or key market
FREE
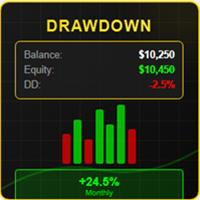
# DRAWDOWN INDICATOR V4.0 - The Essential Tool to Master Your Trading
## Transform Your Trading with a Complete Real-Time Performance Overview
In the demanding world of Forex and CFD trading, **knowing your real-time performance** isn't a luxury—it's an **absolute necessity**. The **Drawdown Indicator V4.0** is much more than a simple indicator: it's your **professional dashboard** that gives you a clear, precise, and instant view of your trading account status.
---
## Why This Indicator

MetaTrader5の任意の取引シンボルのすべてのパラメーターの自動最適化のエキスパート。 設定なしでEAを取引! ダニ ハムスター -これは 、アドバイザーを設定したくない初心者やユーザー向けの自動取引エキスパートです! このトレーディングアドバイザーのトレーディング戦略は 7年間テストされています。 初心者のために特別に設計された自動売買エキスパートで、これまで以上に取引を簡単に。 アドバイザーを設定する煩わしさに別れを告げ、ストレスのない取引を実現しましょう。 今すぐ始めて、取引成功への第一歩を踏み出しましょう。 MT4のバージョン
完全な説明 +DEMO +PDF 購入する方法
インストールする方法
ログファイルの取得方法 テストと最適化の方法 Expforex のすべての製品 使い方?
ダウンロード; チャートにインストールします。 アドバイザーは自動的に取引します。 レビューを残します。 エキスパートを設定するにはどうすればよいですか?
何もカスタマイズする必要はありません!私たちはあなたのためにすべてをセットアップします! 1設定パラメ

About CrashBoom Stones is an expert advisor utility that gives you a signal to catch CrashBoom drops or spikes. It shows you a Red Sell arrow on Crash to sell, and a blue arrow on Boom to buy. It also gives you an alert when an arrow is shown. Note:
The utility does not show signals for the historical data in live mode, use the strategy tester to test this utility. The arrows shown are independent to the trends pane. The trends pane is more accurate when H1 and M30 agree.
Recommendations
W
FREE

The MT5 Forex Advisor called Black Gold EA is an advanced solution for automated trading on the XAUUSD (Gold to US Dollar) currency pair.
The full list is available for your convenience at https://www.mql5.com/ru/users/pants-dmi/seller
The advantages of the Black Gold EA M5 include 24/7 trading without emotional factors, quick decision-making, and the ability to backtest. However, like any trading robot, it does not guarantee profit and requires careful configuration and monitoring to achieve

Aurus Gold is a program capable of automatically analyzing and trading the Forex market without human intervention. This innovative tool helps you make decisions about buying or selling currency pairs.
The full list is available for your convenience at https://www.mql5.com/ru/users/pants-dmi/seller
Aurus Gold's primary goal is to maximize profits and minimize risks for investors. It operates 24/7, based on preset parameters and trading rules.
The main benefits of using a forex robot include:

Daily session open lines shows the traders three important trading session opens. By default it is set up to show you: Zero GMT Open Line London Open Session Line New York Open Session Line The default times are set according to GMT+2 and as such you are able to change and customise according to your specific time zone. The Indicator is usefull specially for the trader who trades the London and NewYork sessions.
FREE
自動化された高度な取引システム。 EA は、古典的な確率的インジケーターのシグナルで取引します。ポジションを決済するには、インテリジェントなトレーリング システムと保留中の注文を使用した平均化を使用します。 利点: 完全自動取引システム ロボット操作用のカスタマイズ可能な発振器信号 入力変数を直感的に簡単に設定 あらゆる種類の商品とあらゆる時間枠に適しています 組み込みの調整可能なトレーリング システム ノート!インジケータ ラインは EA に表示されません Problem solving -> HERE / MT4 version -> HERE ストラテジー: ストキャスティクス インジケーターを使用すると、次のことを判断できます: 買われ過ぎと売られ過ぎの値を使用して、過度に低いまたは高い価格レベルと価格反転の可能性 ストキャスティクス オシレーターは、0 から 100 までのスケールの 2 つの線で構成されます。一番上の線より上にあるものは買われ過ぎ、一番下の線より下にあるものは売られ過ぎです。 推奨値: 保守的な作業の場合は 80/20、積極的な作業の場合は 70/

FourAverageは、トレンド検出の新しい単語です。 情報技術の発展と多数の参加者に伴い、金融市場は時代遅れの指標による分析にあまり適していなくなっています。 移動平均や確率などの従来のテクニカル分析ツールは、純粋な形でトレンドの方向やその反転を決定することはできません。 1つの指標は、14年の歴史に基づいて、そのパラメータを変更することなく、将来の価格の正しい方向を示すことができますか? 同時に、横向きの市場の動きで妥当性を失うことはありませんか? 答え:はい、それはできます。 私たちのチームは、変化する市場の状況に適応するためのかなり強力で効果的なメカニズムを持つ指標を開発しました。 2025年には、主要なトレンド指標"Four平均"は開発の新しい段階に入っています。 現代の暗号通貨と株式市場は、この指標のために作成されたようです。 独自の平滑化式を使用すると、通貨ペアまたは他の楽器の任意の機能のための指標を調整(パターンを識別)することができます。 さて、利益を上げるためには、1つの指標で十分であり、これはほんの始まりに過ぎません。 他のツールと組み合わせて、または信号フィル

indikator Visual Panel Strengt MultiTimeframe : English Description Visual Panel Strength MultiTimeframe is a real-time trend strength indicator panel that displays the buy/sell pressure across multiple selected timeframes—such as M1, M3, and M5. The indicator utilizes ATR-based volatility analysis and a smoothed trend algorithm to calculate trend signals. Visually presented as a horizontal bar chart at the corner of your main chart, this tool helps traders instantly identify the prevailing

Stochastic Gold Scalper — 正確なスキャルピングのための自動アドバイザー Stochastic Gold Scalperは、MetaTrader 5プラットフォーム向けのプロフェッショナルな自動アドバイザーで、ローソク足パターンの分析とStochasticオシレーターを用いた信号のフィルタリングを組み合わせています。このアプローチにより、最も正確なエントリーポイントを特定し、リスクを最小限に抑え、誤信号を回避することができます。このアドバイザーは、M5のような短いタイムフレームでの取引に最適で、金、通貨ペア、インデックスなどのさまざまな取引ツールで使用できます。 主な利点 ローソク足分析とStochasticフィルターの組み合わせ
アドバイザーは、Bullish Engulfing、Bearish Engulfing、Hammer、Dojiなどの主要なローソク足パターンを識別します。すべての信号は、Stochasticオシレーターを通じて追加検証され、誤ったエントリーを排除し、高品質な取引に集中することができます。 柔軟なリスク管理
ユーザーは、固定取引量と

毎日利益を引き出そう! 基本コンセプト
Gold Deposit Accelerator は、$1(100ポイント)の値動きを正確に捉えるために設計された超高精度スキャルピングEAです。
もしチャンスを逃しても、価格が同じレベルに戻るのを待ちます。
完全にテクニカル分析に基づいており、ニュースやファンダメンタルズには依存しません。 テクニカル分析だけで $1 の動きを十分に捉えることができます。このEAは人間よりも速く、より正確に実行します。 なぜ今?
2024〜2025年、XAUUSDのボラティリティは過去最高水準に達しました。
このEAはその環境に最適化され、外科的な精度とスピードで市場のインパルスに対応します。 パフォーマンス
2年間のバックテスト:安定した成長と制御されたドローダウン。
現在ライブシグナル稼働中: リンク
1日に多数のポジションを開き、すぐに決済を目指します。
毎日利益を引き出すことが可能です。 ユニークな特徴
これはクラシックなEAではありません — 資本加速システムです。
カスタマイズ可能なグリッド戦略:
— 固定ロット、または
— マーチ
MetaTraderマーケットが取引戦略とテクニカル指標を販売するための最適な場所である理由をご存じですか?宣伝もソフトウェア保護も必要なく、支払いのトラブルもないことです。これらはすべて、MetaTraderマーケットで提供されます。
取引の機会を逃しています。
- 無料取引アプリ
- 8千を超えるシグナルをコピー
- 金融ニュースで金融マーケットを探索
新規登録
ログイン