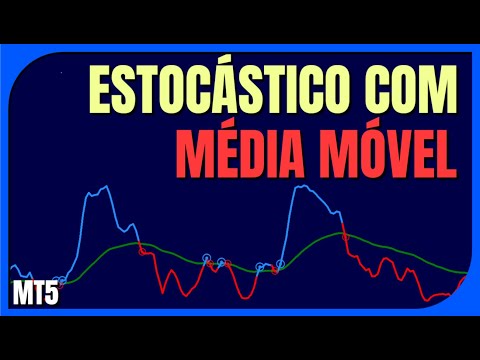
LT Stochastic with Moving Average
- インディケータ
- バージョン: 1.0

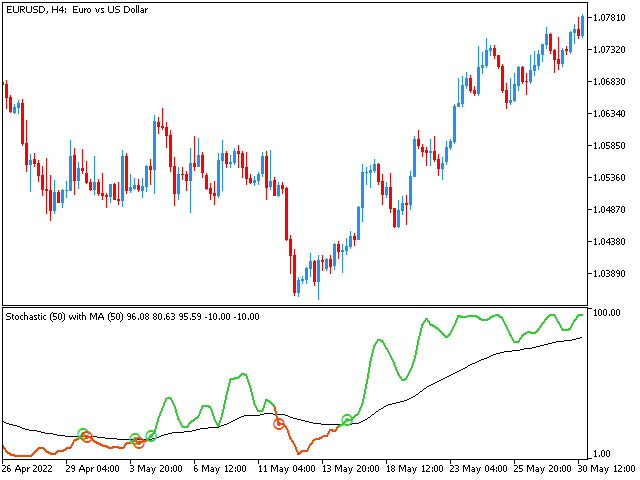
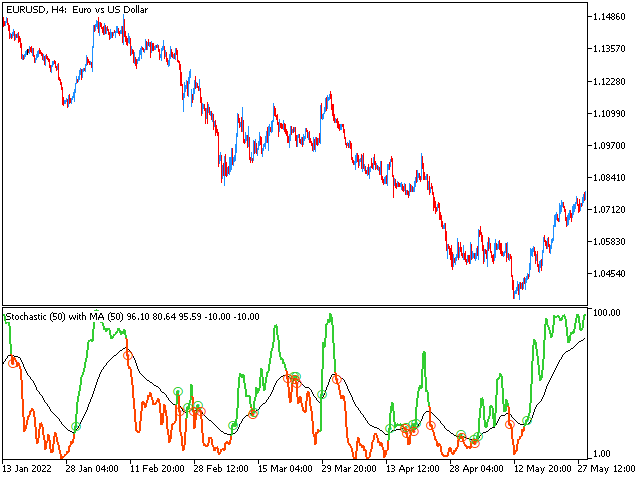
Using the Stochastic Oscillator with a Moving Average is a simple but very efficient strategy to predict a trend reversal or continuation.
The indicator automatically merges both indicators into one. It also gives you visual and sound alerts.
It is ready to be used with our programmable EA, Sandbox, which you can find below:
Our programmable EA: https://www.mql5.com/en/market/product/76714
Enjoy the indicator!
This is a free indicator, but it took hours to develop. If you want to pay me a coffee, I appreciate a lot <3
PayPal, Skrill, Neteller: litoraltrading@gmail.com


USEFULL HELPER THANS