BlueDigitsFx Open Trades MT5
- インディケータ
- バージョン: 1.11
- アップデート済み: 29 12月 2025

無料のBlueDigitsFxツール + エコシステムアクセス
この無料ツールは、BlueDigitsFxトレーディングインフラエコシステムの一部です。
BlueDigitsFxボットを通じて、アップデート、ワークリソース、製品リリース情報、および公式エコシステムへのアクセスを取得できます。
BlueDigitsFx Open Trades MT5 — アクティブなトレード管理のためのリアルタイムPipsモニター
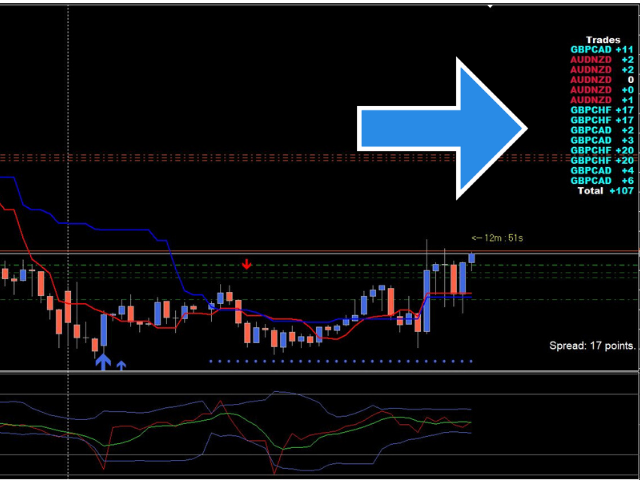
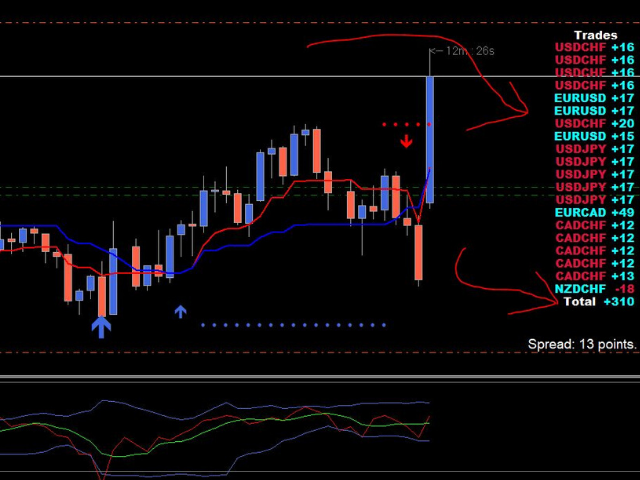
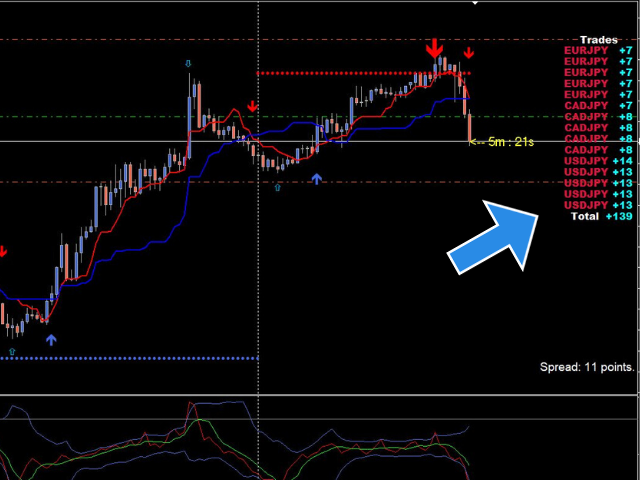
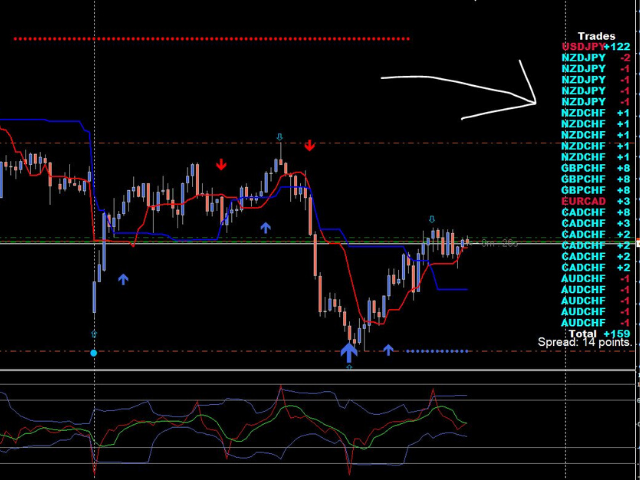
BlueDigitsFx Open Tradesは、すべての未決済ポジションの合計損益(Pips)をリアルタイムでチャート上に表示する無料のMT5ユーティリティです。
見やすいカラー表示により、複数の通貨ペアやポジションにおける利益・損失状況を素早く把握できます。
複数のウィンドウを切り替えることなく、ポジション状況をより明確に確認し、取引セッションを効率的に管理したいトレーダー向けに設計されています。
未決済ポジション全体のパフォーマンスをチャート上に常時表示することで、MetaTraderのターミナル画面を頻繁に開かなくても素早い判断が可能になります。
主な機能
- リアルタイムPips表示 — 未決済ポジションの合計Pipsをチャート上で確認できます。
- カラーコードによる取引概要 — 利益・損失状況を瞬時に把握できます。
- 複数ポジション監視 — 複数のポジションを同時に管理する際に便利です。
- シンプルなチャートユーティリティ — 視認性と使いやすさを重視した軽量設計です。
- MetaTrader 5ユーティリティ — 未決済ポジションの状況をより分かりやすく表示するシンプルなツールです。
なぜトレーダーに利用されるのか
複数のポジションを保有している場合、MetaTrader標準画面だけでは全体の損益状況を素早く把握するのが難しいことがあります。
Open Tradesはアクティブな取引状況を視覚的に分かりやすく表示し、ライブ市場でのポジション管理をサポートします。
活用例
- スキャルピング — 短期取引中のポジション状況を素早く確認。
- デイトレード — ターミナル画面を頻繁に確認せずにポジションを監視。
- スイングトレード — 長期保有ポジションのパフォーマンスを追跡。
- 複数通貨ペア取引 — 複数の通貨ペアを管理する際の視認性向上。
使用方法
- BlueDigitsFx Open TradesをMT5チャートに追加します。
- 通常どおりポジションを保有します。
- チャート上のPips表示を利用して、未決済ポジション全体のパフォーマンスをリアルタイムで監視します。
推奨インフラ構成
Open Tradesは、より包括的な執行・ポジション管理環境を求めるトレーダー向けに、BlueDigitsFx Command Centerとの併用が特に効果的です。
BlueDigitsFx Command Centerは、注文執行、リスク計算、ブレークイーブン管理、トレーリングストップ制御、市場方向分析、モメンタム分析、通貨強弱分析などに重点を置いています。
BlueDigitsFx Command Center MT5:近日公開予定...
BlueDigitsFxインフラエコシステムの一部
Open Tradesは、実用的なツール、ワークフローユーティリティ、ダッシュボード、市場構造システム、および本格的なMetaTraderユーザー向けの取引管理支援に重点を置くBlueDigitsFx MT4・MT5インフラエコシステムの一部です。


Obrigado por compartilhar