Divergence Force
- インディケータ
- バージョン: 1.1
- アップデート済み: 12 6月 2024

Divergence Force ダイバージェンスインジケーター 1.0
説明
Divergence Force は、資産の価格とMACD(移動平均収束拡散)との間のダイバージェンスを識別するために設計されたインジケーターです。このインジケーターは、価格とMACDの高値と安値に自動的にトレンドラインを描き、潜在的な取引機会を強調します。
主な機能
- ダイバージェンスの自動識別: インジケーターは、価格とMACDの間の強気と弱気のダイバージェンスを自動的に検出します。
- トレンドラインの追跡: 価格の連続する高値と安値に自動的にトレンドラインを描き、MACDの高値と安値と比較します。
- 買いと売りのシグナル: ダイバージェンスが識別されると、グラフに明確に買い("Buy")と売り("Sell")のシグナルを表示します。ダイバージェンスが検出されない場合は"Neutral"を表示します。
- 標準MACDパラメータ: 標準のMACDパラメータ(12, 26, 9)を使用して計算し、信頼性のある認知された結果を保証します。
- 異なるタイムフレームとの互換性: 1時間のタイムフレームで動作するよう最適化されていますが、ユーザーの好みに応じて他のタイムフレームにも適用できます。
使用方法
- インストール: インジケーターをMetaTrader 5プラットフォームの Indicators フォルダーに追加します。
- チャートへの適用: インジケーターを希望するチャートにロードします。インジケーターは自動的にトレンドラインを描き、ダイバージェンスを識別し始めます。
- シグナルの解釈:
- Buy: 強気のダイバージェンスが検出されると、インジケーターは"Buy"シグナルを表示します。
- Sell: 弱気のダイバージェンスが検出されると、インジケーターは"Sell"シグナルを表示します。
- Neutral: ダイバージェンスが検出されない場合、インジケーターは"Neutral"を表示します。
ビジュアル例
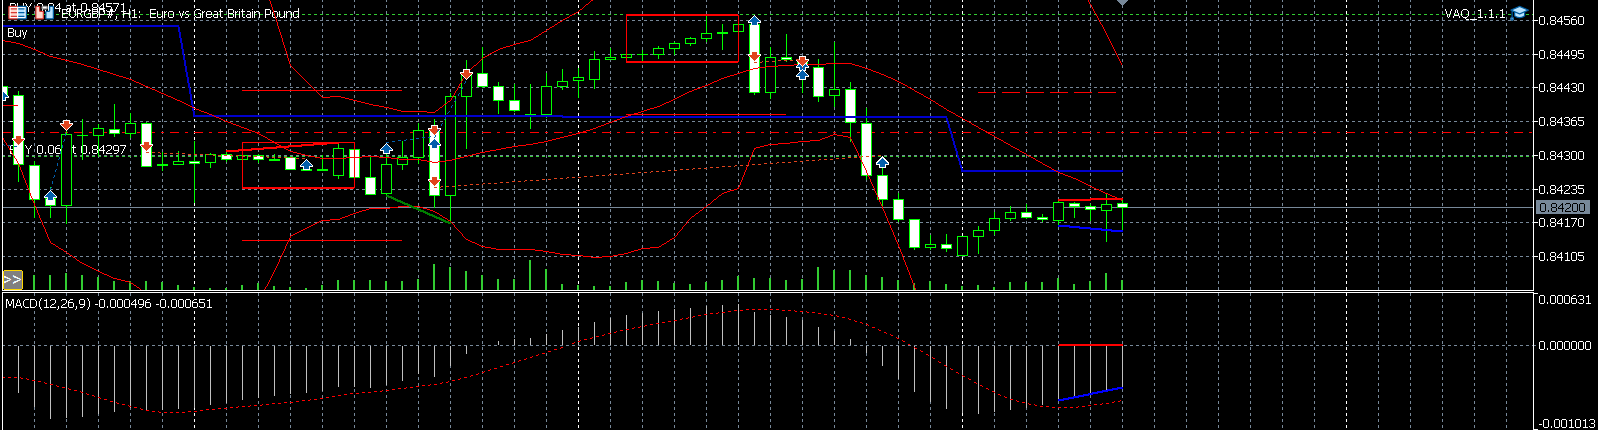
強気のダイバージェンス(Buy):
- 対応するMACDの安値が下がっている間に、2つの連続する価格の安値が上昇している場合。
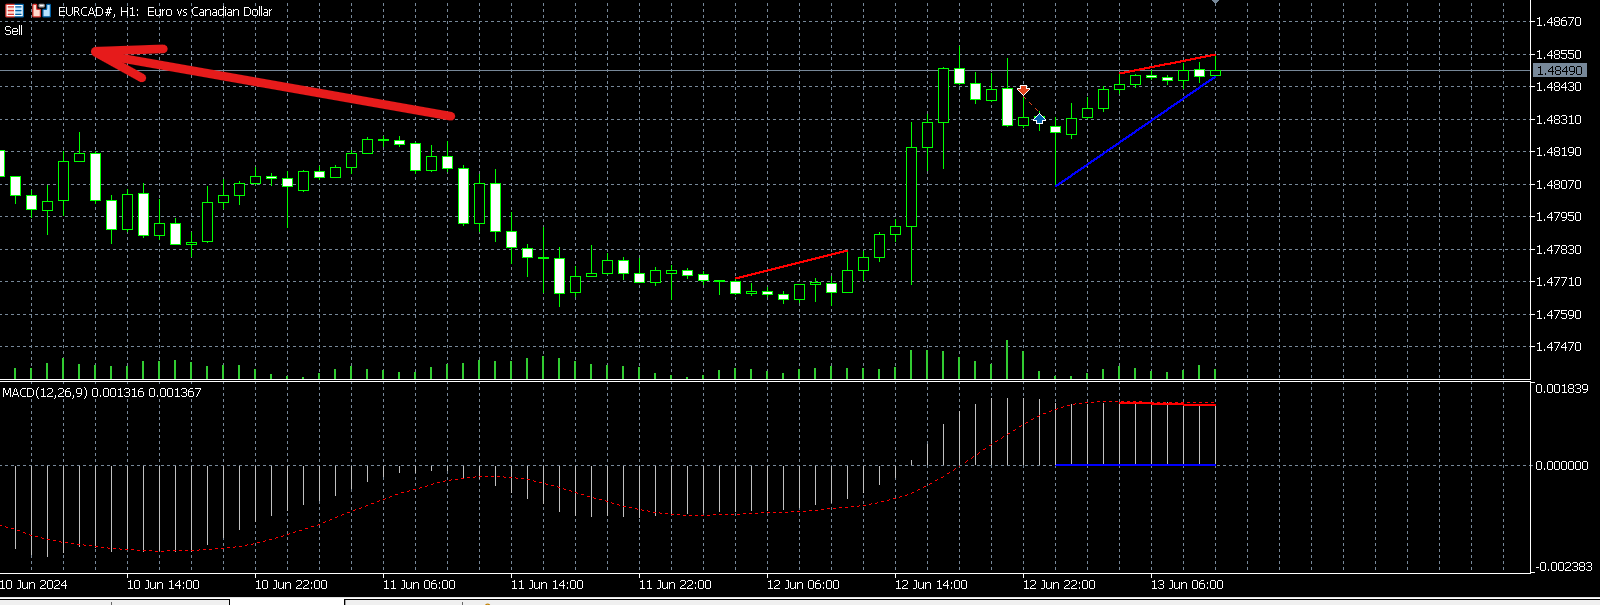
弱気のダイバージェンス(Sell):
- 対応するMACDの高値が上昇している間に、2つの連続する価格の高値が下がっている場合。
結論
Divergence Force は、取引戦略における追加の確認を得るために役立つインジケーターです。その使いやすさと高度な機能を備えたこのインジケーターは、取引戦略を改善し、運用効率を高めるのに役立ちます。
今日Divergence Forceをダウンロードして、取引を次のレベルに引き上げましょう!


satisfied customer