BE Line by MMD MT5
- インディケータ
- バージョン: 1.0
Break Even Line by MMD
The Break Even line is a useful indicator for people using strategies that allow simultaneous trades in both directions, such as the MMD methodology.
This indicator is useful when playing statistical models and averaging positions in accumulation and distribution zones.
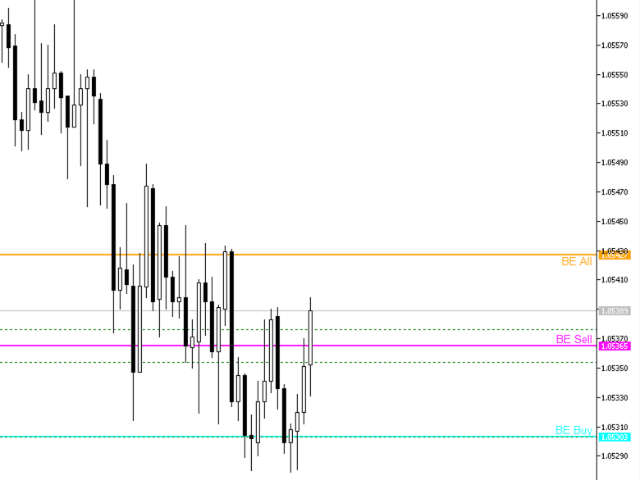
The indicator draws levels by summing positions in three groups: positions included in BUY, positions included in SELL and all positions included.
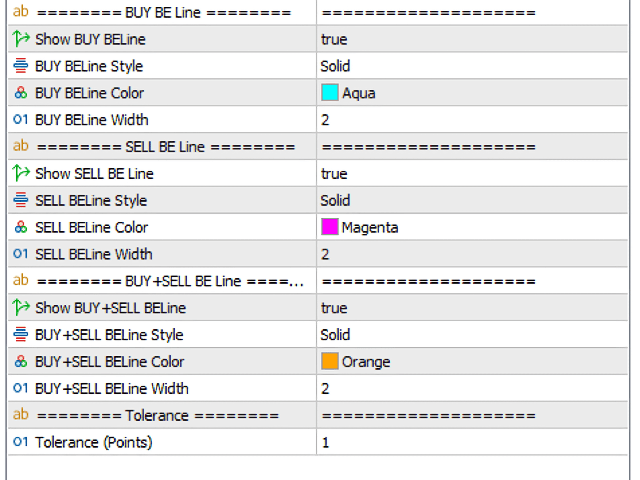
Functionality description:
Show BUY BELine - shows or hides the Break Even level for BUY positions
BUY BELine Style - defines the line style for the BE level, for the BUY position
BUY BELine Color - specifies the color of the line for the BE level, for the BUY position
Buy BELine Width - defines the thickness of the line for the BE level, for the BUY position
For the SELL item and for all items, the settings are the same.


This works well . Thank you .