
MetaTrader 5の継続的な先物取引

はじめに
トレーダーは、MetaTrader 5にて彼自身のチャートを作成できず、ブローカーのシンボルでのみ作成されます。トレーダーは、統合的な商品を必要とします - 継続的な先物取引問題は、ブローカーが取引を組み合わせることができ、特定のシンボルにて先物を組み合わせるか否かを決定する点です。
幸運にも、クローズの先物の履歴がターミナル上にて確認できます。履歴を用い、ターミナルの先物取引を組み合わせて下さい。
協定:
- この記事のすべてのデータや図、スクリーンショットは、Ukrainian Stockインデックス先物に基づいています。
- この記事に追加されているコードの部分は、色でマークされています。例:
//+------------------------------------------------------------------+
//|                                               This is an example |
//|                                               of the edited code |
//+------------------------------------------------------------------+
第一の問題: 日付の重複
日の近い先物は、日付の重複にてトレードされます。
つまり、その先物はトレードされ、一方、別の先物はクローズまで二ヶ月あります。

図1. 先物取引での日付の重複
その図は、2013.09.16は、UX-3.14先物取引の開始日ですが、UX-12.13先物はすでにオープンであることを示します。
第二の問題: 統合方法の選択
先物の統合において二つの方法があります:
- シンプルな追加 – 現在の商品の循環日が切れ、次の商品が別のバーにてオープンされるような時。シンプルな追加においては、チャートの価格は、履歴の値とマッチしますが、同時に統合された価格において価格のギャップが常に存在します。つまり、チャートは滑らかではありません。

図2. 統合シンプルな追加
- シフトによる追加: 現在の証券がクローズまで5-10日あり、次の証券バーで5-10のバーを取り替え始める。5-10バーインターバルは、移動期間と呼ばれます。シフトによる追加時、価格は異なった値を示します(現在の証券とは一致しません)。しかし、シンプルな追加メソッドと比較して、チャートはより滑らかです。

図3. 統合シフトによる追加
ターミナルでの設定
"Market watch"ウィンドウにて、先物が降順にて配置されます。

図4. マーケットウォッチ
インジケーターの記述
terminal_data_folder\MQL5\Indicators フォルダーにて標準のインジケーターが配置されます。Create Syntheticsフォルダーを MyIndicatorsに作成してください(\Indicatorsにてオープンします。)標準ライブラリの\Indicatorsフォルダーにてスペースを確保でき、MQL5 Storageインジケーターの同期を進めます。そのフォルダーのパスは最終的にこのようになります: terminal_data_folder\MQL5\Indicators\MyIndicators\Synthetics.
Syntheticsフォルダーでは、新しいファイルを作成します:

図5. インジケーターの新しいファイルの作成
新しいファイルの種類を設定してください - "Custom indicator":

図6. 新しいファイル種類 - "Custom indicator"
"Next(次へ)"を押し、"General properties of the custom indicato(カスタムインジケーターの一般的なプロパティ)"ウィンドウを開いてください。インジケーター名を入力し - "SYNT"、二つのオプションを追加してください。最初のオプション "Number of futures for splicing(統合における先物数)"は、接続される証券の数を決定します。注:その2という数字は、"Number of futures for splicing(統合における先物の数)の可能な最小の値です。. 二番目のオプション"Gluing type(結合方法)"は、標準のインジケーターにおける統合方法を決定します - "シンプルな追加":

図7. カスタムインジケーターパラメーター
"Gluing type(結合種類)" オプションに注意を払ってください: その統合は、「シンプルな追加」か、「シフトによる追加」です。この段階で、これら二つの統合種類のリストを追加することはできません。したがって、標準の「シンプルな追加」を残してください。 "SYNT"にて、 インジケーターコードは、統合方法のドロップダウンリストを見るためにLater オプションに転換します。
次のウィンドウにて、インジケーターイベントハンドラを選択します:

図8. インジケーターイベントハンドラ
注:OnTimer()関数は、"SYNT" インジケーターにて使用されます。インジケーターの主な機能は、OnTimer() にて設定されます。そのインジケーターは、終了したトレードを持つシンボルチャートの両方に貼り付けられ、(このシンボルは、OnCalculateイベントを含みません)、またアクティブなトレードのシンボルチャートにも追加されます。
"Next(次へ)"を押し、"General properties of the Custom indicator program(カスタムインジケータープログラムの一般的なプロパティ)" にて、"Indicator in separate window(個別ウィンドウのインジケーター)"をチェックしてください:

図9. "個別ウィンドウでのインジケーター" オプション
"Done"ボタンを押して、 "SYNT"インジケーターテンプレートをご覧ください。
ドロップダウンリストをまとめる
ドロップダウンリストでの統合方法のリストを見るために、ENUM_GLUING_TYPE列挙型をインジケーターオプションにて宣言する必要があります。
入力パラメーターブロックの開始時、グローバルスコープにて列挙型を宣言してください:
#property indicator_separate_window
//+------------------------------------------------------------------+
//|  Splicing types enumeration                                      |
//+------------------------------------------------------------------+
enum ENUM_GLUING_TYPE
  {
   simple_addition,        // simple addition||simple addition
   addition_with_shift     // addition with shift||addition with shift
  };
//--- input parameters || input parameters
input ENUM_GLUING_TYPE  gluing_type=simple_addition;
//+------------------------------------------------------------------+
//| Custom indicator initialization function                         |
//+------------------------------------------------------------------+
ドロップダウンリストがどのように表示されるかチェックできます。
そのインジケーター(F7) ファイルをコンパイルしてください。そのインジケーターを貼り付けた後、ドロップダウンリストが稼働していることをオプションにて見ることができます;

図10. それでは、 パラメーターの泥風ダウンリストをご覧になれます
そのチャートに初めて貼り付けられる時か、そのプロパティが変化する際に、「General (一般)」タブにて表示されるインジケーターの詳細を追加してください。
#property version   "1.00"
//+------------------------------------------------------------------+
//| version   "1.00": The timer history swapping                     |
//+------------------------------------------------------------------+
#property description "Indicator for several futures splicing."
#property description "Is drawn in the latest futures window"
#property description "Uses N first symbols for drawing"
#property description "which were taken from the \"Market review\"."

#property indicator_separate_window
インジケーター形成メソッド - DRAW_COLOR_CANDLES - 色付きろうそく.
4つのインジケーターバッファと、色のインデックスストアのための1バッファが必要です。線、インジケーターのスタイル - STYLE_SOLID - 実線インジケーターコードにてすべて表示してください。:
#property description "taken from the \"Market review\"."

//--- indicator settings || indicator settings
#property indicator_separate_window
#property indicator_buffers 5
#property indicator_plots   1
//--- plot Bars || bars plotting
#property indicator_label1    "SYNT"
#property indicator_type1     DRAW_COLOR_CANDLES
#property indicator_style1    STYLE_SOLID
#property indicator_width1    1
//+------------------------------------------------------------------+
//|  enumeration of splicing methods                                 |
//+------------------------------------------------------------------+
"number_futures_gluing"入力パラメーターを入力する - 形成に必要な証券数標準の "number_futures_gluing" 値は、2に等しいです:
//--- input parameters || input parameters
input int               numder_futures_gluing=2;
input ENUM_GLUING_TYPE  gluing_type=simple_addition;
4インジケーターバッファ、カラーインデックスのための1バッファと LoadHistory[]補助配列を宣言してください;
#property indicator_style1    STYLE_SOLID
#property indicator_width1    1
//--- indicator buffers || indicator buffers
double            OpenBuffer[];
double            HighBuffer[];
double            LowBuffer[];
double            CloseBuffer[];
double            ColorCandlesColors[];
double            LoadHistory[];
//+------------------------------------------------------------------+
//|  enumeration of splicing methods                                 |
//+------------------------------------------------------------------+
インジケーターバッファを一次元動的配列に貼り付け、時系列のようにインデックス化するバッファを設定してください。:
//--- indicator buffers mapping
//--- indicator buffers mapping
   SetIndexBuffer(0,OpenBuffer,INDICATOR_DATA);
   SetIndexBuffer(1,HighBuffer,INDICATOR_DATA);
   SetIndexBuffer(2,LowBuffer,INDICATOR_DATA);
   SetIndexBuffer(3,CloseBuffer,INDICATOR_DATA);
   SetIndexBuffer(4,ColorCandlesColors,INDICATOR_COLOR_INDEX);
   SetIndexBuffer(5,LoadHistory,INDICATOR_CALCULATIONS);
//--- set buffer indexing as timeseries
//--- set buffer indexing as in timeseries
   ArraySetAsSeries(OpenBuffer,true);
   ArraySetAsSeries(HighBuffer,true);
   ArraySetAsSeries(LowBuffer,true);
   ArraySetAsSeries(CloseBuffer,true);
   ArraySetAsSeries(ColorCandlesColors,true);
//---
   return(INIT_SUCCEEDED);
インジケーターの名前 ("Open", "High", "Low" and "Close")を"Data window"にて表示するため、 s_symbol変数を必要とします:
input int               numder_futures_gluing=2;
input ENUM_GLUING_TYPE  gluing_type=simple_addition;
//--- symbol name
string s_symbol;
//+------------------------------------------------------------------+
//| Custom indicator initialization function                         |
//+------------------------------------------------------------------+
インジケーターを起動するために、shft_array 変数とgood_history 、 indicator_rendered フラッグを必要とします:
input ENUM_GLUING_TYPE  gluing_type=simple_addition;
//--- symbol name
string   s_symbol;
int      shift_array=0;
bool     good_history=false;        //history is not prepared||history not prepared
bool     indicator_rendered=false;  // indicator is not drawn
//+------------------------------------------------------------------+
//| Custom indicator initialization function                         |
//+------------------------------------------------------------------+
インジケーターをセットアップし、バッファカラーインデックスを選択した色に接続します;
ArraySetAsSeries(CloseBuffer,true);
   ArraySetAsSeries(ColorCandlesColors,true);
//--- set accuracy || accuracy of the indicator values
   IndicatorSetInteger(INDICATOR_DIGITS,0);
//--- set drawing line empty value || empty value of the drawing line
   PlotIndexSetDouble(0,PLOT_EMPTY_VALUE,0.0);
//--- set labels for the line || displayed name in the DataWindow
   PlotIndexSetString(0,PLOT_LABEL,s_symbol+" Open;"+s_symbol+" High;"+s_symbol+" Low;"+s_symbol+" Close");
   IndicatorSetString(INDICATOR_SHORTNAME,"SYNT");
//--- set number of colors in color buffer || number of colors in the buffer
   PlotIndexSetInteger(0,PLOT_COLOR_INDEXES,9);
//--- set line color || set the line color
   PlotIndexSetInteger(0,PLOT_LINE_COLOR,0,clrBlue);
   PlotIndexSetInteger(0,PLOT_LINE_COLOR,1,clrOrange);
   PlotIndexSetInteger(0,PLOT_LINE_COLOR,2,clrRed);
   PlotIndexSetInteger(0,PLOT_LINE_COLOR,3,clrGreen);
   PlotIndexSetInteger(0,PLOT_LINE_COLOR,4,clrPink);
   PlotIndexSetInteger(0,PLOT_LINE_COLOR,5,clrIndigo);
   PlotIndexSetInteger(0,PLOT_LINE_COLOR,6,clrPaleVioletRed);
   PlotIndexSetInteger(0,PLOT_LINE_COLOR,7,clrDarkViolet);
   PlotIndexSetInteger(0,PLOT_LINE_COLOR,8,clrDimGray);
//---
   return(INIT_SUCCEEDED);
OnInit() 関数に、3秒のインターバルにてタイマーの初期化とランダム数ジェネレーターを追加します:
PlotIndexSetInteger(0,PLOT_LINE_COLOR,7,clrDarkViolet);
   PlotIndexSetInteger(0,PLOT_LINE_COLOR,8,clrDimGray);
//---
   EventSetTimer(3);
//--- random number generator initializor
   MathSrand(GetTickCount());
//---
   return(INIT_SUCCEEDED);
統合を処理するために少なくとも二つのシンボルにてそれが必要とされます。
OnCalculate()関数での統合のための金融商品数をチェックしてください:
const long &tick_volume[],
                const long &volume[],
                const int &spread[])
  {
//--- checking the number of instruments || checking the number of instruments
   if(numder_futures_gluing<=1)
     {
      //--- create the message line
      string comm=StringFormat("For the indicator choose not less than %d symbols",numder_futures_gluing);
      //--- display the message in comment in the chart main window
      Comment(comm);
      return(0);
     }
//--- return value of prev_calculated for next call
   return(rates_total);
統合のためのシンボルの数をチェックした後、そのインジケーターがすでに描画されているかチェックします。もしそのインジケーターが描画されていれば、OnCalculate() をやめることができます:
Comment(comm);
      return(0);
     }
   if(indicator_rendered==true) return(rates_total);
//--- return value of prev_calculated for next call
   return(rates_total);
"SYNT" インジケーターが主に日毎のバーの作成傾向を分析するために用いられるので、それぞれのティックごとに再計算に進む必要はないです。それぞれのティックごとに"SYNT"インジケーターの計算はありません。
さらに、以下のケースにてインジケーターを計算する必要があります:
- もしインジケーターが最初に起動された場合;
- 履歴が変化された場合(例えば、追加があります).
if(indicator_rendered==true) return(rates_total);
//--- if calculations were started the first time
//--- or if we need to calculate the indicator for two or more bars (changes in history)
//--- remember, that the "0" bar - is the left-most
   if(prev_calculated==0 || rates_total>prev_calculated+1)
     {
     }
//--- return value of prev_calculated for next call
   return(rates_total);
強制的なインジケーターバッファー初期化
インジケーター "SYNT"バッファは、動的配列に接続しています。
インジケーターが初めて起動する際、バッファは強制的に初期化されます。OnCalculate()にて初期化に進んでください。OnInitではなく、OnCalculate()にて実行する必要があるのでしょうか?その説明は以下の図に示されています。
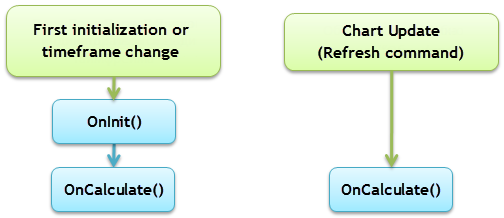
図11. OnCalculate()での配列初期化
図11にてご覧の通り、OnCalculate() イベントはどのような場合でも発生する一方、 OnInit() は"Update"コマンドを通してチャートを更新する際にオンの状態になります。したがって、その配列の初期化は、OnCalculate()にて実行されます:
//--- remember, that the "0" bar - is the left-most
   if(prev_calculated==0 || rates_total>prev_calculated+1)
     {
      //--- arrays initialization
      ArrayInitialize(OpenBuffer,0);
      ArrayInitialize(HighBuffer,0);
      ArrayInitialize(LowBuffer,0);
      ArrayInitialize(CloseBuffer,0);
     }
//--- return value of prev_calculated for next call
   return(rates_total);
ArrayInitialize()関数は、インジケーターバッファーを初期化します。この場合、初期化は0を示します。
EMPTY_VALUE によるバッファインジケーターを初期化するのであれば、"SYNT"にてインジケーターを統合することができません。
シンプルな追加のアルゴリズム

図12. シンプルな追加のアルゴリズム
図の日付は、UX-9.13, UX-12.13や、UX-3.14の先物取引の開始・終了日です。これらのデータは表にて示されています;
| シンボル | 循環開始 | 循環終了 |
|---|---|---|
| UX-9.13 | 2013.03.15 | 2013.09.16 |
| UX-12.13 | 2013.06.17 | 2013.12.16 |
| UX-3.14 | 2013.09.16 | 2014.03.17 |
図にて、 10 2013.12.25 - は、実際のカレンダーの日付です。UX-3.14シンボルは以前有効です。
"シンプルな追加" 統合メソッドは、 SimpleAddition関数にて実装されます:
//+------------------------------------------------------------------+
//| Timer function                                                   |
//+------------------------------------------------------------------+
void OnTimer()
  {
//---
  }
//+------------------------------------------------------------------+
//| Simple addition                                                  |
//| Simple addition. インジケーター配列に追加してください                     |
//| sibmUP symbol                                                    |
//+------------------------------------------------------------------+
bool SimpleAddition(string simbUP,string simbDOWN,ENUM_TIMEFRAMES period,int Color)
  {
  }
//+------------------------------------------------------------------+
simbUP は上向きの先物で、 simbDOWN は下向きの先物で、両方「Market review」ウィンドウに位置しています。Color - 先物を描くために使用される色
SimpleAddition() 関数のすべてのコードは以下に提示されています;
//+------------------------------------------------------------------+
//| Simple addition                                                  |
//| Simple addition. インジケーター配列に追加してください                      |
//| sibmUP symbol                                                    |
//+------------------------------------------------------------------+
bool SimpleAddition(string simbUP,string simbDOWN,ENUM_TIMEFRAMES period,int Color)//////
  {
   datetime expiration_time_UP;     // simbUP symbol expiration date
   datetime expiration_time_DOWN;   // simbDOWN expiration date

   expiration_time_UP=int(SymbolInfoInteger(simbUP,SYMBOL_EXPIRATION_TIME));
   if(expiration_time_UP>TimeLocal())
     {
      expiration_time_UP=TimeLocal();
     }
   if(simbDOWN!="")
     {
      expiration_time_DOWN=int(SymbolInfoInteger(simbDOWN,SYMBOL_EXPIRATION_TIME));
     }
   else
     {
      expiration_time_DOWN=int(SymbolInfoInteger(simbUP,SYMBOL_START_TIME));
     }
//--- Open, High, Low and Close prices will be copied in the rates[] array
   MqlRates rates[];
   ArraySetAsSeries(rates,true);
   int copied=0;           //--- copied number
   copied=CopyRates(simbUP,period,expiration_time_DOWN,expiration_time_UP,rates);
   if(copied>0)
     {
      for(int j=shift_array;j<shift_array+copied;j++)
        {
         //--- write prices in buffers
         OpenBuffer[j]=rates[j-shift_array].open;
         HighBuffer[j]=rates[j-shift_array].high;
         LowBuffer[j]=rates[j-shift_array].low;
         CloseBuffer[j]=rates[j-shift_array].close;
         ColorCandlesColors[j]=Color;
        }
      shift_array=shift_array+copied;
      indicator_rendered=true;
      ChartRedraw();
     }
   else
     {
      Print("Unable to get the symbol history data",simbUP);
      indicator_rendered=false;
      return(false);
     }
//---  Simple addition end
   return(true);
  }
//+------------------------------------------------------------------+
シフトアルゴリズムに追加されます

図13. シフト統合アルゴリズムでの追加
シンプルな追加と比較して、このアルゴリズムでの統合は、そのシンボルがクローズされる10日前に始まります。"シフトでの追加"の統合メソッドは、 AdditionWithShift()関数にて処理されます。
//--- Simple addition end
   return(true);
  }
//+------------------------------------------------------------------+
//| Addition With Shift                                              |
//| Addition with Shift. インジケーター配列のみ追加してください             |
//| sibmUP symbol                                                    |
//+------------------------------------------------------------------+
bool AdditionWithShift(string simbUP,string simbDOWN,ENUM_TIMEFRAMES period,int Color)
  {
//---
   return(true);
  }
//+------------------------------------------------------------------+
AdditionWithShift()とSimpleAddition()関数の違いは、以下の2行の日付から10日引く点です。
.
   .
   .
   expiration_time_UP=int(SymbolInfoInteger(simbUP,SYMBOL_EXPIRATION_TIME))-86400*10;
   .
   .
   .
   expiration_time_DOWN=int(SymbolInfoInteger(simbDOWN,SYMBOL_EXPIRATION_TIME))-86400*10;
   .
   .
   .
コードにおける小さな違いにより、AdditionWithShift()関数のすべての完全なコードを見せません。記事のインジケーターファイルにてそのコードをご覧いただけます。
AdditionWithShift()とSimpleAddition()関数の少々の違いにもかかわらず、(テスト開始や、アルゴリズムのさらなる変化にて)普遍的に使える関数を作成するために統合することはしないほうが良いです。
シンボル履歴のローディング
CheckLoadHistory() 関数は、すべてのシンボルの履歴を補助バッファ tmp_ratesにコピーします。
もしそのコピーのプロセスが成功であれば、true の値が、good_historyフラッグに割り当てられます。これは、インジケーターの描画を開始できるという意味です。
//--- Addition With Shift end
   return(true);
  }
//+------------------------------------------------------------------+
//| Request to receive all history from a trade server               |
//| Request to recieve all history from a trade server               |
//+------------------------------------------------------------------+
bool CheckLoadHistory(string symbol,ENUM_TIMEFRAMES period)
  {
   MqlRates tmp_rates[];      // the Open, High, Low and Close prices will be copied in the rates[]array
   datetime start_time;       // start time of the instrument trades
   datetime expiration_time;  // expiration time of the instrument trade
   start_time=int(SymbolInfoInteger(symbol,SYMBOL_START_TIME));
   expiration_time=int(SymbolInfoInteger(symbol,SYMBOL_EXPIRATION_TIME));
   if(CopyRates(symbol,period,start_time,expiration_time,tmp_rates)>0)
     {
      good_history=true;
     }
   else
     {
      good_history=false;
     }
//---
   return(true);
  }
//+------------------------------------------------------------------+
先物は期間が短く、すべてのl 履歴のコピーはそこまでスペースを取らないので、すべてのシンボル履歴をコピーすることができます。
OnTimer - そのインジケーターのメインの関数
二つの統合用の関数のコードや、履歴をロードするためのコードがあるので、OnTimer()関数を変更することができます;
//+------------------------------------------------------------------+
//| Timer function                                                   |
//+------------------------------------------------------------------+
void OnTimer()
  {
   if(indicator_rendered==true) return;
   if(good_history==true)
     {
      int t=0;       // color || color
      int number;
      switch(gluing_type)
        {
         case simple_addition:
            for(int n=0;n<numder_futures_gluing;n++)
              {
               //--- get the random number
               number=MathRand();
               //--- get the color index as the modulo
               t=number%(PlotIndexGetInteger(0,PLOT_COLOR_INDEXES)-1);
               SimpleAddition(SymbolName(n,true),SymbolName(n+1,true),PERIOD_D1,t);
              }
            break;
         case addition_with_shift:
            for(int n=0;n<numder_futures_gluing;n++)
              {
               //--- get random number
               number=MathRand();
               //--- get the color index as the modulo
               t=number%(PlotIndexGetInteger(0,PLOT_COLOR_INDEXES)-1);
               AdditionWithShift(SymbolName(n,true),SymbolName(n+1,true),PERIOD_D1,t);
              }
            break;
        }
     }
   else
     {
      for(int n=0;n<numder_futures_gluing;n++)
        {
         CheckLoadHistory(SymbolName(n,true),PERIOD_D1);
        }
     }
  }
//+------------------------------------------------------------------+
インジケーターが作成されました。コンパイルし、チャートに貼り付けることができます。クローズされたトレードシンボルを選択し、H1期間を設定することが望ましいです。
"SYNT" インジケーターの初期のアウトプット
異なる統合方法の二つの"SYNT"インジケーターテンプレートをチャートに貼り付けた後、これらのメソッドを比較することができます;
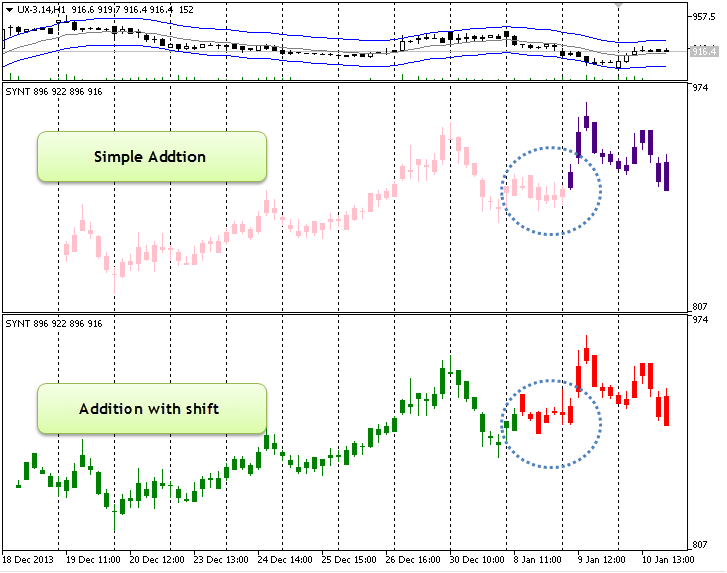
図14. 先物の統合比較の二つのメソッド
インジケーターの統合(標準とカスタム)
カスタムインジケーターは、OnCalculateの最初の呼び出しと、"SYNT"インジケーターと統合できまうs。
int OnCalculate (const int rates_total,      // size of the array price[]
                 const int prev_calculated,  // calculated bars during the previous call
                 const int begin,            // tangible data starting point
                 const double& price[]       // calculation array
   );
"Navigator"ウィンドウにて、"Custom's indicators"のリストを開いてください。"Examples"のリストを開き、インジケーターを選択し、"SYNT"に配置してください。"Parameters" タブにて、 ドロップダウンリストの"以前のインジケーターデータ" を選択してください。
"SYNT" インジケーターにて統合できるインジケーターのリストがあります。 "SYNT" にて稼動できます:
カスタム移動平均インジケーターと3つの先物を統合した"SYNT" インジケーター;

図15. 3つの統合済シンボルの例
結論
日毎のタイムフレームにてオープンされた古いチャートのシンボルの行動を分析するのは簡単です。テクニカルインジケータの数は制限されていますが、このメソッドは、断続的な先物における価格の動きを追跡するのに役に立ちます。
MetaQuotes Ltdによってロシア語から翻訳されました。
元の記事: https://www.mql5.com/ru/articles/802
警告: これらの資料についてのすべての権利はMetaQuotes Ltd.が保有しています。これらの資料の全部または一部の複製や再プリントは禁じられています。
この記事はサイトのユーザーによって執筆されたものであり、著者の個人的な見解を反映しています。MetaQuotes Ltdは、提示された情報の正確性や、記載されているソリューション、戦略、または推奨事項の使用によって生じたいかなる結果についても責任を負いません。

 MQL5 エキスパートアドバイザーから、GSMモデムを使用する
 ビデオチュートリアル:MetaTrader Singals Service
- 無料取引アプリ
- 8千を超えるシグナルをコピー
- 金融ニュースで金融マーケットを探索
いい記事だよ。私はオリジナルであるふりをするつもりはない。しかし、私の考えはこうだ:先物の始まりと循環は常に不安定であり、基礎となる出来高がどこで発生しているかという実像を反映していない。
それがどこまで可能なのかはわからない。しかし、これだけは言いたい。通常の取引が行われる)日付に各先物のインターバルを設定し、これらのセクションを全体として最適化したらどうだろう。
つまり、1つのチャートでテストした後、別のチャートに切り替えるなどということは可能なのだろうか?
もしあなたが "戦略テスターでグルーイングをテストできるか?"と尋ねているのなら、答えはノーだ。- 答えはノーです。つまり、グルーイングはカスタムインジケーター であるため、単純な方法では動作しません。
グルーイングされた先物では動作しないことは明らかです。つまり、本やフォーラムでは、グルーのどの方法が実際の動きをよりよく反映するかを書いているのです。ロバート・パルドの本では、このトピックがよく議論されています。
このアイデアは、各先物に日付間隔を設定し、全体として何年分かのすべてをテストできるというものです。
先物の接着では、それが機能しないことは明らかだ。私が言いたかったのは、本やフォーラムでは、どの糊付け方法が実際の動きをよりよく反映するかについて書かれているということだ。ロバート・パルドの本では、このトピックがよく議論されていました。
それぞれの先物に日付間隔を設定し、全体として何年分かをすべてテストすることができるというものだ。
これを「グルーイング型」と呼ぶ。具体的には、「単純足し算」と「オフセット付き足し算」の2種類ののり付けについて考察している。
キャスタムツールは以前からありました。
もしかしたら、グルーも生成して更新する製品があるのでは?誰もそれに出会っていないのだろうか?
そのようなツールは、Expert Advisorのテストと実行(もちろん、取引に適切なシンボルを割り当てる)に使用できるだろう。