
拡張MACD分析に基づいたトレーダーアシスタント
はじめに
MACD ヒストグラムは、最も良い価格トレンドインジケーターの一つであると認識されています。Dr. A. Elderに推奨されたように、価格トレンドはタイムフレームの最後の二つのバーにより判断されます。しかし、それら二つのバーを使用する以外は何も言うことができません。もちろん、ヒストグラムを見る熟練したトレーダーは、直感でもう少し想像できます。もし分析に最後の3つのバーを取得すれば、情報の量と質は、かなり向上されます。
そのスクリプトについて:
少なくとも二つの方向でスクリプトを使用できます。
まず、マーケット参入/退出ポイントを定義し、そのポジション、方向、ヒストグラム量の成長具合などに沿って、トレードする量を判断するためにトレーディングアシスタントを使用できます。
また、履歴データを分析中にもそのスクリプトを使用できます。もしそのスクリプトをデータ分析のためにチャートに貼り付ければ、属性ウィンドウが表示され、分析される必要のあるタイムフレームと初期のバーの数を明記することができます。もし、実際のトレーディングにそのスクリプトを使用するのであれば、初期のバーの数を0か1に設定する必要があり、ポジションを持つか開くために使用するタイムフレームを明記する必要があります。
//+------------------------------------------------------------------+
//|                                                 TrendMACD v5.mq4 |
//|MACD histogram analysis by the last three bars             Genkov |
//|                                                     genkov@bk.ru |
//+------------------------------------------------------------------+
#property copyright "Genkov"
#property link      "genkov@bk.ru"
//if you comment on the below line, the properties window will not be displayed
#property show_inputs
extern int a = 0;            // here you can specify any initial bar to be analyzed
//extern int period = 1;     //  1 minute
//extern int period = 5;     //  5 minutes
//extern int period = 15;    // 15 minutes
extern int period = 30;      //  30 minutes
//extern int period = 60;    // comment on the timeframe you need
//extern int period = 240;   // 4 hours
//extern int period = 1440;  // day
//extern int period = 10080; // week
//extern int period = 43200; // month
//+------------------------------------------------------------------+
それでは、メイン変数 'aをスクリプトのグローバル変数に、タイムフレームにおける'初期のバーの数と変数'期間'のためにを配置します。計算と比較のための初期の変数は、起動時の関数の後に配置されます:
int start()
  {
    int b,c;
    b=a+1; c=b+1;
//----
double Macd_h1_a= iMACD(NULL,period,12,26,9,PRICE_CLOSE,MODE_MAIN,a);
double Macd_h1_b= iMACD(NULL,period,12,26,9,PRICE_CLOSE,MODE_MAIN,b);
double Macd_h1_c= iMACD(NULL,period,12,26,9,PRICE_CLOSE,MODE_MAIN,c);
計算の視覚的操作のため、過去のイベント(履歴)を分析する際に役にたつPrint()オペレーターを置くことができます。乗数 "*1000" は、取得された結果のさらなる読みやすさのために使用されます。
Print("   Macd_h1_c= ",Macd_h1_c*1000,"   Macd_h1_b= ",
          Macd_h1_b*1000,"   Macd_h1_a= ",Macd_h1_a*1000);
もしメッセージ(アラート)を停止する必要があれば、"int Message = 1"の1を0に取り替えます。同時に、その情報を表示するために、 "int Message = 1;" と"Message == 1;"にコメントをし、 Print()オペレーターとAlert()オペレーターを取り替えます。すると、クライアントターミナルの"Expert Advisors"タブにその情報を見ることができるようになります。
スクリプトは、CetTickCount()関数を用いてスクリプトの稼働時間を計算できるようにします。このため、プログラムの最初に以下のオペレーターを加えてください;
int start=GetTickCount();
//…
//…, and at the end of the program:
Alert("   Calculation time  ", GetTickCount()-start," millisec");
そのスクリプトの主な部分は、ステータス(分析されるバーにおけるヒストグラムの値の差の比率とポジション)を分析するブロックです。
そのスクリプトでは、主な関連する一時的なステータスが分析されます。例:
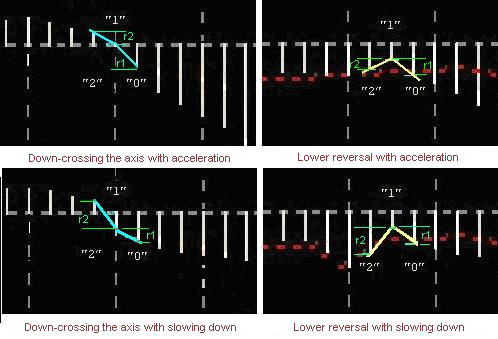
合計6つの比較ブロックがプログラム内にあります:その軸の下にMACDのブロック1−2があります:
// ----------------------for MACD below the axis-------------------------1--&
  if(Macd_h1_c<0.0&&Macd_h1_a<0.0&&Macd_h1_a<0.0)
   {
     //increment of bar "0" as related to the first one
     double r1=MathAbs(MathAbs(Macd_h1_a)-MathAbs(Macd_h1_b));
     //increment of bar "1" as related to bar "2"
     double r2=MathAbs(MathAbs(Macd_h1_b)-MathAbs(Macd_h1_c));
// -- MACD is below - the trend is moving down
   if(Macd_h1_c>Macd_h1_b&&Macd_h1_b>Macd_h1_a)
    {
     if(r1>r2)
     {
     Alert("On bar ",a," MACD<0 = ",Macd_h1_a,
           "  The trend is moving down \\\'with acceleration");
     }
    if(r1<r2)
     {
     Alert("On bar ",a," MACD<0 = ",Macd_h1_a,
           "  The trend is moving down \^with slowing down");
     }
    if((r1==r2)||MathAbs(r1-r2)<0.000015)
     {
     Alert("On bar ",a," MACD<0 = ",Macd_h1_a,
           "  The trend is moving down with constant acceleration");
     }
    }
// -- MACD is below - the trend is moving up
   if(Macd_h1_c<Macd_h1_b&&Macd_h1_b<Macd_h1_a)
    {
    if(r1>r2)
     {
     Alert("On bar ",a," MACD<0 =",Macd_h1_a,
           "  The trend is moving up //''with acceleration");
     }
    if(r1<r2)
     {
     Alert("On bar ",a," MACD<0 = ",Macd_h1_a,
           "  The trend is moving up /^with slowing down");
     }
    if((r1==r2)||MathAbs(r1-r2)<0.000015)
     {
     Alert("On bar ",a," MACD<0 = ",Macd_h1_a,
           "  The trend is moving up with constant acceleration");
     }
    }
// --- MACD is below - the trend reverses down
   if(Macd_h1_c<Macd_h1_b&&Macd_h1_b>Macd_h1_a)
    {
    if(r1>r2)
     {
     Alert("On bar ",a," MACD<0 = ",Macd_h1_a,
           "  The trend reverses down /\\'with acceleration");
     }
    if(r1<r2)
     {
     Alert("On bar ",a," MACD<0 = ",Macd_h1_a,
           "  The trend reverses down //^with slowing down");
     }
    }
// --- MACD is below - the trend reverses up
   if(Macd_h1_c>Macd_h1_b&&Macd_h1_b<Macd_h1_a)
    {
    if(r1>r2)
     {
     Alert("On bar ",a," MACD<0 = ",Macd_h1_a,
           "  The trend reverses up //''with acceleration");
     }
     if(r1<r2)
     {
     Alert("On bar ",a," MACD<0 = ",Macd_h1_a,
           "  The trend reverses up \/^with slowing down");
     }
    }
   if(MathAbs(MathAbs(Macd_h1_a)-MathAbs(Macd_h1_b))<0.0002 &&
      MathAbs(MathAbs(Macd_h1_c)-MathAbs(Macd_h1_b))<0.0002)
    {
    Alert("On bar ",a,", it is Flat! within the range of:  ",Macd_h1_c,
          "   ",Macd_h1_b,"   ",Macd_h1_a);
    }
   }
ブロック 2-3はとても似ています - その軸の上のMACD (添付ファイルをご覧ください)
ブロック3-4 は、その軸のアップクロッシングに使用されます:
// ------------for up-crossing the axis------------------3--&
   if(Macd_h1_c<0.0 && Macd_h1_b<0.0 && Macd_h1_a>0&&  // c<0 b<0
      Macd_h1_c<Macd_h1_b&&Macd_h1_b<Macd_h1_a)
    {
     r1=MathAbs(Macd_h1_a)+MathAbs(Macd_h1_b);
     r2=MathAbs(Macd_h1_c)-MathAbs(Macd_h1_b);
    if(MathAbs(r1)>MathAbs(r2))
     {
     Alert("On bar ",a," the trend is up-crossing axis //'' with acceleration ");
     }
    if(MathAbs(r1)<MathAbs(r2))
     {
     Alert("On bar ",a," the trend is up-crossing axis /^ with slowing down ");
     }
    }
//---
   if(Macd_h1_c<0.0 && Macd_h1_b>0.0 && Macd_h1_a>0&&  // b>0 a>0
      Macd_h1_c<Macd_h1_b&&Macd_h1_b<Macd_h1_a)
    {
     r1=MathAbs(Macd_h1_a)-MathAbs(Macd_h1_b);
     r2=MathAbs(Macd_h1_c)+MathAbs(Macd_h1_b);
    if(MathAbs(r1)>MathAbs(r2))
     {
     Alert("On bar ",a," the trend is up-crossing axis //''with acceleration");
     }
    if(MathAbs(r1)<MathAbs(r2))
     {
     Alert("On bar ",a," the trend is up-crossing axis /^ with slowing down");
     }
    }
同様に
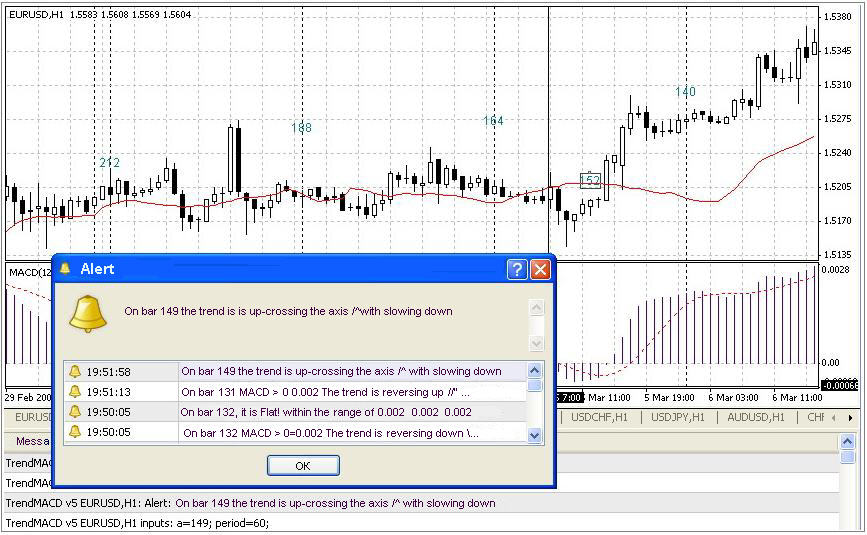
履歴を扱うそのスクリプトの例:
ブロック5-6は、その軸の下の反転に用いら、ブロック 6-7は、その軸の上の反転に用いられます。そのブロックは、コメントが記入され、履歴データを分析したい人が使用できます(添付ファイルをご覧ください)
もしトレーディングにそのスクリプトを使用したいのであれば、以下のように修正される必要があります:
//+------------------------------------------------------------------+
//|                                                 TrendMACD v6.mq4 |
//|     for trading                                                  |
//+------------------------------------------------------------------+

#property copyright "Genkov"
#property link      "genkov@bk.ru"
extern int a = 0;      // here you can specify the initial bar to be analyzed
extern int period = 30;       // set the value of the period you need
//+------------------------------------------------------------------+
int start()
  {
   int b,c; b=a+1; c=b+1;
//----
  double Macd_h1_a= iMACD(NULL,period,12,26,9,PRICE_CLOSE,MODE_MAIN,a);
  double Macd_h1_b= iMACD(NULL,period,12,26,9,PRICE_CLOSE,MODE_MAIN,b);
  double Macd_h1_c= iMACD(NULL,period,12,26,9,PRICE_CLOSE,MODE_MAIN,c);
…
….
その他の比較ブロックは、ベーシックバージョンで提示されているものと同じです。
スクリプトがトレーディングにてどのように作動するかの例:

'a' と 'period' 変数の値は、そのスクリプトを使用する前に設定される必要があることに注意してください。さらに、トレーディングバージョンでは、初期のバーは1に設定することが妥当です。というのも、0個のバーは、特定の期間の途中、もしくは最初のデータ要求する際に不完全になることがあるためです。
結論として、このスクリプトを使用して、熟練したトレーダー、初心者両方の手助けになり、すくなくとも10パーセントまでエラーを減らしたいと願っています。トレーディングを楽しんでください!
MetaQuotes Ltdによってロシア語から翻訳されました。
元の記事: https://www.mql5.com/ru/articles/1519
警告: これらの資料についてのすべての権利はMetaQuotes Ltd.が保有しています。これらの資料の全部または一部の複製や再プリントは禁じられています。
この記事はサイトのユーザーによって執筆されたものであり、著者の個人的な見解を反映しています。MetaQuotes Ltdは、提示された情報の正確性や、記載されているソリューション、戦略、または推奨事項の使用によって生じたいかなる結果についても責任を負いません。

 30のインジケーターとオシレーターの比較分析
 グラフィカルインタフェース II:メニュー項目要素(チャプター1)

- 無料取引アプリ
- 8千を超えるシグナルをコピー
- 金融ニュースで金融マーケットを探索