
A Trader's Assistant Based on Extended MACD Analysis
Introduction
MACD histogram is recognized as one of the best trend-of-prices indicators. As recommended by Dr. A. Elder, the trend of prices is determined by the last two bars on the corresponding timeframe. However, we cannot say anything else using those two bars. Of course, an experienced trader looking at a histogram can imagine a bit more basing him or herself upon intuition. Well, if we take the last three bars for our analysis, the quantity and quality of our information will be extended considerably.
A Glimpse of the Script Itself:
You can use the script in at least two directions.
First, it can be used as a trading assistant to define the market enter/exit points, as well as to decide about the amount of traded lots (volume) according to the position, the direction and the positive/negative acceleration of the histogram volume.
Second, you can use the script while analyzing historical data. If you attach the script to the chart in order to analyze the data, the window of properties will appear, in which you can specify (change) the number of the initial bar and any timeframe to be analyzed. If you use the script in real-time trading, you should set the initial bar number to zero (the last current bar) or to one (at user's wish), and you should specify the timeframe that you use to open or hold your positions.
//+------------------------------------------------------------------+
//|                                                 TrendMACD v5.mq4 |
//|MACD histogram analysis by the last three bars             Genkov |
//|                                                     genkov@bk.ru |
//+------------------------------------------------------------------+
#property copyright "Genkov"
#property link      "genkov@bk.ru"
//if you comment on the below line, the properties window will not be displayed
#property show_inputs
extern int a = 0;            // here you can specify any initial bar to be analyzed
//extern int period = 1;     //  1 minute
//extern int period = 5;     //  5 minutes
//extern int period = 15;    // 15 minutes
extern int period = 30;      //  30 minutes
//extern int period = 60;    // comment on the timeframe you need
//extern int period = 240;   // 4 hours
//extern int period = 1440;  // day
//extern int period = 10080; // week
//extern int period = 43200; // month
//+------------------------------------------------------------------+
We will place the main variable 'a' for the initial bar number and variable 'period' for timeframes in the script's global variables. The internal variable for calculations and comparisons will be placed after the launching function:int start()
{
int b,c;
b=a+1; c=b+1;
//----
double Macd_h1_a= iMACD(NULL,period,12,26,9,PRICE_CLOSE,MODE_MAIN,a);
double Macd_h1_b= iMACD(NULL,period,12,26,9,PRICE_CLOSE,MODE_MAIN,b);
double Macd_h1_c= iMACD(NULL,period,12,26,9,PRICE_CLOSE,MODE_MAIN,c);
For the visual control of calculations, you can put here the Print() operator that can be useful when analyzing the past events (on history). Multiplier "*1000" (or you may use any other) is used for better readability of the obtained results.Print(" Macd_h1_c= ",Macd_h1_c*1000," Macd_h1_b= ",
Macd_h1_b*1000," Macd_h1_a= ",Macd_h1_a*1000);
If you need to disable messaging (Alerts), you should replace one with zero in the "int Message = 1;" operator. At the same time, to display the information somewhere, you should comment on the operators of "int Message = 1;" and "Message == 1;" and replace all later operators Alert() with operators Print(), then you will be able to see the information in the "Expert Advisors" tab of the client terminal.
The script provides the possibility to calculate the script operating time using the GetTickCount() function. For this purpose, place the following operator at the beginning of the program:
int start=GetTickCount(); //… //…, and at the end of the program: Alert(" Calculation time ", GetTickCount()-start," millisec");
The main code of the script consists of blocks comparing the statuses (the position and the size of ratios of differences between the values of the histogram on the analyzed bars).
In the script, the main relevant possible transient states (situations) are analyzed. For example:
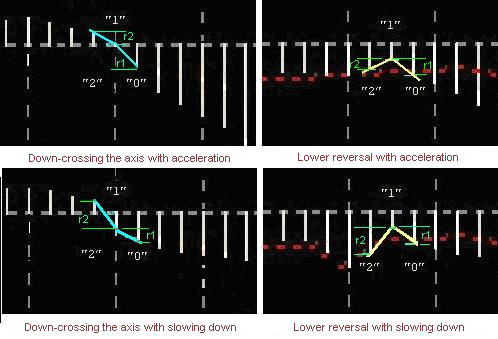
In total, there are 6 comparison blocks in the program: blocks 1-2 for MACD below the axis:
// ----------------------for MACD below the axis-------------------------1--& if(Macd_h1_c<0.0&&Macd_h1_a<0.0&&Macd_h1_a<0.0) { //increment of bar "0" as related to the first one double r1=MathAbs(MathAbs(Macd_h1_a)-MathAbs(Macd_h1_b)); //increment of bar "1" as related to bar "2" double r2=MathAbs(MathAbs(Macd_h1_b)-MathAbs(Macd_h1_c)); // -- MACD is below - the trend is moving down if(Macd_h1_c>Macd_h1_b&&Macd_h1_b>Macd_h1_a) { if(r1>r2) { Alert("On bar ",a," MACD<0 = ",Macd_h1_a, " The trend is moving down with acceleration"); } if(r1<r2) { Alert("On bar ",a," MACD<0 = ",Macd_h1_a, " The trend is moving down with slowing down"); } if((r1==r2)||MathAbs(r1-r2)<0.000015) { Alert("On bar ",a," MACD<0 = ",Macd_h1_a, " The trend is moving down with constant acceleration"); } } // -- MACD is below - the trend is moving up if(Macd_h1_c<Macd_h1_b&&Macd_h1_b<Macd_h1_a) { if(r1>r2) { Alert("On bar ",a," MACD<0 =",Macd_h1_a, " The trend is moving up with acceleration"); } if(r1<r2) { Alert("On bar ",a," MACD<0 = ",Macd_h1_a, " The trend is moving up with slowing down"); } if((r1==r2)||MathAbs(r1-r2)<0.000015) { Alert("On bar ",a," MACD<0 = ",Macd_h1_a, " The trend is moving up with constant acceleration"); } } // --- MACD is below - the trend reverses down if(Macd_h1_c<Macd_h1_b&&Macd_h1_b>Macd_h1_a) { if(r1>r2) { Alert("On bar ",a," MACD<0 = ",Macd_h1_a, " The trend reverses down with acceleration"); } if(r1<r2) { Alert("On bar ",a," MACD<0 = ",Macd_h1_a, " The trend reverses down with slowing down"); } } // --- MACD is below - the trend reverses up if(Macd_h1_c>Macd_h1_b&&Macd_h1_b<Macd_h1_a) { if(r1>r2) { Alert("On bar ",a," MACD<0 = ",Macd_h1_a, " The trend reverses up with acceleration"); } if(r1<r2) { Alert("On bar ",a," MACD<0 = ",Macd_h1_a, " The trend reverses up with slowing down"); } } if(MathAbs(MathAbs(Macd_h1_a)-MathAbs(Macd_h1_b))<0.0002 && MathAbs(MathAbs(Macd_h1_c)-MathAbs(Macd_h1_b))<0.0002) { Alert("On bar ",a,", it is Flat! within the range of: ",Macd_h1_c, " ",Macd_h1_b," ",Macd_h1_a); } }
Block 2-3 is very similar - for MACD above the axis (see the attached files).
Block 3-4 is used for up-crossing the axis:// ------------for up-crossing the axis------------------3--&
if(Macd_h1_c<0.0 && Macd_h1_b<0.0 && Macd_h1_a>0&& // c<0 b<0
Macd_h1_c<Macd_h1_b&&Macd_h1_b<Macd_h1_a)
{
r1=MathAbs(Macd_h1_a)+MathAbs(Macd_h1_b);
r2=MathAbs(Macd_h1_c)-MathAbs(Macd_h1_b);
if(MathAbs(r1)>MathAbs(r2))
{
Alert("On bar ",a," the trend is up-crossing axis with acceleration ");
}
if(MathAbs(r1)<MathAbs(r2))
{
Alert("On bar ",a," the trend is up-crossing axis with slowing down ");
}
}
//---
if(Macd_h1_c<0.0 && Macd_h1_b>0.0 && Macd_h1_a>0&& // b>0 a>0
Macd_h1_c<Macd_h1_b&&Macd_h1_b<Macd_h1_a)
{
r1=MathAbs(Macd_h1_a)-MathAbs(Macd_h1_b);
r2=MathAbs(Macd_h1_c)+MathAbs(Macd_h1_b);
if(MathAbs(r1)>MathAbs(r2))
{
Alert("On bar ",a," the trend is up-crossing axis with acceleration");
}
if(MathAbs(r1)<MathAbs(r2))
{
Alert("On bar ",a," the trend is up-crossing axis with slowing down");
}
}
Similarly, block 4-5 is used to down-cross the axis (see the attached files).
Block 5-6 is used for the reversal under the axis, block 6-7 is for the reversal above the axis. The blocks are commented on and can be used by those who like to analyze historical data (see the attached files).
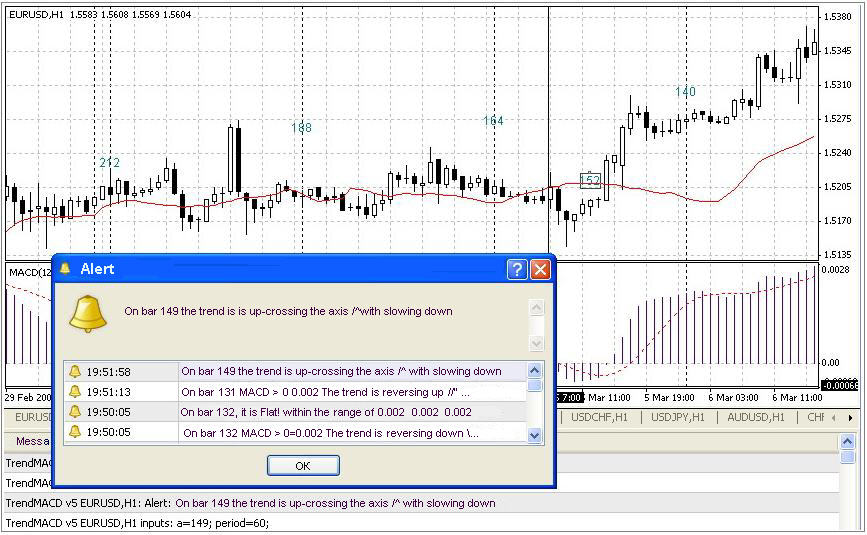
An example of the script working on history:
If you want to use the script for trading, its heading should look as follows://+------------------------------------------------------------------+
//| TrendMACD v6.mq4 |
//| for trading |
//+------------------------------------------------------------------+
#property copyright "Genkov"
#property link "genkov@bk.ru"
extern int a = 0; // here you can specify the initial bar to be analyzed
extern int period = 30; // set the value of the period you need
//+------------------------------------------------------------------+
int start()
  {
    int b,c;
    b=a+1; c=b+1;
//----
double Macd_h1_a= iMACD(NULL,period,12,26,9,PRICE_CLOSE,MODE_MAIN,a);
double Macd_h1_b= iMACD(NULL,period,12,26,9,PRICE_CLOSE,MODE_MAIN,b);
double Macd_h1_c= iMACD(NULL,period,12,26,9,PRICE_CLOSE,MODE_MAIN,c);
…
….
The other comparison blocks are the same as those given in the basic version.
An example of how the script works for trading:

Please note that the values of variables 'a' and 'period' must be set before you start using the script! Besides, it would be more reasonable in the trading version to set the initial bar for one, since the zero bar may turn out to be incomplete as of the moment of data requesting, for example, at the beginning or in the middle of a period.
As a conclusion, I would like to express my hope for that the usage of this script will help both the beginners in trading and the experienced traders, and that it will also decrease the amount of errors by at least 10 percent. Happy trading to everybody!
Translated from Russian by MetaQuotes Ltd.
Original article: https://www.mql5.com/ru/articles/1519
Warning: All rights to these materials are reserved by MetaQuotes Ltd. Copying or reprinting of these materials in whole or in part is prohibited.
This article was written by a user of the site and reflects their personal views. MetaQuotes Ltd is not responsible for the accuracy of the information presented, nor for any consequences resulting from the use of the solutions, strategies or recommendations described.
 Expert Advisors Based on Popular Trading Systems and Alchemy of Trading Robot Optimization (Part VII)
 Grouped File Operations
 Individual Psychology of a Trader
 Method of Determining Errors in Code by Commenting
- Free trading apps
- Over 8,000 signals for copying
- Economic news for exploring financial markets
You agree to website policy and terms of use
Please translate english
if(Macd_h1_c<Macd_h1_b&&Macd_h1_b<Macd_h1_a&&(r1>r2))
{
Alert("Íà ",a," áàğå MACD >0 = ",Macd_h1_a,
" Òğåíä èäåò ââåğõ //''ñ óñêîğåíèåì");
I tried for myself to implement MACD extension which shows differences of current and previous MACD histogram value as another histogram. These values are small to MACD histogram so I multiplied it with 5
You can see it with blue color. It gives pretty good signals.
MACD Extended
Do you trade with this indicator? What are you success results?
I tried for myself to implement MACD extension which shows differences of current and previous MACD histogram value as another histogram. These values are small to MACD histogram so I multiplied it with 5
You can see it with blue color. It gives pretty good signals.
MACD Extended