Transaction Speed MT4

Ecco la traduzione in italiano, senza alcun commento aggiuntivo:

L’indicatore evidenzia le zone in cui viene dichiarato interesse da parte del mercato e mostra successivamente la zona di accumulo degli ordini.

Transaction Speed funziona come un order book su larga scala.

Questo è l’indicatore per il capitale più grande. Le sue prestazioni sono eccezionali. Qualsiasi interesse presente sul mercato, lo vedrai.

Transaction Speed è un indicatore concettualmente nuovo che mostra dove e quando si accumulano grandi ordini sul mercato e permette di trarne vantaggio. Rileva i cambi di trend in una fase molto precoce. Nel Forex, il volume viene chiamato volume in modo fuorviante. In realtà è la variazione del prezzo per unità di tempo, quindi il nome corretto è velocità di transazione. Tutto dipende da come pensiamo, agiamo e analizziamo. Il cambiamento di paradigma è di importanza fondamentale. Questo indicatore rivede completamente l’idea del volume nel Forex, definendolo in modo logico e corretto, e applicare questa logica lo rende uno strumento unico e preciso.

Come usarlo:

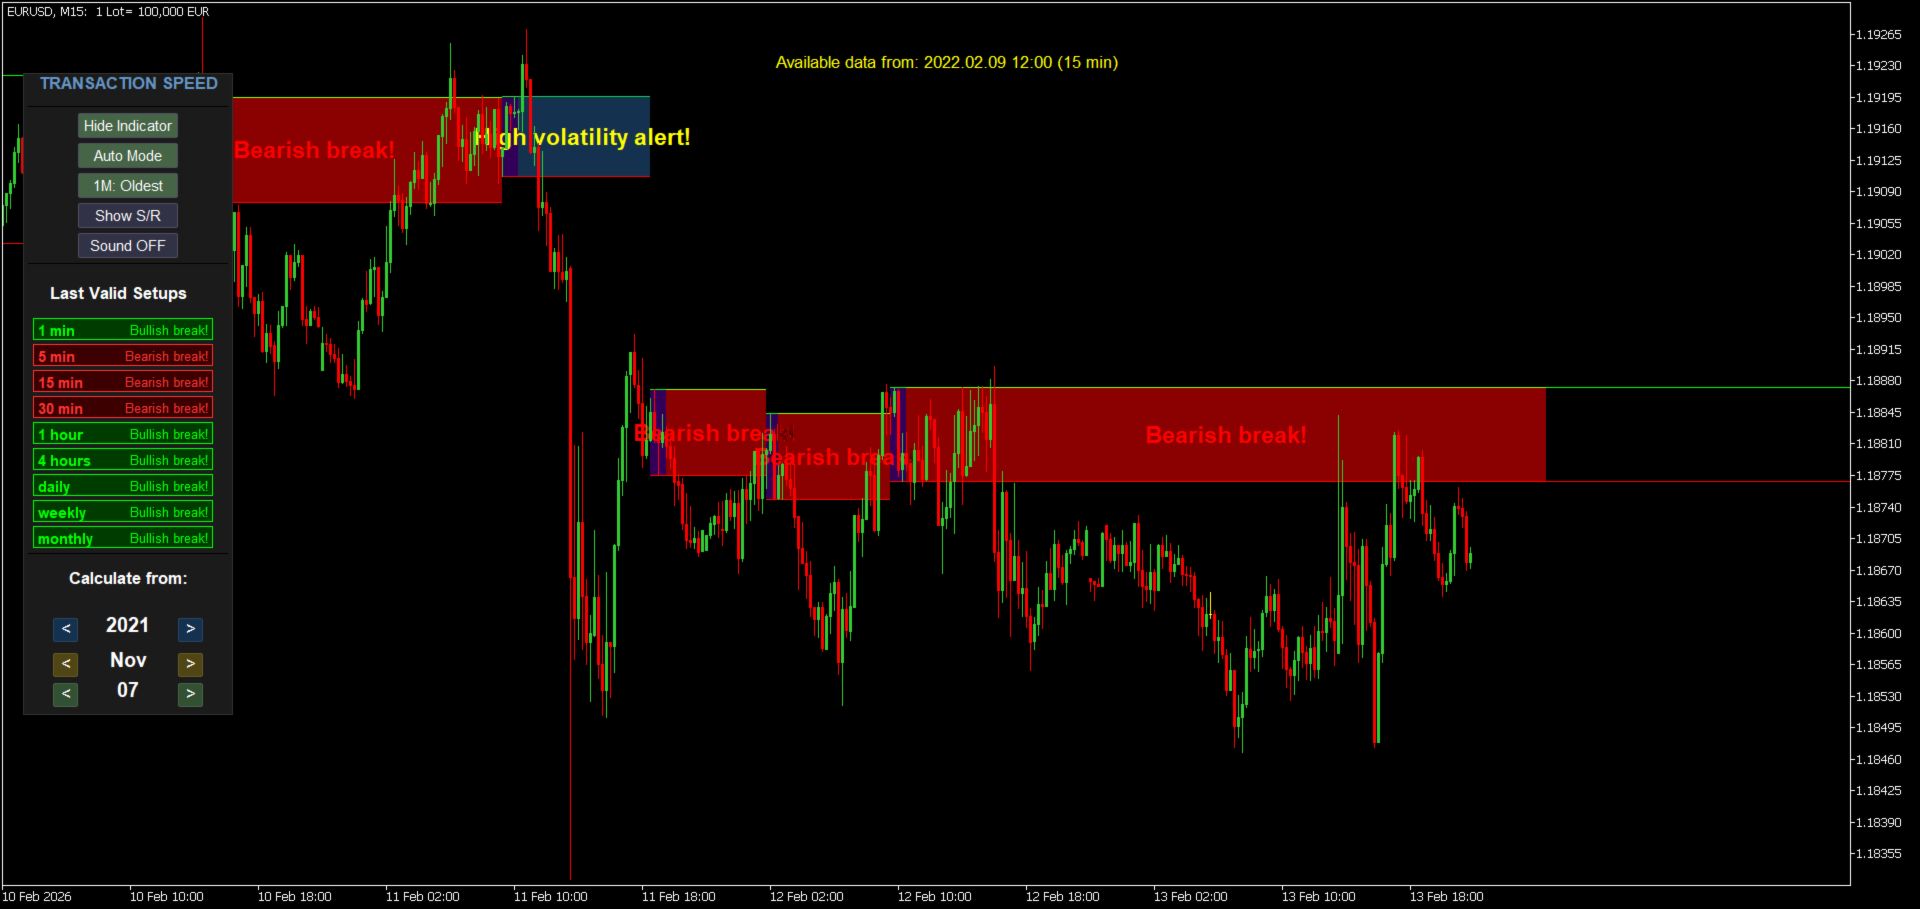
Per impostazione predefinita, l’indicatore è in modalità automatica, permettendo di usarlo indipendentemente su qualsiasi timeframe. Se desideri passare alla modalità manuale, basta cliccare sul pulsante auto / manual.

In modalità manuale tutti i calcoli iniziano dal gennaio 2025. Puoi modificare questa data per vedere risultati diversi. Il periodo ottimale di dati per l’indicatore è tra quattro e sei mesi. In questo modo catturi dati da più cicli, garantendo una base solida ai risultati. Più grande è il periodo, meno zone verranno create.

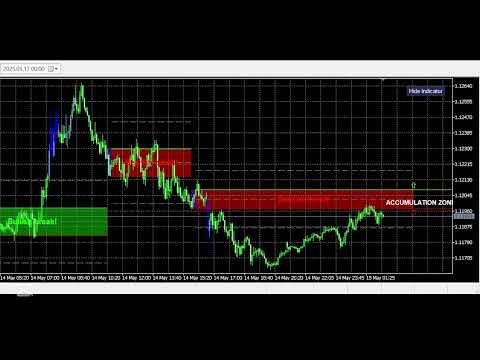
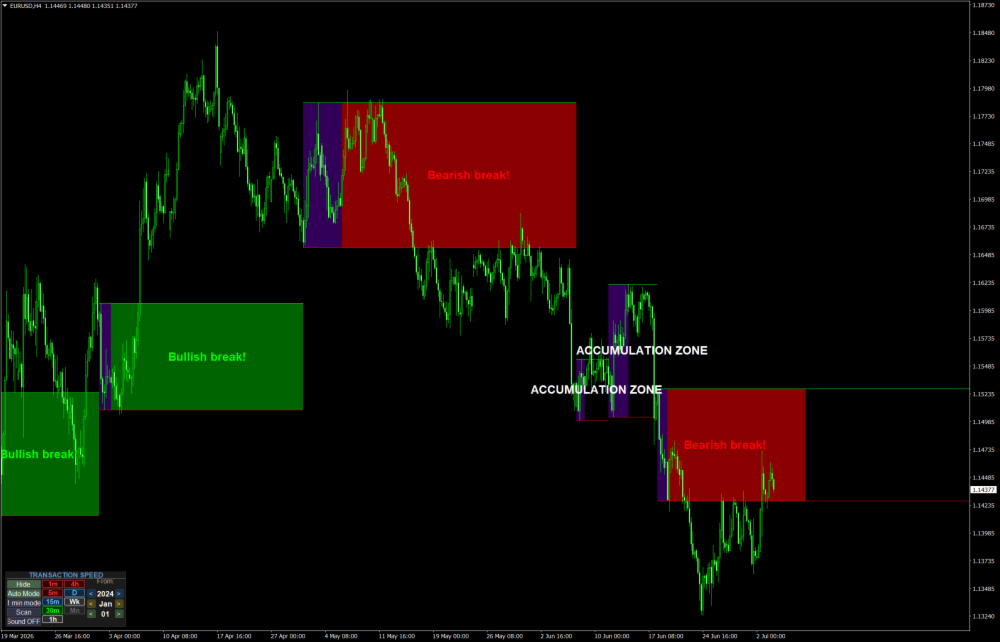
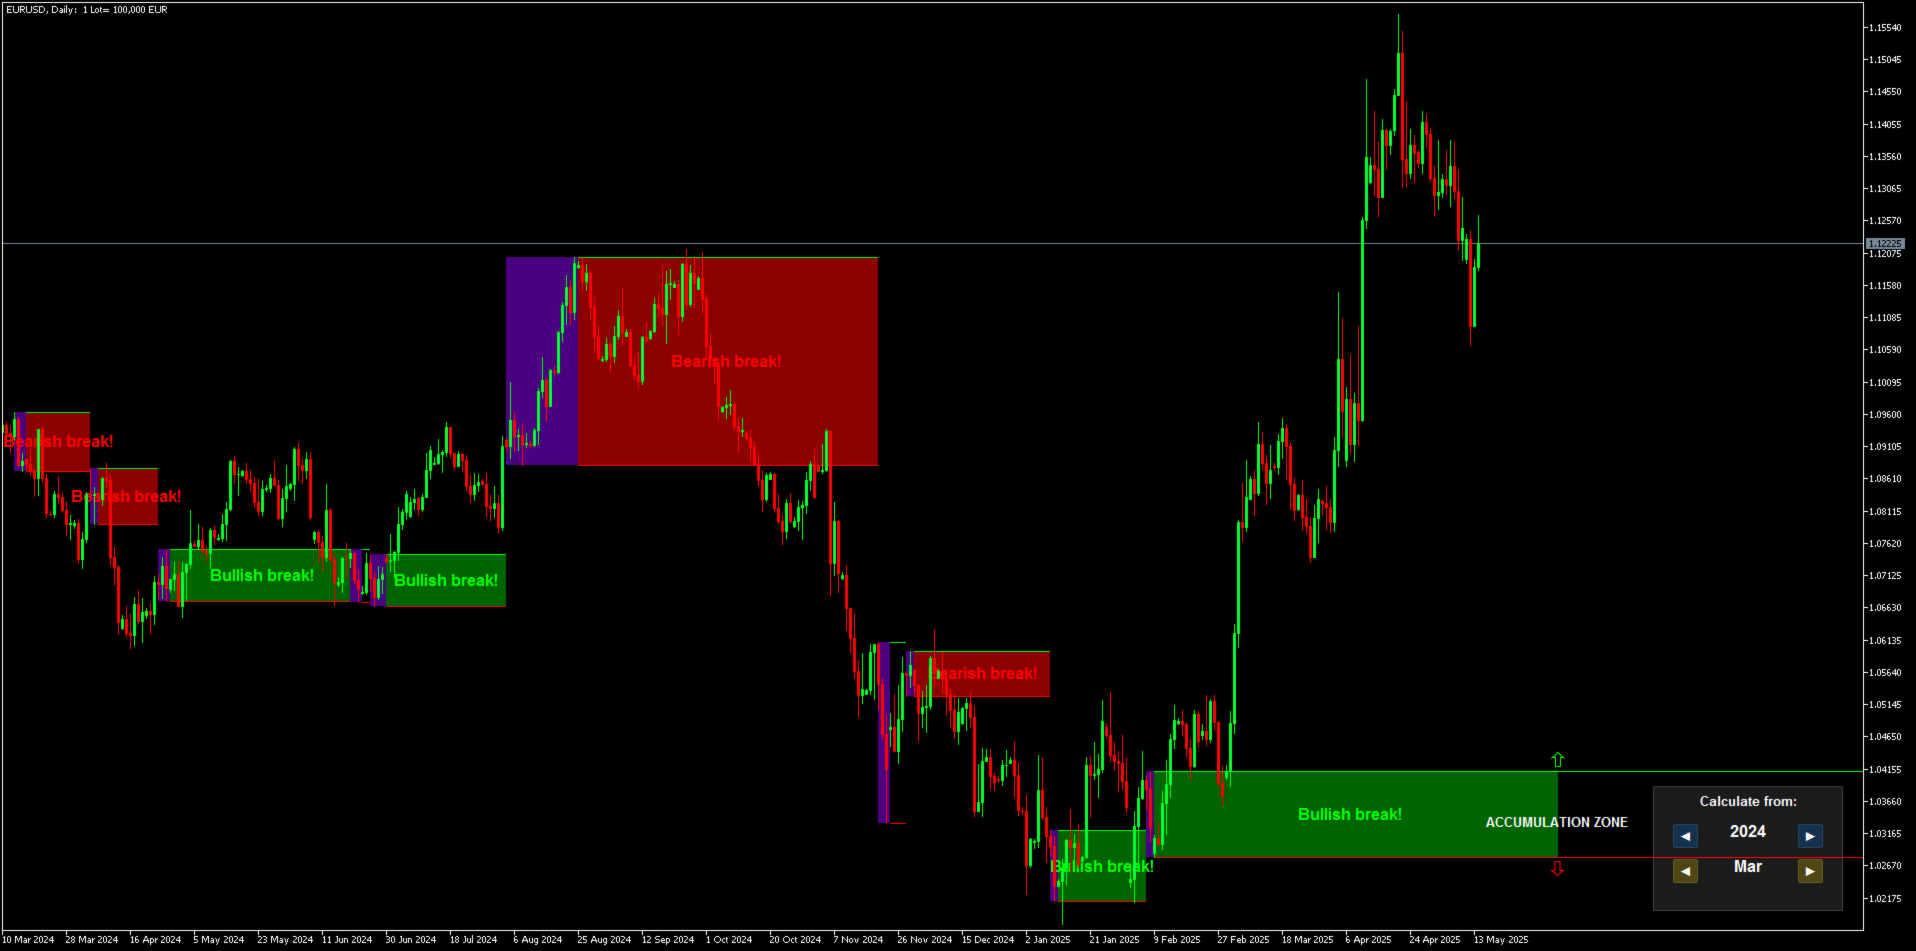
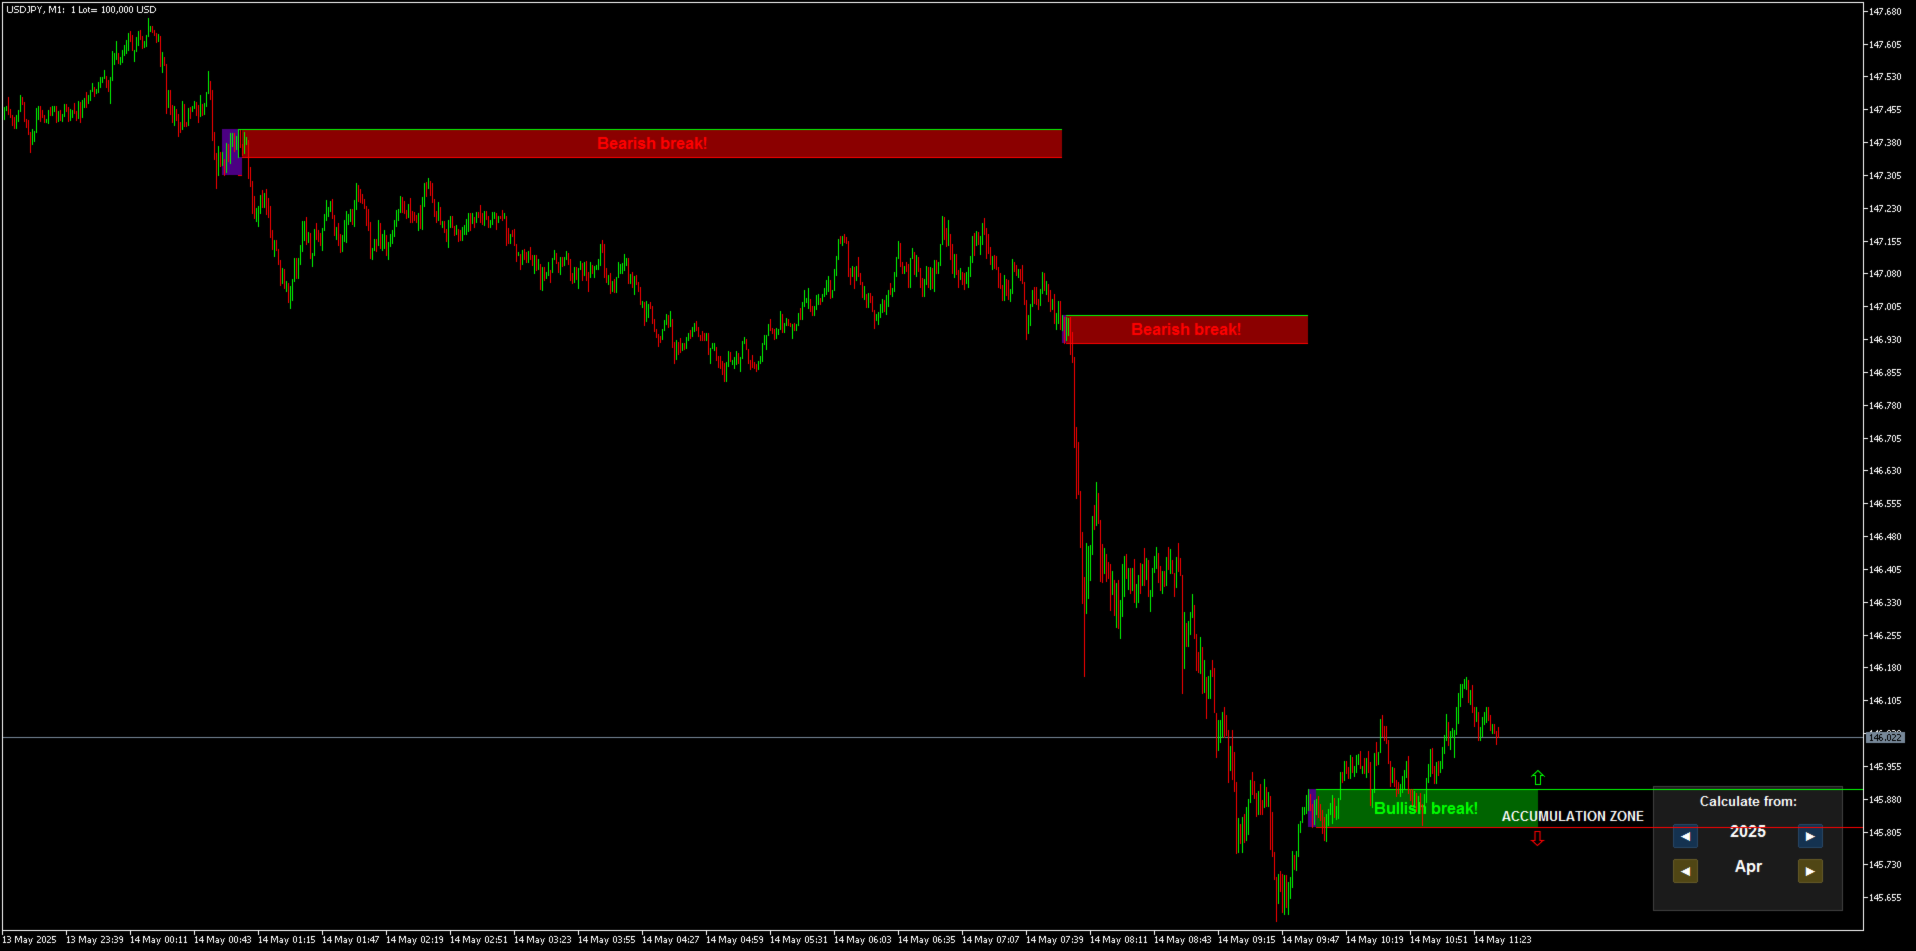
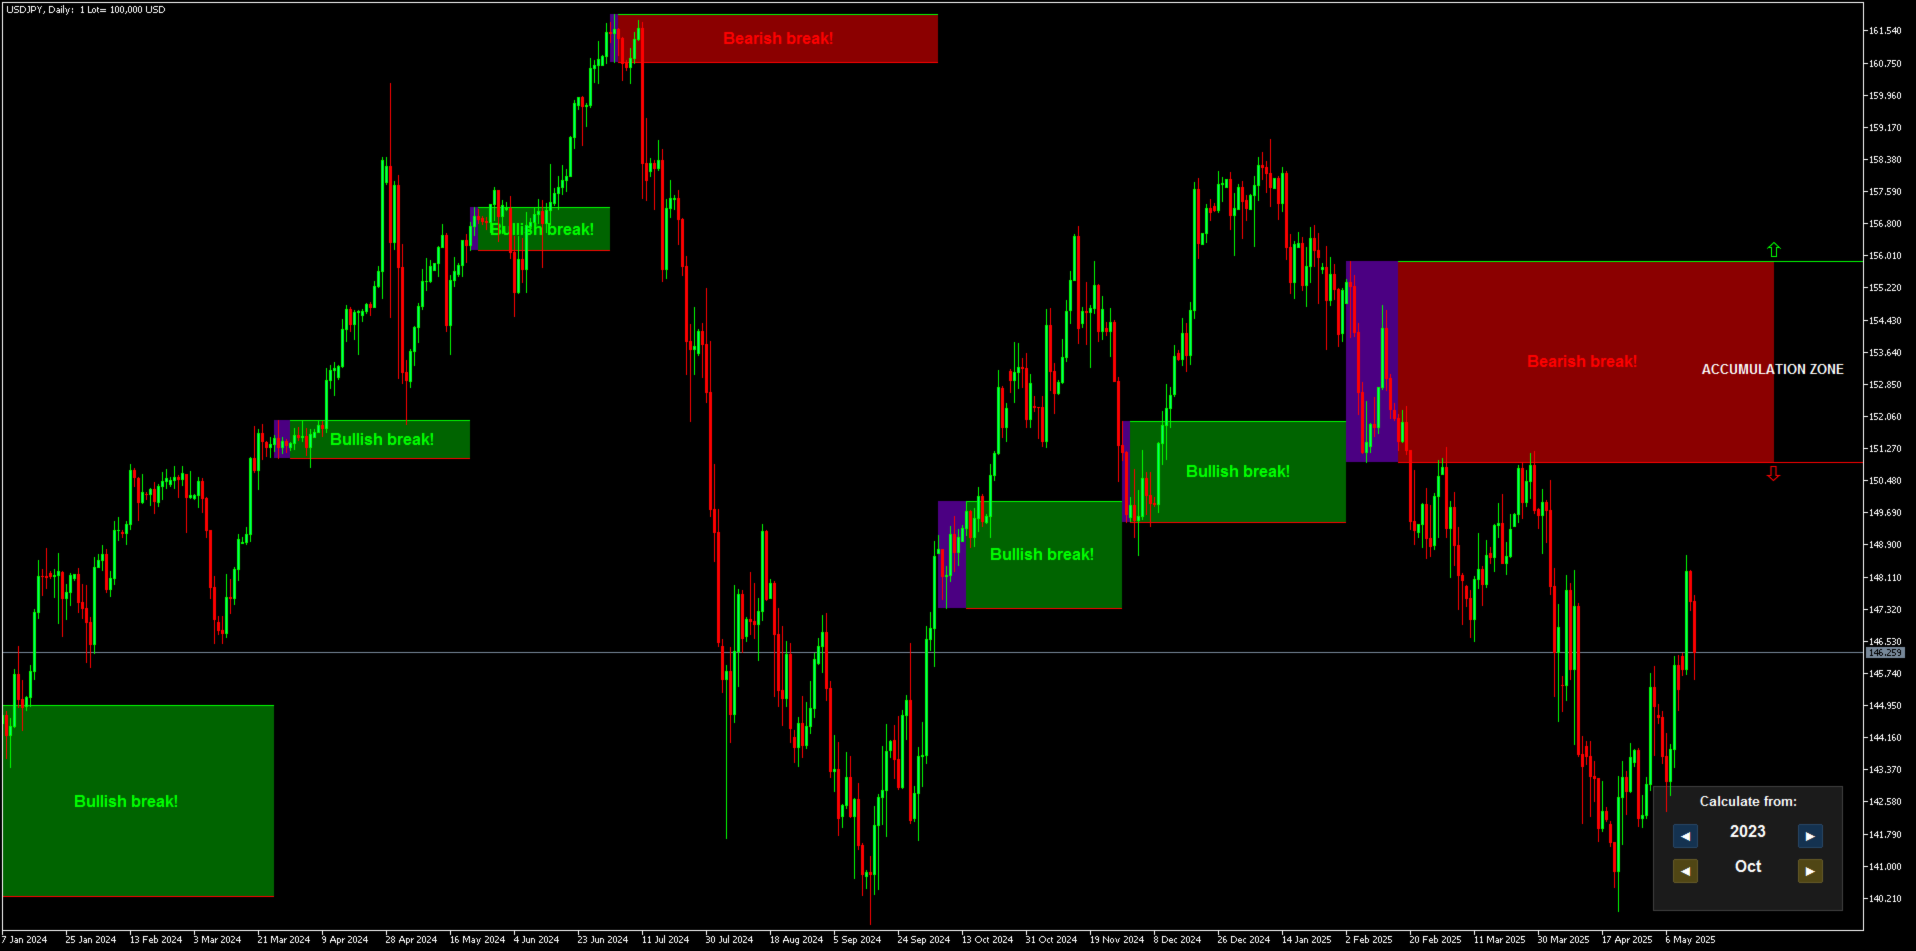
L’area in cui il mercato mostra DECLARED INTEREST è evidenziata con un rettangolo viola. Successivamente appare la ZONA DI ACCUMULO DEGLI ORDINI.

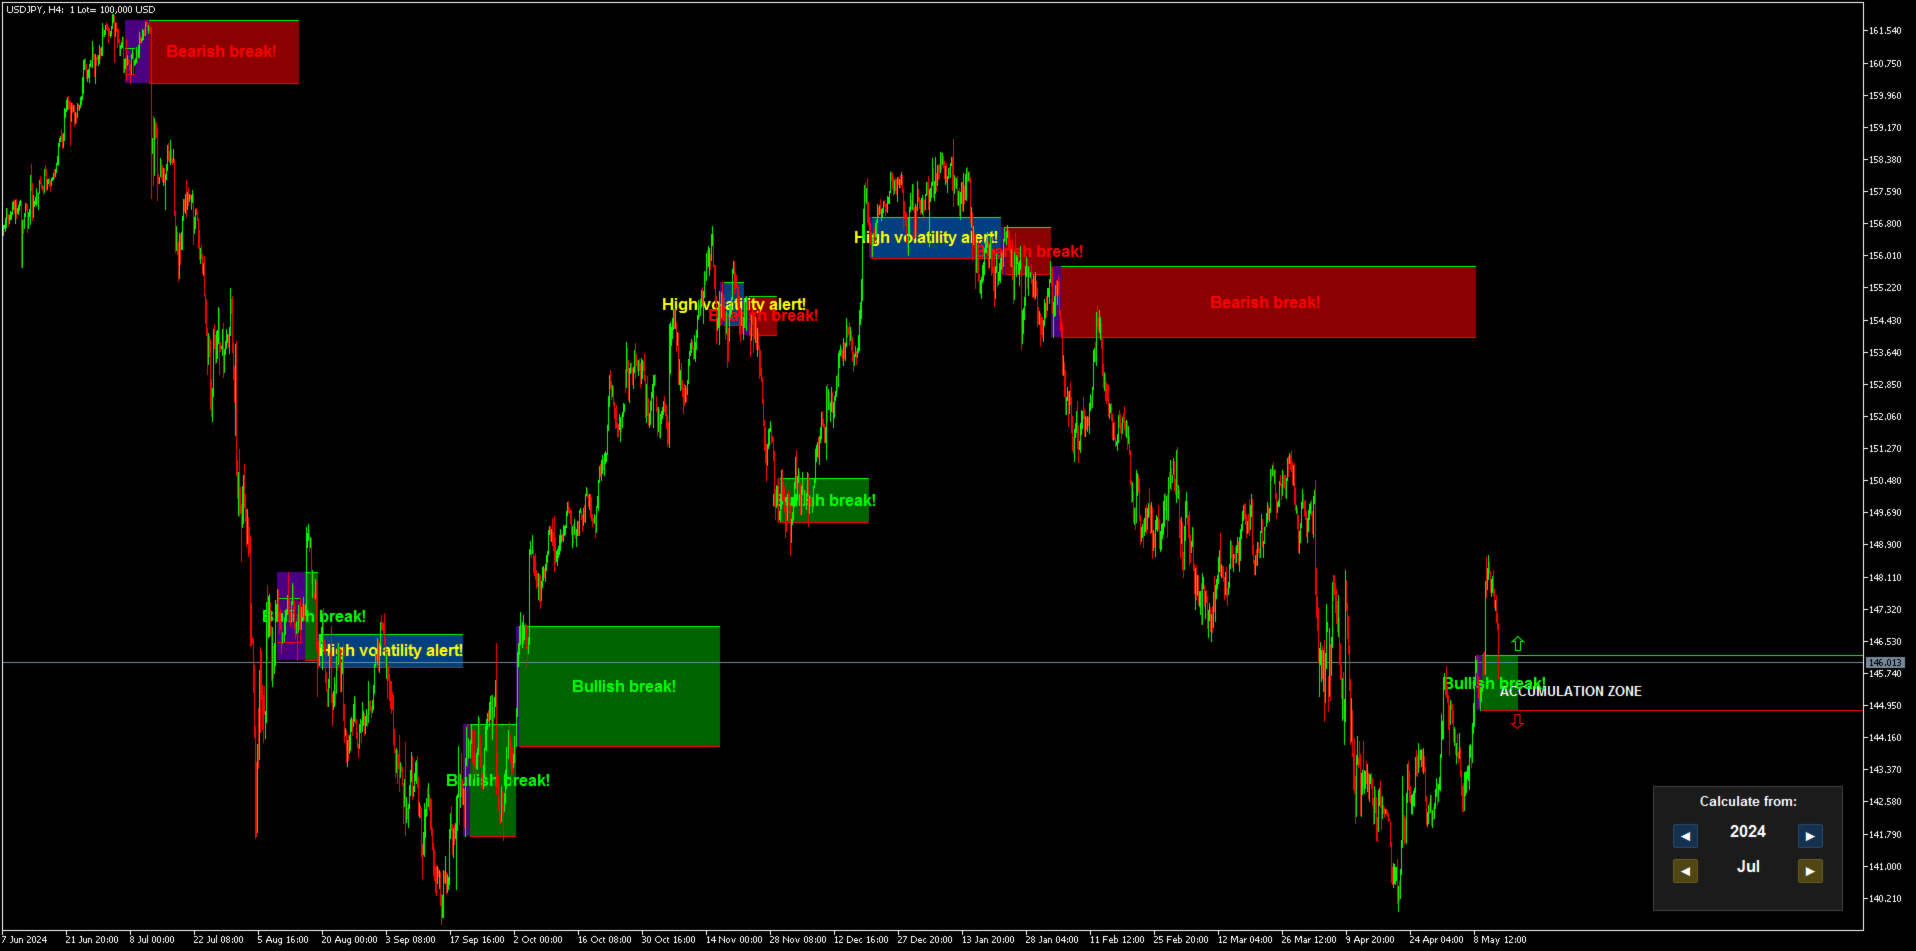
Se il mercato rompe questa zona verso l’alto, il trend è rialzista e la zona di accumulo diventa verde; se la rompe verso il basso, il trend è ribassista e la zona diventa rossa.

Una candela che chiude completamente al di fuori della zona senza toccarne il bordo è considerata un vero breakout.

Quando una candela si forma completamente al di fuori di una zona di accumulo degli ordini, segnala un breakout e mostra la direzione del mercato. Questo definisce il trend. Il trend rimane valido finché non avviene un breakout nella direzione opposta o finché non appare una nuova zona di interesse sul mercato.

Puoi fare trading “da zona a zona”.

Esempio 1: Quando avviene un breakout della zona di accumulo, apri ordini nella direzione del mercato.

Esempio 2: Sul grafico a 4 ore avviene un breakout rialzista e il mercato sale. Dopo un po’ appare una zona a 1 ora. Puoi chiudere la posizione e aspettare che la zona a 1 ora ti dia una nuova direzione.

Esempio 3: Se ti trovi dentro una zona puoi vendere dall’alto o comprare dal basso finché la zona non viene rotta. È un trading in range, ma più rischioso. Non fare mai trading contro l’indicatore. Mai.

Se una zona viene rotta da entrambi i lati, ricevi un segnale High Volatility Alert.

Queste sono le tracce del denaro. E tutto questo non può essere visto a occhio nudo perché abbiamo il tick volume, che è il più grande fraintendimento. È per questo che serve l’indicatore di velocità di transazione, che converte il tick volume in attività di mercato. È uno strumento molto serio progettato per esigenze di analisi avanzata.

Le zone vengono create su ogni timeframe. La zona valida è l’ultima in cui il mercato sta attualmente operando. Per essere considerata valida, una zona non deve sovrapporsi ad altre zone.

Raccomandazioni:

Coppie valutarie: solo strumenti con grande tick volume EUR/USD, USD/JPY, GBP/USD ecc. Timeframe: tutti. Deposito minimo: nessuno. Tipo di conto: nessuna limitazione. Broker: nessuna limitazione. Preferibili broker grandi per via del volume maggiore.

Scienza pura.

Supporto completo, guida alla configurazione e materiali bonus disponibili dopo l’acquisto.

Prima di acquistare: Questo prodotto può essere testato direttamente nel MetaTrader Strategy Tester. Consiglio vivamente di esplorare come si comporta con i tuoi strumenti, timeframe e condizioni di mercato prima di prendere una decisione.

Hai domande o bisogno di chiarimenti? Se vuoi verificare l’indicatore nel trading reale, inviami un messaggio. Sono disponibile per aiutarti e fornirti una guida chiara per assicurarti di comprendere pienamente ciò che il prodotto offre.


Prodotti consigliati
Alpha Trend sign has been a very popular trading tool in our company for a long time. It can verify our trading system and clearly indicate trading signals, and the signals will not drift. Main functions: Based on the market display of active areas, indicators can be used to intuitively determine whether the current market trend belongs to a trend market or a volatile market. And enter the market according to the indicator arrows, with green arrows indicating buy and red arrows indicating se
VR Cub
Vladimir Pastushak
VR Cub è un indicatore per ottenere punti di ingresso di alta qualità. L'indicatore è stato sviluppato per facilitare i calcoli matematici e semplificare la ricerca dei punti di ingresso in una posizione. La strategia di trading per la quale è stato scritto l'indicatore ha dimostrato la sua efficacia per molti anni. La semplicità della strategia di trading è il suo grande vantaggio, che consente anche ai trader alle prime armi di commerciare con successo con essa. VR Cub calcola i punti di apert
PZ Harmonacci Patterns
PZ TRADING SLU
3.17 (6)
Trade smarter, not harder: Empower your trading with Harmonacci Patterns This is arguably the most complete harmonic price formation auto-recognition indicator you can find for the MetaTrader Platform. It detects 19 different patterns, takes fibonacci projections as seriously as you do, displays the Potential Reversal Zone (PRZ) and finds suitable stop-loss and take-profit levels. [ Installation Guide | Update Guide | Troubleshooting | FAQ | All Products  ] It detects 19 different harmonic pric
Forex Gump
Andrey Kozak
2.4 (5)
Forex Gump is a fully finished semi-automatic trading system. In the form of arrows, signals are displayed on the screen for opening and closing deals. All you need is to follow the instructions of the indicator. When the indicator shows a blue arrow, you need to open a buy order. When the indicator shows a red arrow, you need to open a sell order. Close orders when the indicator draws a yellow cross. In order to get the most effective result, we recommend using the timeframes H1, H4, D1. There
Gartley Projection D
Oleksandr Medviediev
3.71 (7)
The indicator identifies the harmonic patterns (XABCD) according to developments of H.M.Gartley ( "Profits in the Stock Market" , 1935г). It projects D-point as a point in the perspective projection (specify ProjectionD_Mode = true in the settings). Does not redraw. When a bar of the working timeframe closes, if the identified pattern point has not moved during Patterns_Fractal_Bars bars, an arrow appears on the chart (in the direction of the expected price movement). From this moment on, the ar
This is an arrow indicator without a future function,developed based on the most advanced profit trading algorithms.It has the most innovative and advanced dual trend analysis module, as well as the latest and highly effective market trend prediction algorithm.Trends are your friends, and following larger trends can earn the maximum profit in foreign exchange. This indicator helps traders identify current trends and track them. Someone once made a profit of 10 times in a week by relying on it.No
Auto Fibo Pro m
DMITRII GRIDASOV
Indicatore "Auto FIBO Pro" Crypto_Forex: è un ottimo strumento ausiliario nel trading! - L'indicatore calcola e posiziona automaticamente sul grafico i livelli di Fibo e le linee di tendenza locali (colore rosso). - I livelli di Fibonacci indicano le aree chiave in cui il prezzo può invertirsi. - I livelli più importanti sono 23,6%, 38,2%, 50% e 61,8%. - Puoi usarlo per lo scalping di inversione o per il trading di zone grid. - Ci sono molte opportunità per migliorare il tuo sistema attuale usa
Overview Harmonic Patterns MT4 is a technical analysis indicator designed for the MetaTrader 5 platform. It identifies and displays harmonic price patterns, such as Butterfly, Cypher, Crab, Bat, Shark, and Gartley, in both bullish and bearish directions. The indicator calculates key price levels, including entry, stop loss, and three take-profit levels, to assist traders in analyzing market movements. Visual elements and customizable alerts enhance usability on the chart. Features Detects six ha
The   RSI Divergence + FVG Signal   indicator combines   Relative Strength Index (RSI) Divergence   with   Fair Value Gap (FVG)   detection to generate high-probability buy and sell signals based on both momentum shifts and institutional imbalance zones. Core Features: RSI Divergence Detection : Identifies both regular and hidden bullish/bearish divergences between price and RSI. Divergences indicate potential trend reversals or continuation. FVG Zone Recognition : Detects Fair Value Gaps (imbal
Noize Absorption Index MT4
Ekaterina Saltykova
5 (1)
Noize Absorption Index - is the manual trading system that measures the difference of pressure between bears forces and bulls forces. Green line - is a noize free index that showing curent situation. Zero value of index shows totally choppy/flat market.Values above zero level shows how powerfull bullish wave is and values below zero measures bearish forces.Up arrow appears on bearish market when it's ready to reverse, dn arrow appears on weak bullish market, as a result of reverse expectation. S
PABT Pattern Indicator - it's classical system one of the signal patterns. Indicator logic - the Hi & Lo of the bar is fully within the range of the preceding bar, look to trade them as pullback in trend. In the way if indicator found PABT pattern it's drawing two lines and arrow what showing trend way.  - First line - it's entry point and drawing at: 1. On the high of signal bar or on middle of the signal bar (depending from indicator mode) for buy; 2. On the low of signal bar or on middle of t
Trendiness Index
Libertas LLC
5 (3)
"The trend is your friend" is one of the best known sayings in investing, because capturing large trendy price movements can be extremely profitable. However, trading with the trend is often easier said than done, because many indicators are based on price reversals not trends. These aren't very effective at identifying trendy periods, or predicting whether trends will continue. We developed the Trendiness Index to help address this problem by indicating the strength and direction of price trend
"Impulses and Corrections 4" is created to help traders navigate the market situation. The indicator shows multi-time frame upward and downward "Impulses" of price movements. These impulses are the basis for determining the "Base" , which is composed of zones of corrections of price movements, as well as "Potential" zones for possible scenarios of price movement. Up and down impulses are determined based on a modified formula of Bill Williams' "Fractals" indicator. The last impulse is always "U
The indicator provides a superior alternative to price action analysis. It enables the identification of normalized patterns, which are then transformed into a graphical representation to forecast future steps within a time series. In the top-left corner, you'll find information regarding the expected prediction accuracy, determined through a complex MSQE calculation. You have the flexibility to adjust the time window, making it easy to validate the indicator's performance. Additionally, you can
Trade with Gann on your side!! MASTER CIRCLE 360 CIRCLE CHART, originally created by Gann admitted that this is “The Mother of all charts”. It is one of the last studies that this great trader left for us. The numeric tab le is apparently quite simple like all the tables and is based on square numbers, the SQUARE OF 12 and is by evolution, one of the most important square numbers. Here we can find CYCLE, PRICE AND TIME thanks to angles and grades, to show past and future support and resistance.
Quantum Falcon Signal Free is a smart visual trading indicator for MetaTrader 4 designed for Forex and Gold traders. The indicator combines: • Trend analysis • RSI momentum confirmation • MACD momentum filtering • ATR volatility filtering • Higher timeframe confirmation • Smart exit signal detection Main Features: • Smart Buy and Sell signals • Exit Buy / Exit Sell alerts • Real-time dashboard on chart • Professional candle arrows • Multi-timeframe trend confirmation • ATR market volatility filt
FREE
The Th3Eng PipFinite indicator is based on a very excellent analysis of the right trend direction with perfect custom algorithms. It show the true direction and the best point to start trading. With StopLoss point and Three Take Profit points. Also it show the right pivot of the price and small points to order to replace the dynamic support and resistance channel, Which surrounds the price. And Finally it draws a very helpful Box on the left side on the chart includes (take profits and Stop loss
Trend Ray
Andriy Sydoruk
The indicator shows the potential trend direction by cyclical-wave dependence. Thus, all the rays of the intersection will be optimal rays, in the direction of which the price is expected to move, taking into account the indicator period. Rays can be used as a direction for potential market movement. But we must not forget that the approach must be comprehensive, the indicator signals require additional information to enter the market.
[ZhiBiCCI] indicators are suitable for all cycle use, and are also suitable for all market varieties. [ZhiBiCCI] Green solid line is a reversal of bullish divergence. The green dotted line is a classic bullish divergence. [ZhiBiCCI] The solid line to the red is a reverse bearish divergence. The red dotted line is a classical bearish divergence. [ZhiBiCCI] can be set in the parameters (Alert, Send mail, Send notification), set to (true) to send instant signals to the alarm window, email, insta
Antabod Gamechanger
Rev Anthony Olusegun Aboderin
*Antabod GameChanger Indicator – Transform Your Trading!*   Are you tired of chasing trends too late or second-guessing your trades? The *Antabod GameChanger Indicator* is here to *revolutionize your trading strategy* and give you the edge you need in the markets!   Why Choose GameChanger? *Accurate Trend Detection* – GameChanger identifies trend reversals with *pinpoint accuracy*, ensuring you enter and exit trades at the optimal time.   *Clear Buy & Sell Signals* – No more guesswork! T
The indicator detects and displays М. Gartley's Butterfly pattern. The pattern is plotted by the extreme values of the ZigZag indicator (included in the resources, no need to install). After detecting the pattern, the indicator notifies of that by the pop-up window, a mobile notification and an email. The pattern and wave parameters are displayed on the screenshots. The default parameters are used for demonstration purposes only in order to increase the amount of detected patterns. Parameters z
Daily Candle Predictor è un indicatore che prevede il prezzo di chiusura di una candela. L'indicatore è destinato principalmente all'uso sui grafici D1. Questo indicatore è adatto sia per il trading forex tradizionale che per il trading di opzioni binarie. L'indicatore può essere utilizzato come sistema di trading autonomo o può fungere da aggiunta al sistema di trading esistente. Questo indicatore analizza la candela corrente, calcolando alcuni fattori di forza all'interno del corpo della cande
Color Stochastic Enhanced Stochastic Oscillator with Cross Detection and Visual Signal Support Overview Color Stochastic is a customized version of the classic Stochastic Oscillator designed for momentum analysis and crossover visualization. The indicator provides color-based signal marking and configurable crossover detection at user-defined overbought and oversold levels. It can be used as part of: Momentum analysis Mean reversion workflows DCA-based strategies Multi-indicator confirmation sys
The main idea of this indicator is rates analysis and prediction by Fourier transform. Indicator decomposes exchange rates into main harmonics and calculates their product in future. You may use the indicator as a standalone product, but for better prediction accuracy there is another related indicator - FreqoMaster - which uses FreqoMeterForecast as a backend engine and combines several instances of FreqoMeterForecast for different frequency bands. Parameters: iPeriod - number of bars in the ma
QuantumEdge Trader
Hossam Ali Ahmed Ali
QuantumEdge Trader v1.0 AI-Powered Precision Signals for Serious Traders QuantumEdge Trader is a smart and reliable indicator that delivers accurate BUY and SELL signals using advanced market analysis and trend detection. Designed for M1 to M60 timeframes, it's ideal for scalping and intraday strategies. --- Key Features: No Repaint – Signals never change after appearing Smart trend filters to reduce noise Adjustable sensitivity and alerts Perfect for XAUUSD, EURUSD, and m
L'indicatore SMC Venom Model BPR è uno strumento professionale per i trader che operano nell'ambito del concetto di Smart Money (SMC). Identifica automaticamente due modelli chiave sul grafico dei prezzi: FVG   (Fair Value Gap) è una combinazione di tre candele, in cui c'è un gap tra la prima e la terza candela. Forma una zona tra livelli in cui non c'è supporto di volume, il che spesso porta a una correzione dei prezzi. BPR   (Balanced Price Range) è una combinazione di due modelli FVG che for
Potential Reversal Price (PRP) Indicator - Ultimate Sniper Entries for XAUUSD Discounted   Price   !!     Secure your lifetime access   now   before it switches to   subscription-only ! Welcome to the   Potential Reversal Price (PRP) Indicator , your ultimate trading tool designed to catch high-probability market reversals with extreme precision. Built for serious traders who demand accuracy, the PRP Indicator combines advanced market structure analysis with momentum exhaustion to pinpoint the e
Chart Patterns Detect 15 patterns (Ascending Triangle, Descending Triangle, Rising Wedge, Falling Wedge, Bullish Flag, Bearish Flag, Bullish Rectangle, Bearish Rectangle Symmetrical triangle, Head and Shoulders, Inverted Head and Shoulders, Triple top, Triple Bottom, Double Top, Double Bottom) Use historical data to calculate the probability of each pattern to succeed (possibility to filter notification according to the chance of success) gives graphic indication about the invalidation level and
Price Magnet — Price Density and Attraction Levels Indicator Price Magnet is a professional analytical tool designed to identify key support and resistance levels based on statistical Price Density. The indicator analyzes a specified historical period and detects price levels where the market spent the most time. These zones act as “magnets,” attracting price action or forming a structural base for potential reversals. Unlike traditional Volume Profile tools, Price Magnet focuses on price-time d
RSI Speed mp
DMITRII GRIDASOV
Indicatore Crypto_Forex "RSI SPEED" per MT4 - ottimo strumento predittivo, senza bisogno di ridisegnare. - Il calcolo di questo indicatore si basa su equazioni fisiche. L'RSI SPEED è la derivata prima dell'RSI stesso. - L'RSI SPEED è ottimo per scalping di ingresso nella direzione del trend principale. - Usalo in combinazione con un indicatore di trend appropriato, ad esempio HTF MA (come nelle immagini). - L'indicatore RSI SPEED mostra la velocità con cui l'RSI cambia direzione: è molto sensi
Gli utenti di questo prodotto hanno anche acquistato
Indicatore Miraculous – Strumento Forex e Binario 100% Non-Repaint Basato sul Quadrato di Nove di Gann Questo video presenta l' Indicatore Miraculous , uno strumento di trading altamente accurato e potente, sviluppato specificamente per i trader di Forex e Opzioni Binarie . Ciò che rende unico questo indicatore è la sua base sul leggendario Quadrato di Nove di Gann e sulla Legge della Vibrazione di Gann , rendendolo uno degli strumenti di previsione più precisi disponibili nel trading moderno. L
Breakout Arrows Mt4
Michael Oko Oboh
5 (1)
Trend Breakout Arrows Indicator The Trend Breakout Arrows Indicator is a momentum-based signal tool designed to identify potential bullish and bearish breakout opportunities. It displays clear arrow signals directly on the price chart, helping traders quickly recognize possible trend changes and continuation setups. Up Arrow (Buy Signal) A magenta up arrow appears below a candle when bullish momentum begins to strengthen. This signal indicates that buying pressure may be overtaking selling press
TRADING STRATEGY GUIDE DELIVERY The full Trading Strategy Guide will be sent directly to you after purchase. Just message me on MQL5 and ask for it — you'll receive it instantly, along with priority support and setup help. Powered Market Scanner for Smart Trading Decisions Keypad Support & Resistance is a next-generation MT4 trading system built for serious traders who demand precision, reliability, and clarity. It combines advanced smart filters with real-time price structure logic to genera
KuKl
IGOR KIRIANEN
The indicator is built on a non-standard Zig Zag, it draws accumulations after which if the price leaves this zone and a test of this zone occurs, then a sound signal is given and an arrow appears - after the test candle closes.The indicator does not redraw its signals, it is very easy to use, there are only three settings 1- this is the zig zag parameter 2- this is the minimum price exit from the zone 3- this is the maximum price exit from the zone. The lower the parameter for Zig Zag, the more
WanaScalper MT4
Isaac Wanasolo
1 (1)
A scalping indicator based on mathematical patterns, which on average gives signals with relatively small SL, and also occasionally helps to catch big moves in the markets (more information in the video) This indicator has three main types of notifications: The first type warns of a possible/upcoming signal on the next bar The second type indicates the presence of a ready signal to enter the market/open a position The third type is for SL and TP levels - you will be notified every time price re
CountSig
Yin Zhou Luo
一款信号统计指标(MT4)——实现基于当前图表周期下的单线MA转向和双线MA金叉/死叉统计 . 转向定义:前一K向下或走平,当前K向上,视为转向向上;反之,转向向下。 金死叉定义:前一K快线在慢线下方,当前K快线在慢线上方,为金叉;反之,死叉。 参数及使用说明: 1、可指定统计K线数。 2、可指定4个不同的日内时间段,格式如"03:00-07:59",4个时间段可交叉任意输入。 3、可配置ABC三个浮盈区间段点值。如:分界区间统计小点值设为500,即当某转向信 号出现后到下一反向信号止浮盈<=此点值,计入A区间; 若大于此点值<大分界点值时,计入B区间;若大于“大分界点值”计入C区间。 4、最大/最小浮盈统计。显示所有统计区间内的最大浮盈点值和最小浮盈点值(亏损点值)。 5、输出完整信号,按信号出现顺序排列,如“ACCBCA”之类。 6、综合预测。使用概率、周期、趋势、马尔可夫链等综合概算输出预测该信号出现的归类概率值。 7、加载指定MA线。在当前图表自动载入相应设置的MA线。 8、自适应列宽。以完整显示统计信号数。 9、用法:点击相应统计按钮即输出相应的统计表格.
Fxland Price Reversal Zones (MT4) FXLAND Smart Reversal Indicator is a professional technical analysis tool designed to help traders identify potential price reversal zones and key market turning points with clarity and precision. The best reversal indicator and price return by choosing only one ceiling or floor in each time frame A masterpiece of combining mathematics and Gann, fractal matrix, Fibonacci, movement angle and time. Completely intelligent Key Features Detects potential pr
The Hurricane Indicator
Paul Nicholas Clevett
5 (1)
Currently switched to the 4 hour chart - but use other time frames for confirmation. :-)  I change my main time frame based on the market movement at the time. The Hurricane Forex Indicator is a multi time frame indicator that includes such things as Trade Notifications, Trade Calculator, Momentum Indicator, risk reward and much more. We have a free Trade room for our users as well. Please check out the video for full details of how this indicator works as it has over 15 years worth of developme
VTrende Pro mt4
Andrii Diachenko
3 (2)
VTrende Pro MT4 - MTF indicator for trend trading with a display panel for MT5 *** Videos can be translated into any language using subtitles (video language - Russian) Although the signals of the VTrende Pro indicator can be used as signals of a full-fledged trading system, it is recommended to use them in conjunction with the Bill Williams TS. VTrende Pro  MT4 is an extended version of the VTrende indicator. Difference between Pro version and VTrende: - Time zones - Signal V - signal 1-2 wave
FFx Engulfing Setup Alerter gives trade suggestions with Entry, Target 1, Target 2 and StopLoss. Below are the different options available: Entry suggestion - pips to be added over the break for the entry 3 different options to calculate the SL - by pips, by ATR multiplier or at the pattern High/Low 3 different options to calculate the 2 TPs - by pips, by ATR multiplier or at Risk/Reward Offset the dashboard - any place on the chart Remove the suggestion once the price reached the SL line Lines
FFx InsideBar Setup Alerter gives trade suggestions with Entry, Target 1, Target 2 and StopLoss. Below are the different options available: Entry suggestion - pips to be added over the break for the entry Minimum candle size - to avoid too close buy/sell entry suggestions 3 different options to calculate the SL - by pips, by ATR multiplier or at the pattern High/Low 3 different options to calculate the 2 TPs - by pips, by ATR multiplier or at Risk/Reward Offset the dashboard - any place on the c
FFx OutsideBar Setup Alerter gives trade suggestions with Entry, Target 1, Target 2 and StopLoss. Below are the different options available: Entry suggestion - pips to be added over the break for the entry. 3 different options to calculate the SL - by pips, by ATR multiplier or at the pattern High/Low. 3 different options to calculate the 2 TPs - by pips, by ATR multiplier or at Risk/Reward. Offset the dashboard - any place on the chart. Remove the suggestion once the price reached the SL line.
FFx PinBar Setup Alerter gives trade suggestions with Entry, Target 1, Target 2 and StopLoss. Below are the different options available: Entry suggestion - pips to be added over the break for the entry Minimum candle size - to avoid too small candles 3 different options to calculate the SL - by pips, by ATR multiplier or at the pattern High/Low 3 different options to calculate the 2 TPs - by pips, by ATR multiplier or at Risk/Reward Offset the dashboard - any place on the chart Remove the sugges
Automatic, live & interactive picture of all trendlines. Assign push, email and sound alerts to the lines of your choice and be informed about price rollback, breakout, rollback after breakout, number of rollbacks, line expiration by double breakout. Correct, drag or delete the lines and interactively tune the line system. https://youtu.be/EJUo9pYiHFA . Chart examples https: //www.mql5.com/en/users/efficientforex Price Interaction Events All events are effective immediately and only after one
The purpose of this new version of the MT4 standard indicator provided in your platform is to display in a sub-window multiple timeframes of the same indicator with its divergences. See the example shown in the picture below. But the display isn't like a simple MTF indicator. This is the real display of the indicator on its timeframe. Here's the options available in the FFx divergences indicator: Select the timeframes to be displayed (M1 to Monthly) Define the width (number of bars) for each tim
The purpose of this new version of the MT4 standard indicator provided in your platform is to display in a sub-window multiple timeframes of the same indicator with its divergences. See the example shown in the picture below. But the display isn't like a simple MTF indicator. This is the real display of the indicator on its timeframe. Here's the options available in the FFx divergences indicator: Select the timeframes to be displayed (M1 to Monthly). Define the width (number of bars) for each ti
The FFx Dashboard MTF alerter will show you on a single chart all the timeframes (M1 to Monthly) with their own status for the indicator. 2 Alert Options: Single timeframe: each selected timeframe alert separately when a signal occurs Multi timeframes: all selected timeframes must agree for an alert to be triggered Both options have an input to select the timeframes to be used for the alert(s). How to Understand the Status: Green/Red square: histogram above/below 0 line Green square + Red bord
The FFx Dashboard MTF alerter will show you on a single chart all the timeframes (M1 to Monthly) with their own status for the indicator. 2 Alert Options: Single timeframe: each selected timeframe alert separately when a signal occurs Multi timeframes: all selected timeframes must agree for an alert to be triggered Both options have an input to select the timeframes to be used for the alert(s). How to understand the status: Green/Red square: RSI above/below 50 line Green square + Red border: R
The FFx Dashboard MTF alerter will show you on a single chart all the timeframes (M1 to Monthly) with their own status for the indicator. 2 Alert Options: Single timeframe: each selected timeframe alert separately when a signal occurs Multi timeframes: all selected timeframes must agree for an alert to be triggered Both options have an input to select the timeframes to be used for the alert(s). How to understand the status: Green/Red square: Stoch above/below 50 line Green square + Red border:
The FFx Dashboard MTF alerter will show you on a single chart all the timeframes (M1 to Monthly) with their own status for the indicator. 2 Alert Options: Single timeframe: each selected timeframe alert separately when a signal occurs Multi timeframes: all selected timeframes must agree for an alert to be triggered Both options have an input to select the timeframes to be used for the alert(s). How to understand the status: Green/Red square: Price above/below Cloud (Kumo) Green square + Red bo
The FFx Dashboard MTF alerter will show you on a single chart all the timeframes (M1 to Monthly) with their own status for the indicator. 2 Alert Options: Single timeframe: each selected timeframe alert separately when a signal occurs Multi timeframes: all selected timeframes must agree for an alert to be triggered Both options have an input to select the timeframes to be used for the alert(s). How to understand the status: Green/Red square: MA pointing Up/Down Green square + Red border: MA po
The FFx Dashboard MTF alerter will show you on a single chart all the timeframes (M1 to Monthly) with their own status for the indicator. 2 Alert Options: Single timeframe: each selected timeframe alert separately when a signal occurs. Multi timeframes: all selected timeframes must agree for an alert to be triggered. Both options have an input to select the timeframes to be used for the alert(s). How to understand the status: Green square: Price above PSAR Red square: Price below PSAR Options
The FFx Dashboard MTF alerter will show you on a single chart all the timeframes (M1 to Monthly) with their own status for the indicator. 2 Alert Options: Single timeframe: each selected timeframe alert separately when a signal occurs Multi timeframes: all selected timeframes must agree for an alert to be triggered Both options have an input to select the timeframes to be used for the alert(s). How to understand the status: Green/Red square: CCI above/below levels (ie. 100/-100) Grey square: C
The FFx Dashboard MTF alerter will show you on a single chart all the timeframes (M1 to Monthly) with their own status for the indicator. 2 Alert Options: Single timeframe: each selected timeframe alert separately when a signal occurs Multi timeframes: all selected timeframes must agree for an alert to be triggered Both options have an input to select the timeframes to be used for the alert(s). How to understand the status: Green/Red square: ADX above level Grey square: ADX below level Red bor
The FFx Dashboard MTF alerter will show you on a single chart all the timeframes (M1 to Monthly) with their own status. 2 Alert Options: Single timeframe: each selected timeframe alert separately when a signal occurs Multi timeframes: all selected timeframes must agree for an alert to be triggered Both options have an input to select the timeframes to be used for the alert(s). How to understand the status: Green/Red square: bullish/bearish candle Options available in the FFx Dashboard Alerter
The indicator of a Professional Trader is an arrow indicator for predicting the direction of price movement. I have been working on this indicator since 2014. You can use this indicator as your main indicator, use its entry signals, and use it as your only indicator to find entry points. About the product: Recommended TF [H4-D1-W1]   . The indicator predicts the direction of the next candle. Fits a variety of tools; Flexibility in settings for different instruments and intervals through the MO
The [GRAFF] III manual trading system is based on multiple MetaTrader (MT4) indicators. Together, the entire PACK of GRAFF III indicators makes an advanced trading tool. The system consists of over 20 different custom-built indicators which have been carefully selected and tested in the long term to produce strong and efficient trading signals. The particular indicators are based on different mathematical formulas, so the entire system is calibrated to remove false signals from its own indicator
Altri dall’autore
L’indicatore evidenzia le zone in cui viene dichiarato interesse sul mercato , per poi mostrare la zona di accumulo degli ordini . Funziona come un book degli ordini su larga scala . Questo è l’indicatore per i grandi capitali . Le sue prestazioni sono eccezionali. Qualsiasi interesse ci sia nel mercato, lo vedrai chiaramente . (Questa è una versione completamente riscritta e automatizzata – non è più necessaria un’analisi manuale.) La velocità di transazione è un indicatore concettualmente nuo
KAMA Confluence Engine Opera seguendo il trend — e conosci subito il tuo Entry, Stop e Target nel momento esatto in cui il mercato si gira. Il KAMA Confluence Engine è un indicatore di trend tutto‑in‑uno basato sulla Kaufman Adaptive Moving Average (KAMA), potenziato con ponderazione del volume tick, conferma multi‑timeframe e livelli di trading automatici. Si adatta al mercato: rapido e reattivo nelle fasi di trend, stabile e filtrato nelle fasi laterali — così rimani sempre dalla parte giusta
Meravith MT5
Ivan Stefanov
5 (1)
Strumento per market maker. Meravith: Analizzerà tutti i timeframe e mostrerà il trend attualmente in corso. Evidenzierà le zone di liquidità (equilibrio dei volumi) dove i volumi rialzisti e ribassisti sono uguali. Mostrerà tutti i livelli di liquidità dei diversi timeframe direttamente sul grafico. Genererà e presenterà un’analisi di mercato testuale a scopo di riferimento. Calcolerà obiettivi, livelli di supporto e punti di stop-loss in base al trend attuale. Calcolerà il rapporto rischio/ren
MACD divergency
Ivan Stefanov
4.57 (7)
Questo indicatore identifica con precisione le divergenze rialziste e ribassiste tra i movimenti di prezzo e l’istogramma MACD, utilizzando medie mobili esponenziali (EMA) con periodi di 5 (veloce) e 34 (lenta) e una linea di segnale con periodo 5. L’indicatore mette in evidenza i punti in cui il momentum si indebolisce, segnalando possibili inversioni di trend. Regole per la corretta identificazione delle divergenze La divergenza rialzista è valida quando il prezzo forma massimi crescenti e l’i
FREE
Meravith Scanner
Ivan Stefanov
5 (1)
MERAVITH SCANNER è un indicatore professionale per i mercati finanziari su MetaTrader 5, che integra più strumenti di analisi in un unico sistema. Esegue tutti i calcoli automaticamente utilizzando una metodologia proprietaria basata sul prezzo medio ponderato per il volume (VWAP), eliminando completamente l’interpretazione soggettiva. L’indicatore funziona su tutte le classi di asset (Forex, Azioni, Indici, Commodities, Criptovalute) e su tutti i timeframe, da M1 a Mensile. Il principio fondame
Enigmera
Ivan Stefanov
5 (8)
ENIGMERA: Il cuore del mercato Importante: La demo di MQL5.com funziona nel Strategy Tester e potrebbe non riflettere completamente le funzionalità di Enigmera. Consulta la descrizione, gli screenshot e il video per maggiori dettagli. Non esitare a inviarmi un messaggio se hai domande! Il codice dell'indicatore è stato completamente riscritto. La versione 3.0 aggiunge nuove funzionalità e corregge i bug accumulati dall'inizio dell'indicatore. Introduzione Questo indicatore e sistema di trading
RSI Divergence Pulse è un indicatore RSI completo che combina rilevazione di divergenze, analisi multi-timeframe e strumenti visivi in un'unica applicazione leggera. Identifica automaticamente divergenze Regolari e Nascoste, mostra un pannello RSI Multi-Timeframe in tempo reale, riempie le zone OB/OS per il riconoscimento visivo, disegna linee di divergenza sia sul grafico dei prezzi che nella sott finestra RSI, posiziona frecce Buy/Sell e fornisce avvisi in tempo reale. Features Color-Coded RS
KAMA Confluence Engine Opera seguendo il trend — e conosci subito il tuo Entry, Stop e Target nel momento esatto in cui il mercato si gira. Il KAMA Confluence Engine è un indicatore di trend tutto‑in‑uno basato sulla Kaufman Adaptive Moving Average (KAMA), potenziato con ponderazione del volume tick, conferma multi‑timeframe e livelli di trading automatici. Si adatta al mercato: rapido e reattivo nelle fasi di trend, stabile e filtrato nelle fasi laterali — così rimani sempre dalla parte giusta
FREE
Times MT5
Ivan Stefanov
TIMES aggiunge la dimensione temporale alla tua analisi. È il terzo elemento di una trinità di trading: Meravith mostra il prezzo equo, TransactionSpeed mostra il volume equo, e TIMES mostra in quale momento l’attività di mercato si concentra — rivelando se il momentum si sta costruendo o indebolendo. Cosa traccia: le zone (rettangoli) Invece di riempire il grafico con linee, TIMES condensa la sua analisi in rettangoli colorati disegnati direttamente sul grafico dei prezzi. Ogni rettangolo indi
Questo indicatore identifica con precisione le divergenze rialziste e ribassiste tra i movimenti di prezzo e l’istogramma MACD, utilizzando medie mobili esponenziali (EMA) con periodi di 5 (veloce) e 34 (lenta) e una linea di segnale con periodo 5. L’indicatore mette in evidenza i punti in cui il momentum si indebolisce, segnalando possibili inversioni di trend. Regole per la corretta identificazione delle divergenze La divergenza rialzista è valida quando il prezzo forma massimi crescenti e l’i
FREE
Meravith
Ivan Stefanov
5 (3)
Strumento per market maker. Meravith: Analizzerà tutti i timeframe e mostrerà il trend attualmente in corso. Evidenzierà le zone di liquidità (equilibrio dei volumi) dove i volumi rialzisti e ribassisti sono uguali. Mostrerà tutti i livelli di liquidità dei diversi timeframe direttamente sul grafico. Genererà e presenterà un’analisi di mercato testuale a scopo di riferimento. Calcolerà obiettivi, livelli di supporto e punti di stop-loss in base al trend attuale. Calcolerà il rapporto rischio/ren
Imbalance Pro
Ivan Stefanov
5 (4)
L'indicatore misura lo squilibrio tra tori e orsi in un periodo scelto e mostra una linea retta tra i due punti. Se i tori hanno più volume degli orsi, la linea diventa verde.  Se gli orsi hanno più volume, la linea diventa rossa. La linea mostra anche la differenza percentuale di volume. L'indicatore mostra gli stessi dati in una finestra separata. È possibile vedere anche il volume diviso. L'indicatore ha due modalità. A tale scopo, in alto a sinistra è presente un pulsante che,  - se n
Two Snakes
Ivan Stefanov
5 (1)
2 SNAKES è un sistema di scalping di prima classe. Poiché gli inserimenti sono piuttosto precisi, è probabile che diventiate dipendenti da questo sistema molto rapidamente.  Avete 2 serpenti. Quando vedete una candela al di sopra o al di sotto di esse che non le tocca, questo è il vostro segnale di scalping. Se si utilizza un time frame più ampio, lo scalping può diventare trend following. Le serpentine sono calcolate con precisione in relazione allo stato attuale del mercato. NON SONO me
Levelss
Ivan Stefanov
5 (1)
L'indicatore LEVELSS mostra: - Zona rialzista e ribassista giornaliera. È visibile tutti i giorni dalle 00:00 alle 23:59.  - La zona rialzista e ribassista settimanale. È visibile da lunedì 0:00 a venerdì 23:59 ogni settimana. - Canale appositamente calcolato da un timeframe specifico che viene visualizzato su tutti gli altri timeframe. Per impostazione predefinita, si tratta del timeframe a 4 ore, che può essere modificato in qualsiasi altro timeframe si desideri operare. Viene calcolato senz
GANN Master
Ivan Stefanov
5 (1)
Gli obiettivi precisi di GANN sono calcolati secondo i suoi metodi collaudati e presentati chiaramente davanti a te. Questo strumento è progettato per rendere il trading più fluido e intuitivo. Spostando la linea bianca verso l'alto o quella verde verso il basso, capirai subito perché le tecniche di GANN rimangono influenti nel mondo del trading. Le strategie di GANN si concentrano sulla previsione dei movimenti di mercato con grande precisione, e questo strumento porta quel potere a portata di
Sense
Ivan Stefanov
5 (2)
SENSE è un sistema automatizzato che combina metodi GANN selezionati con calcoli frattali. Il sistema ci dice dove aprire e chiudere le operazioni. Non è più necessario perdere tempo in calcoli complessi: SENSE fa tutto per voi. Basta installare l'indicatore. Principi di base: Il mercato è rialzista quando il prezzo è al di sopra delle linee bianche. Comprate sopra le linee bianche, fermatevi sotto Le linee verdi sono obiettivi al rialzo Il mercato è ribassista quando il prezzo è al di sott
Stefanov
Ivan Stefanov
The indicator displays support and resistance zones defined logically using the MACD. The entire concept is explained in the video, with specific examples shown. The indicator works on any instruments and timeframes. It does not repaint. After placing it on the chart, please go through all the timeframes sequentially, from monthly to 1-minute, so that all lines load correctly. After that, you can start using it. The concept is unique and has not been seen in other systems or indicators.
Fifty Pro
Ivan Stefanov
5 (1)
L'indicatore FIFTY è ora disponibile in una versione automatizzata, eliminando la necessità di tracciare manualmente i livelli. Questa versione disegna automaticamente i livelli giornalieri, settimanali, mensili e annuali sul grafico, garantendo precisione e risparmiando tempo. Inoltre, sono presenti pulsanti per attivare o disattivare la visibilità di questi livelli, offrendo una personalizzazione completa. Per chi lo preferisce, la versione gratuita dell'indicatore rimane disponibile e complet
Naturu MT4
Ivan Stefanov
“Naturu” è un indicatore manuale che utilizza la simmetria della natura come algoritmo. Conquista il mercato con una strategia semplice e saggezza nascosta! Quando carichi l’indicatore, vedrai due linee: Top e Bottom. Clicca una volta su una linea per attivarla. Per spostarla, basta cliccare sulla candela dove vuoi posizionarla. Definisci un punto alto e un punto basso, e l’indicatore calcola automaticamente: Una zona magenta che mostra dove gli interessi di tori e orsi sono più vicini, ossia l’
RSI Divergence Pulse — Smart Divergence Scanner with MTF Panel, Zone Fill, Alerts & Dashboard SHORT DESCRIPTION Professional RSI indicator with automatic Regular & Hidden divergence detection, color-coded RSI line, Multi-Timeframe panel, OB/OS zone fills, Buy/Sell arrows, signal labels, real-time dashboard, and multi-channel alerts. Works on any symbol and timeframe. FULL DESCRIPTION
Enigmera MT5
Ivan Stefanov
3.67 (3)
ENIGMERA: Il nucleo del mercato (Questo è un indicatore manuale e contiene funzioni che potrebbero non essere supportate dall’attuale ambiente di test di MetaTrader) Introduzione Questo indicatore e sistema di trading rappresentano un approccio unico ai mercati finanziari. ENIGMERA utilizza cicli frattali per calcolare con precisione i livelli di supporto e resistenza. Mostra la fase autentica di accumulazione e fornisce direzione e obiettivi. È un sistema che funziona sia in tendenza che in fas
Uno dei pochi indicatori che calcola i livelli esclusivamente in base al prezzo. L’indicatore non è influenzato dai timeframe, dai trend o dai cicli di mercato. Uno degli indicatori più logici mai creati. L’indicatore FIFTY è ora disponibile in una versione automatica, che elimina la necessità di tracciare manualmente i livelli. Questa versione disegna automaticamente sul grafico i livelli giornalieri, settimanali, mensili e annuali, garantendo precisione e risparmio di tempo. Inoltre, sono pres
Livelli leggendari di William Gann in un indicatore MT5 completamente automatizzato. GANN Master individua le zone chiave in cui il prezzo è più probabile che si inverta o continui il trend, basandosi sui dati Daily, Weekly e Monthly. Funzionalità principali Pulsanti a clic singolo per il periodo: clicca Daily, Weekly o Monthly per tracciare istantaneamente le zone relative al giorno, alla settimana o al mese correnti Modalità Automatica e Manuale • Automatica: GANN Master calcola tutti i livell
SPEKULATOR è un sistema di trading manuale e un indicatore che ti aiuta a identificare le zone di supporto chiave e la direzione del mercato. Padroneggia il mercato con una strategia semplice e una saggezza nascosta. Selezioni un qualsiasi TOP e BOTTOM nel grafico, e l'indicatore disegna: Una zona di supporto per il tuo trend. Per una tendenza rialzista, appare una zona verde; per una tendenza ribassista, una zona rossa. La sensibilità della zona di supporto può essere regolata nelle impostazion
Naturu
Ivan Stefanov
5 (1)
“Naturu” è un indicatore manuale che utilizza la simmetria della natura come algoritmo. Conquista il mercato con una strategia semplice e saggezza nascosta! Quando carichi l’indicatore, vedrai due linee: Top e Bottom. Clicca una volta su una linea per attivarla. Per spostarla, basta cliccare sulla candela dove vuoi posizionarla. Definisci un punto alto e un punto basso, e l’indicatore calcola automaticamente: Una zona magenta che mostra dove gli interessi di tori e orsi sono più vicini, ossia l
Oscillatore di momentum avanzato che regola automaticamente il suo periodo in base alla volatilità del mercato per segnali di ipercomprato e ipervenduto più accurati. Come Funziona: L'indicatore utilizza un calcolo del periodo adattivo che si riduce durante l'alta volatilità e si allunga durante la bassa volatilità. Questa regolazione dinamica fornisce segnali più rapidi quando il mercato è in trend e riduce i falsi segnali durante le fasi di lateralità. Il valore RSI viene calcolato sulla base
Filtro:
Nessuna recensione
Rispondi alla recensione