WanaScalper MT4
- Indicatori
- Versione: 1.0
- Attivazioni: 5

A scalping indicator based on mathematical patterns, which on average gives signals with relatively small SL, and also occasionally helps to catch big moves in the markets (more information in the video)
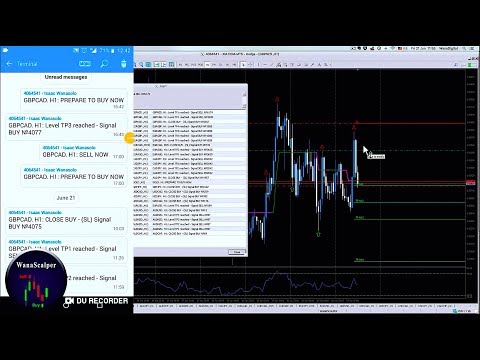
This indicator has three main types of notifications:
- The first type warns of a possible/upcoming signal on the next bar
- The second type indicates the presence of a ready signal to enter the market/open a position
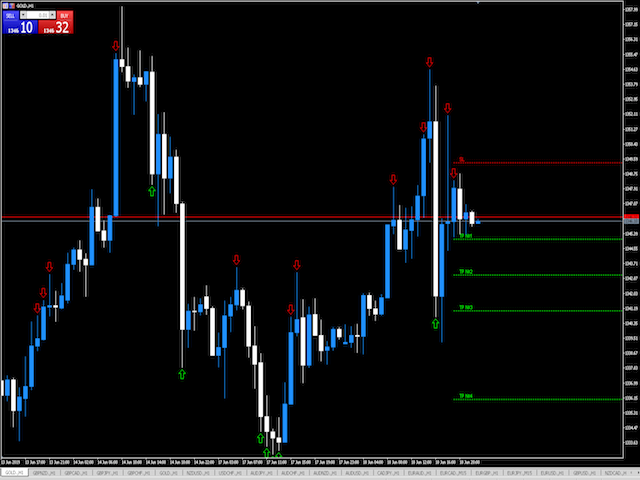
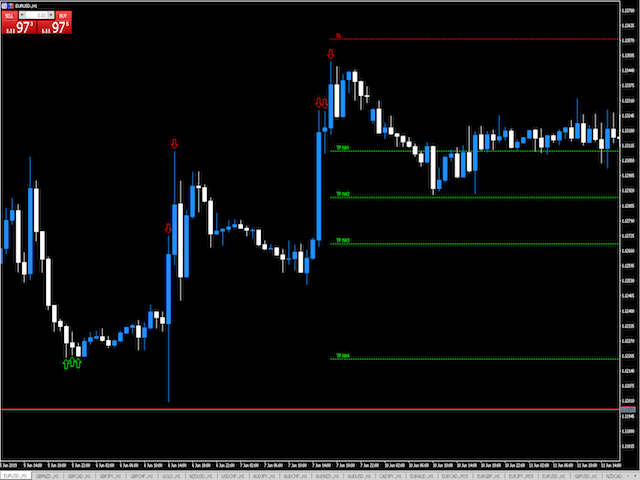
- The third type is for SL and TP levels - you will be notified every time price reaches a SL level or TP level
IMPORTANT!!! It is recommended to always check the news to avoid unpredictable market movements!
NOTE: It is recommended to allow a maximum of two consecutive losses during high volatility.
It is recommended to trade:
- the following pairs: GBPCHF, GBPNZD, GBPJPY, GBPCAD, EURNZD, EURCHF, NZDUSD, AUDJPY, AUDCHF, AUDNZD, AUDUSD, CADJPY, EURAUD, EURCAD, EURGBP, EURJPY, EURUSD, NZDCAD, NZDJPY, USDCAD, USDJPY, CADCHF, XAUUSD and USOIL
- on these timeframes: M15 and H1
- On Gold/XAUUSD, you must change the value for the "Changes" parameter from 700 to 950 to reduce the number of false signals during strong momentum moves.
Input parameters:
- Changes - the number of points
- Arrows - use or not use signal arrows
- Arrow Size - Change size of signal arrows
- Color for buy - the colour of buy signal arrows
- Color for sell - the colour of sell signal arrows
- Alerts - use or not use signal and warning alerts
- Pus - use or not use alarm and warning push notifications
- Levels SL and TP - use or not use visual trade levels for stop loss and take profit
- SL + ... - change stop loss value in points
- TP1 - take profit 1 value in points
- TP2 - take profit 2 value in points
- TP3 - take profit 3 value in points
- TP4 - take profit 4 value in points
- Line Style SL and TP - Solid, Dash, Dot, Dashdot, Dashdotdot, change line style for stop loss and take profit lines
- SL and TP Lines thickness - change the thickness of stop loss and take profit lines
- Font type - change the font type of text
- Font size - change the font size of text
- Color for SL - change the colour for trade level stop loss
- Color for TP - change the colour for trade level take profit
Version for MT5: https://www.mql5.com/en/market/product/39726

Not an accurate tool in the least. Sends several signals that take you to SL before a signal that only takes you to TP 1. Not even a 40% win ratio. Save your money. This is not a good investment.