Transaction Speed MT4

Aqui está a tradução para o português, sem comentários adicionais:

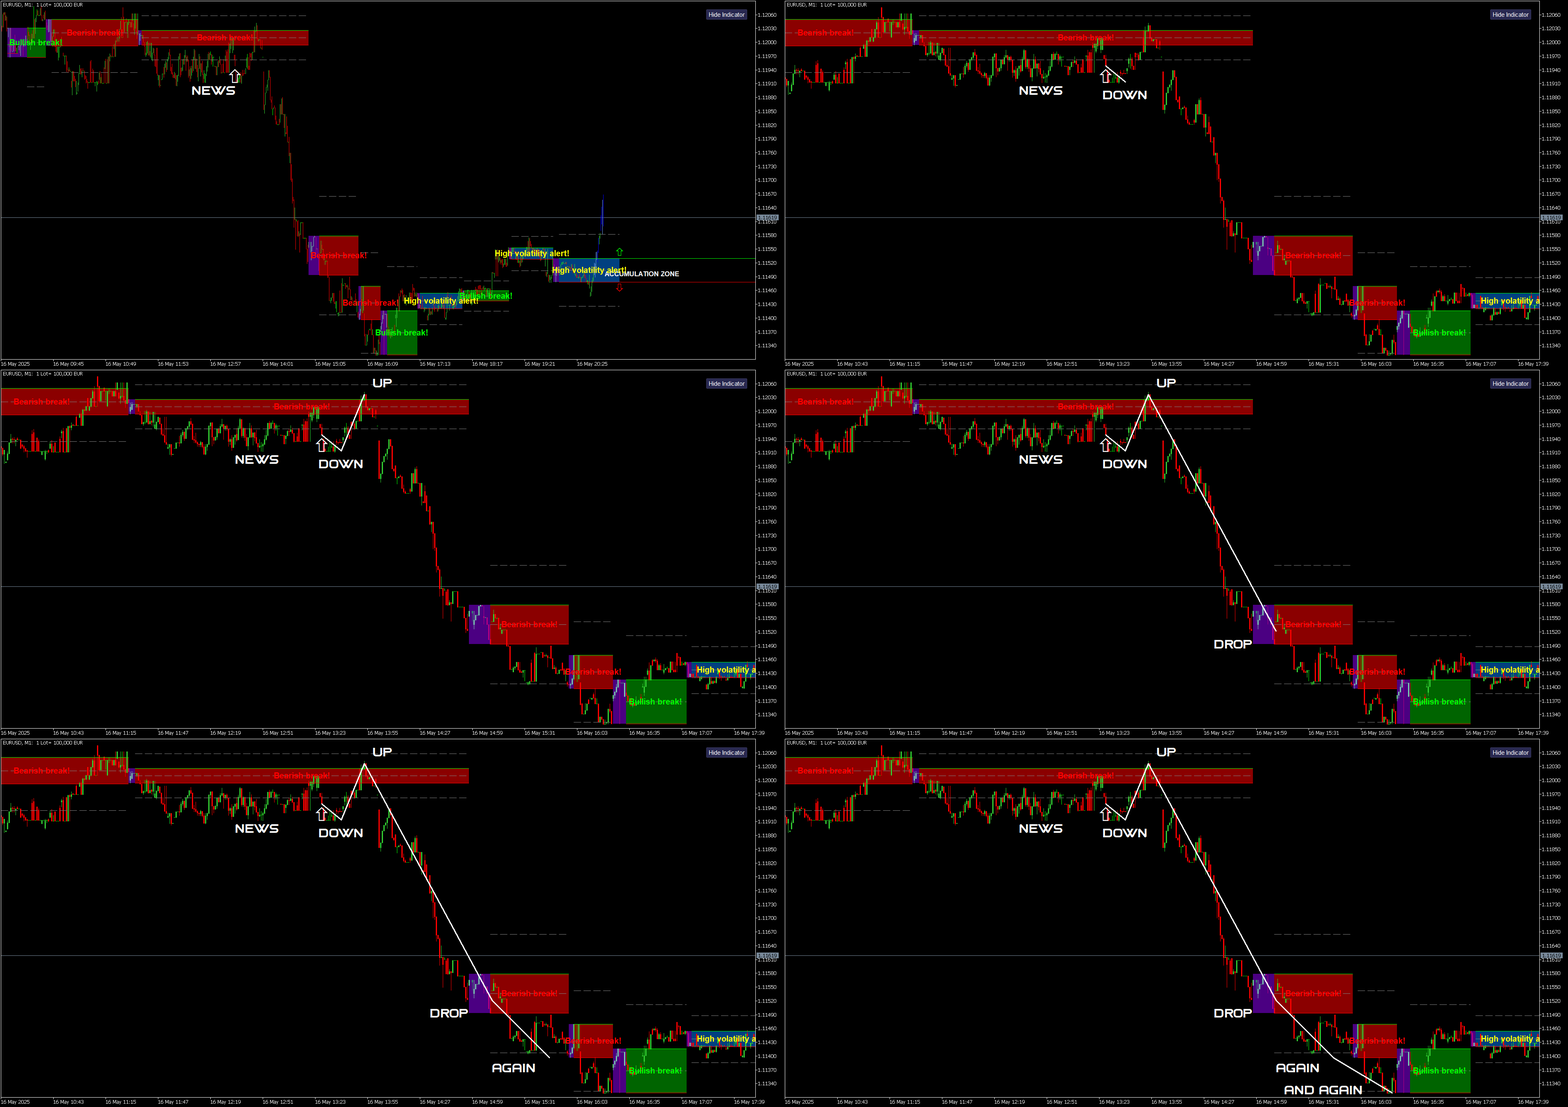
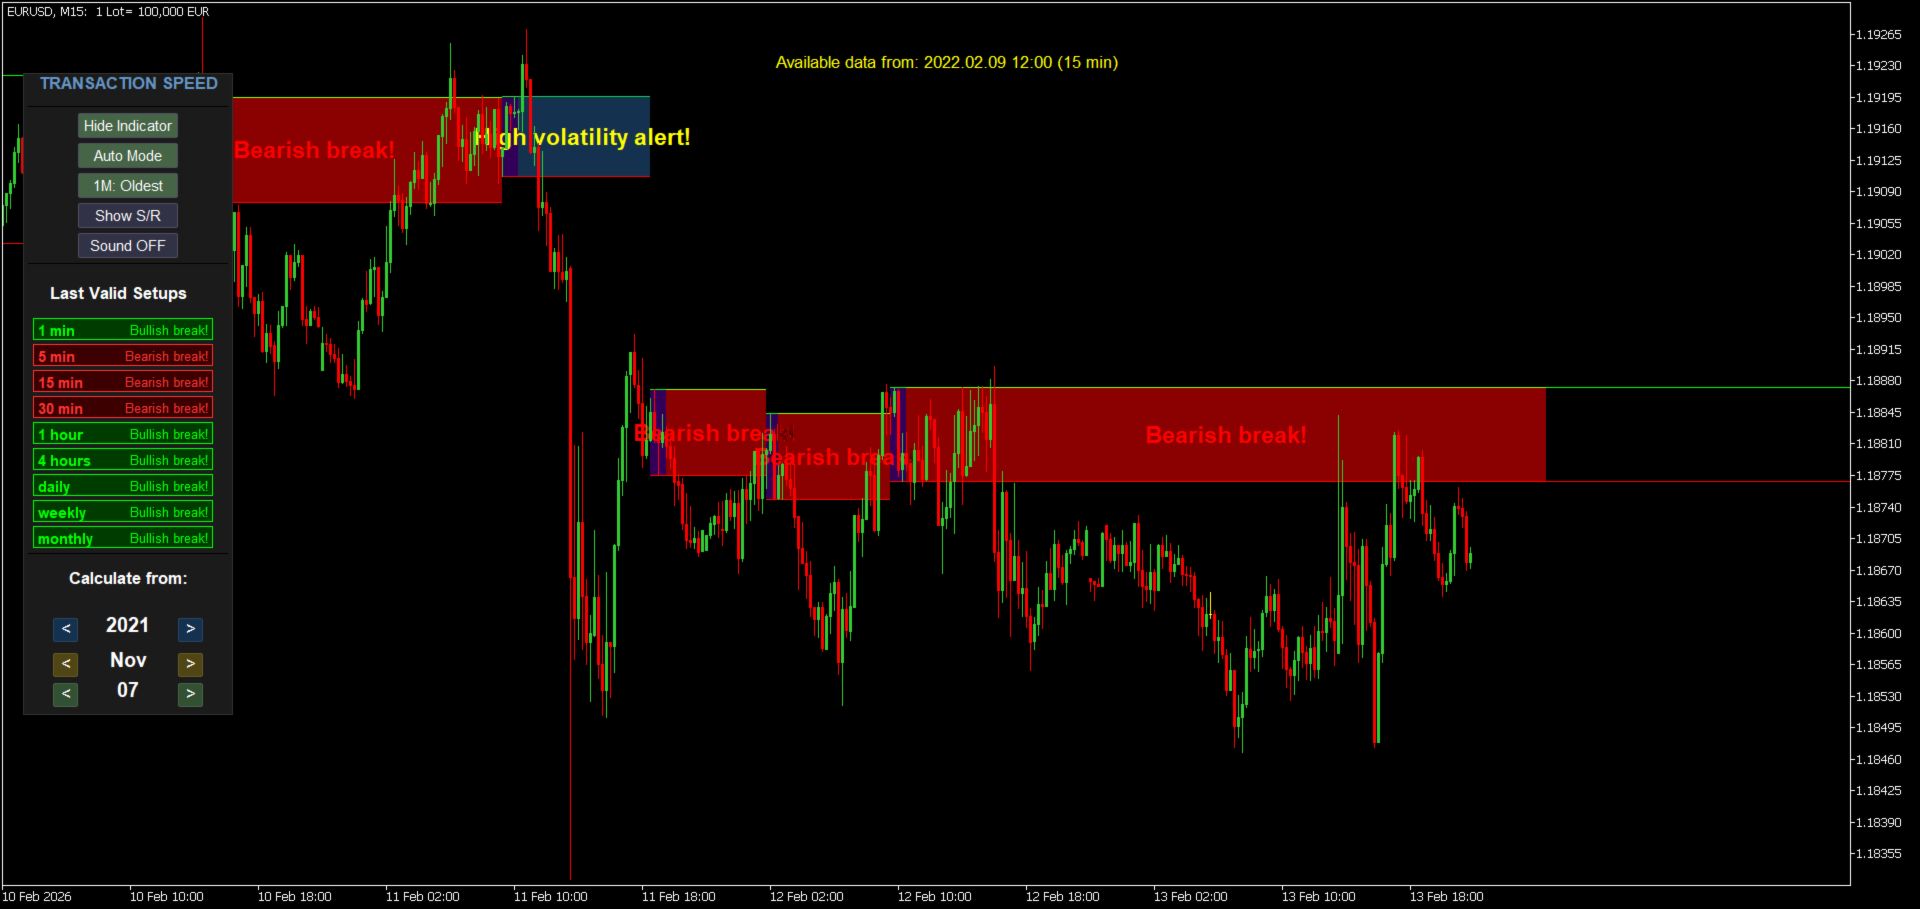
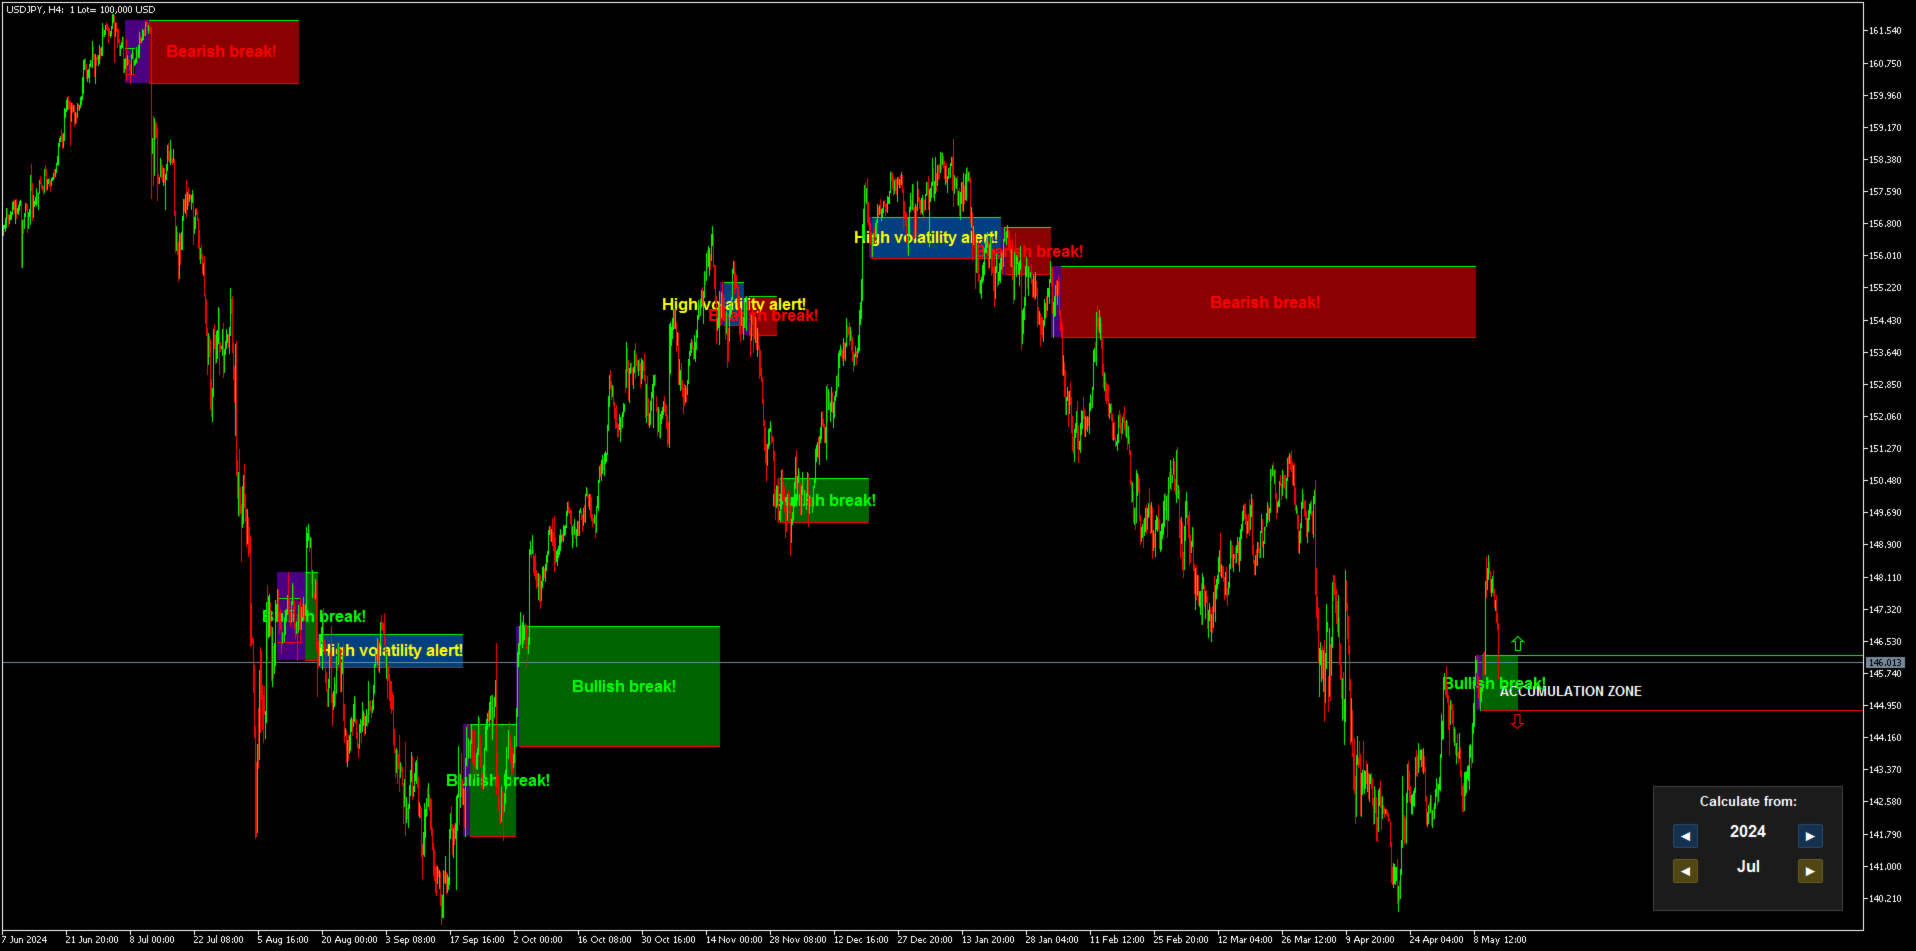
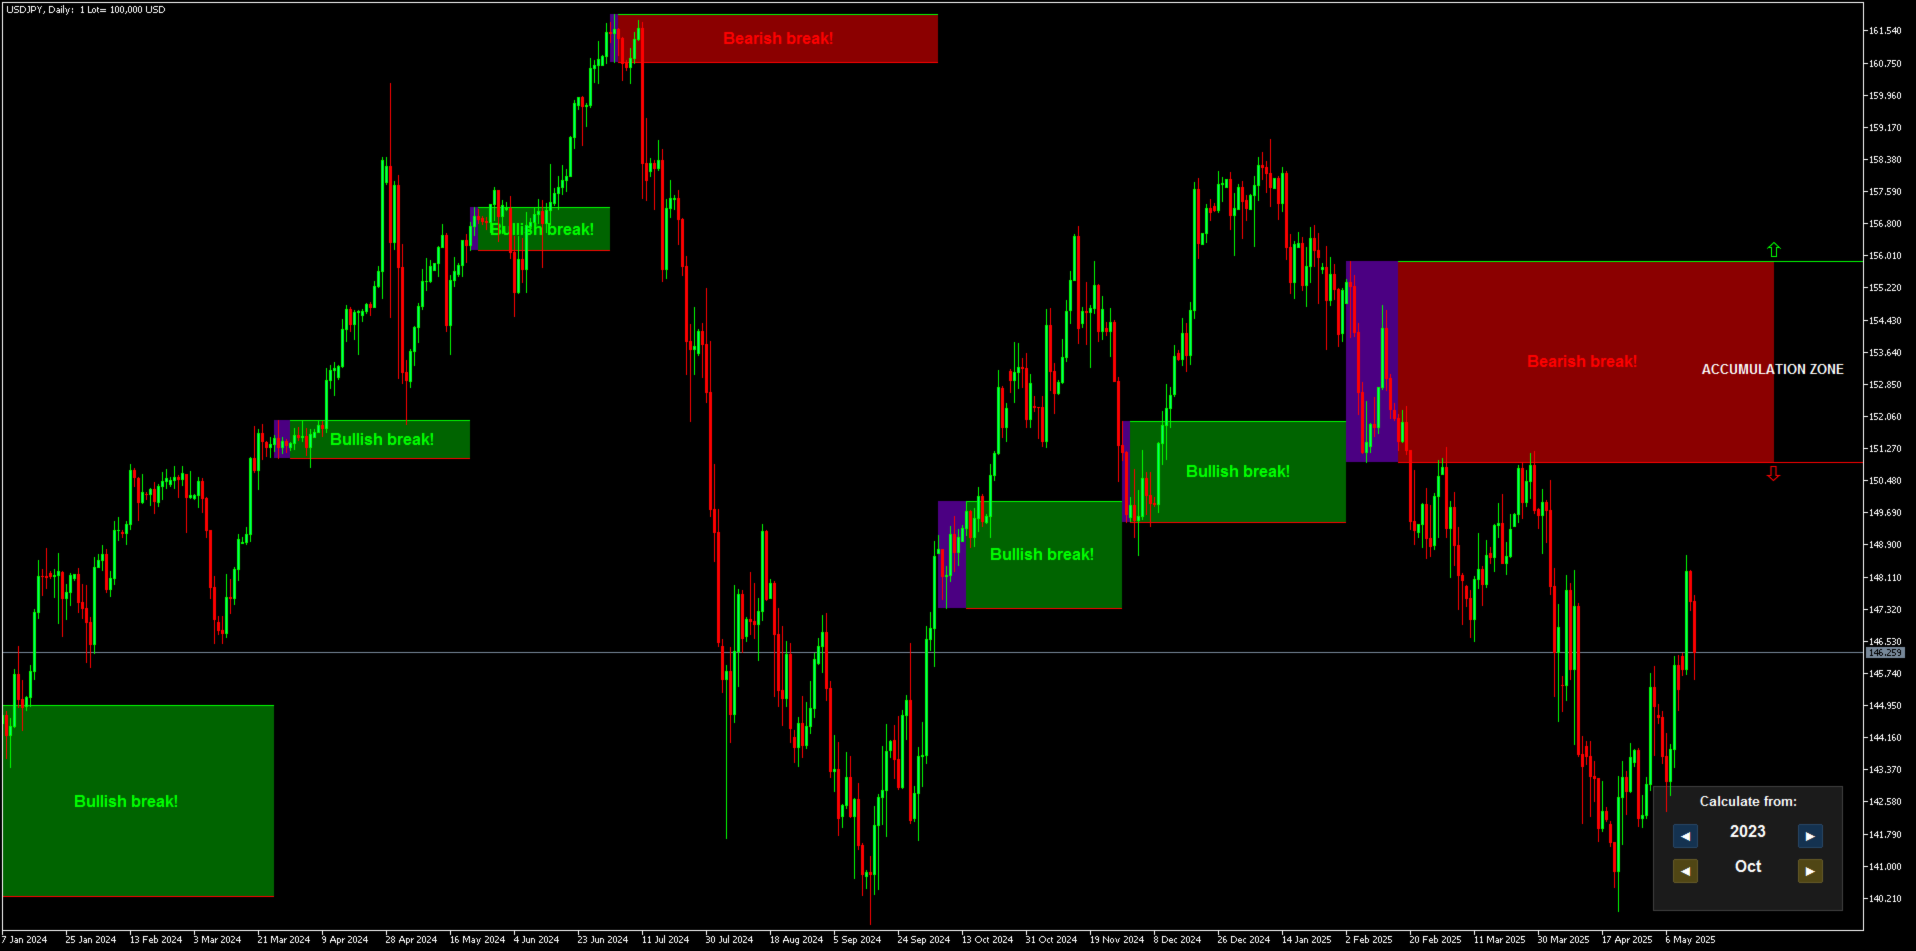
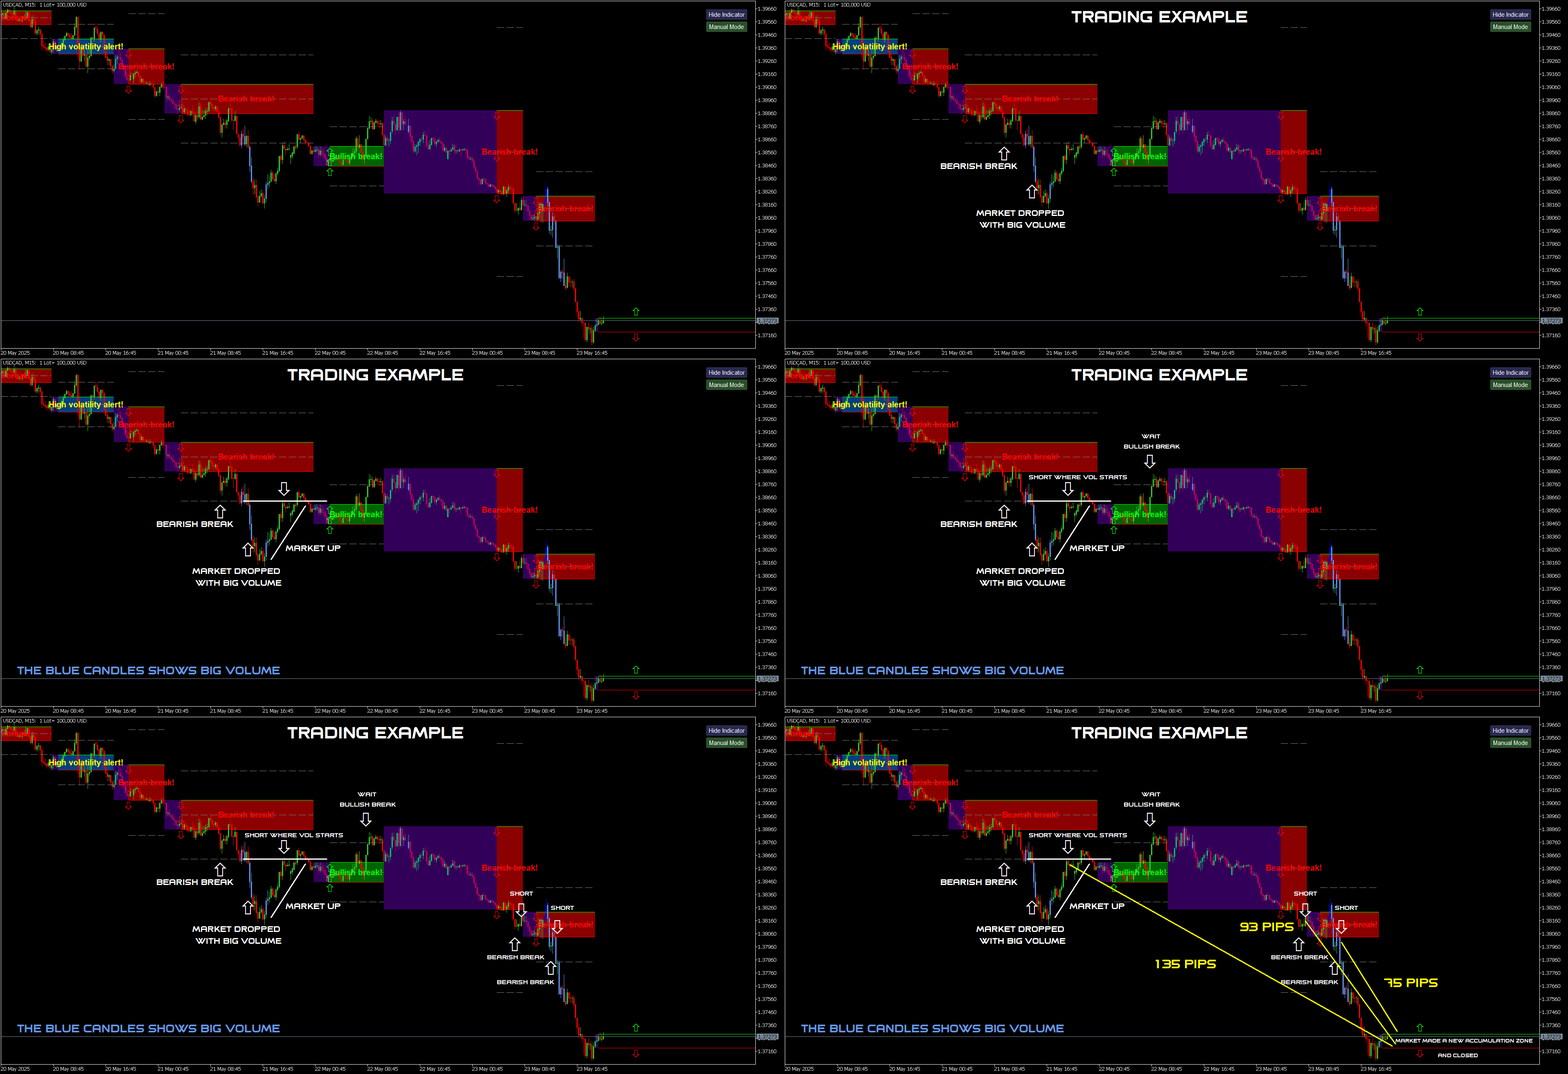
O indicador destaca as zonas onde interesses são declarados e depois mostra a sua zona de acumulação.

Transaction Speed funciona como um livro de ordens em grande escala.

Este é o indicador para o dinheiro mais pesado. Seu desempenho é excepcional. Qualquer interesse que exista no mercado, você conseguirá ver.

Transaction Speed é um indicador de conceito novo que mostra onde e quando grandes ordens se acumulam no mercado e permite aproveitar isso. Ele detecta mudanças de tendência em uma fase muito precoce. No Forex, o volume é chamado erroneamente de volume. Na verdade, é a variação do preço por unidade de tempo, portanto o nome correto é velocidade de transação. Tudo depende da forma como pensamos, agimos e analisamos. A mudança de paradigma é de importância fundamental. Este indicador revisa completamente a ideia de volume no Forex, definindo-o de forma lógica e correta, e aplicar essa lógica o transforma em uma ferramenta única e precisa.

Como usar:

Por padrão, o indicador está definido para o modo automático, permitindo que seja usado de forma independente em qualquer timeframe. Se desejar mudar para o modo manual, basta clicar no botão auto / manual.

No modo manual, todos os cálculos começam em 1 de janeiro de 2025. Você pode alterar essa data para ver resultados diferentes. O período ideal de dados para o indicador é entre quatro e seis meses. Assim, você captura dados de vários ciclos, garantindo que seus resultados tenham uma base sólida. Quanto maior o período, menos zonas aparecerão.

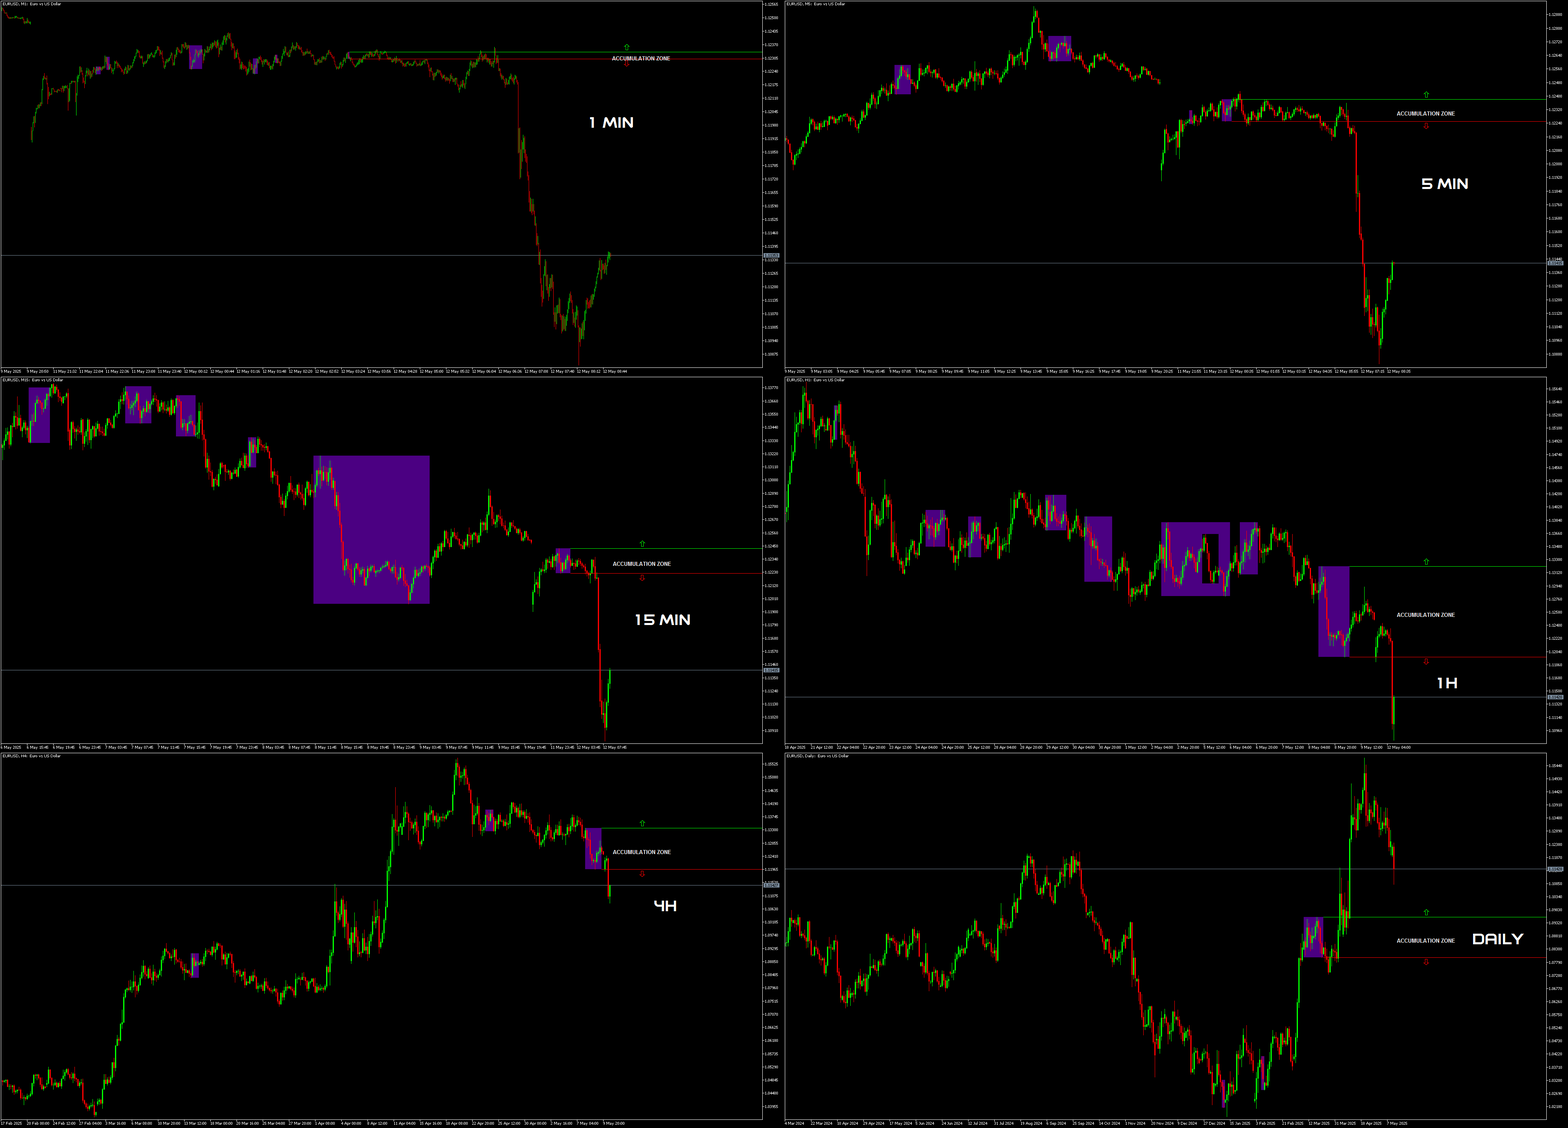
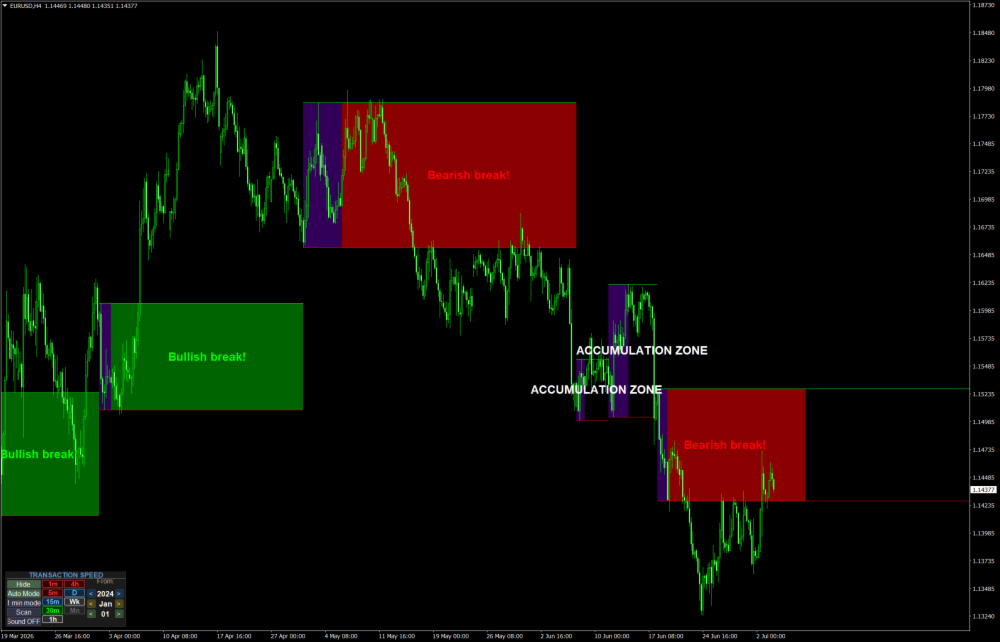
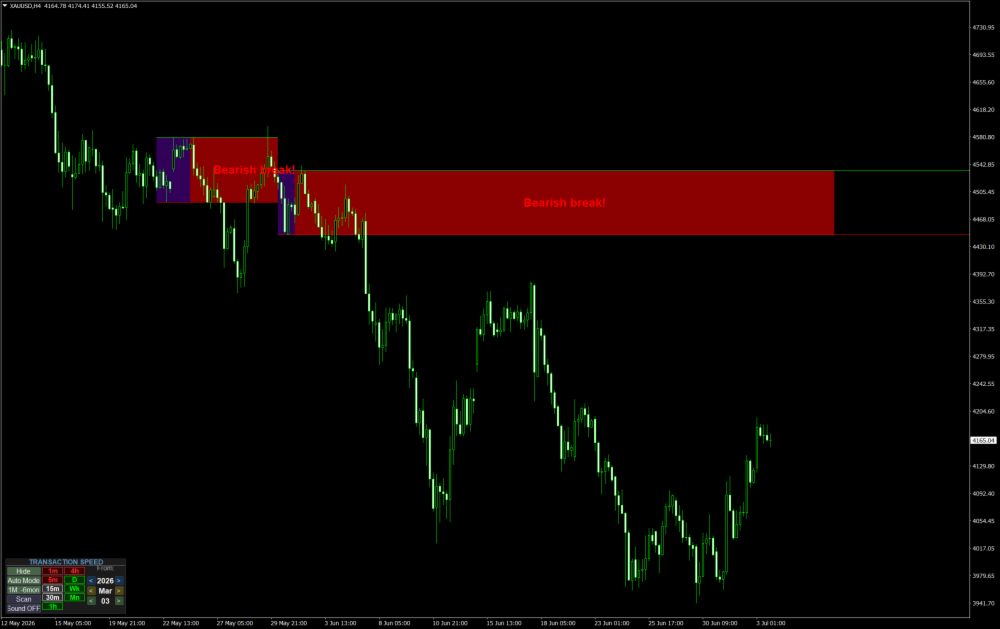
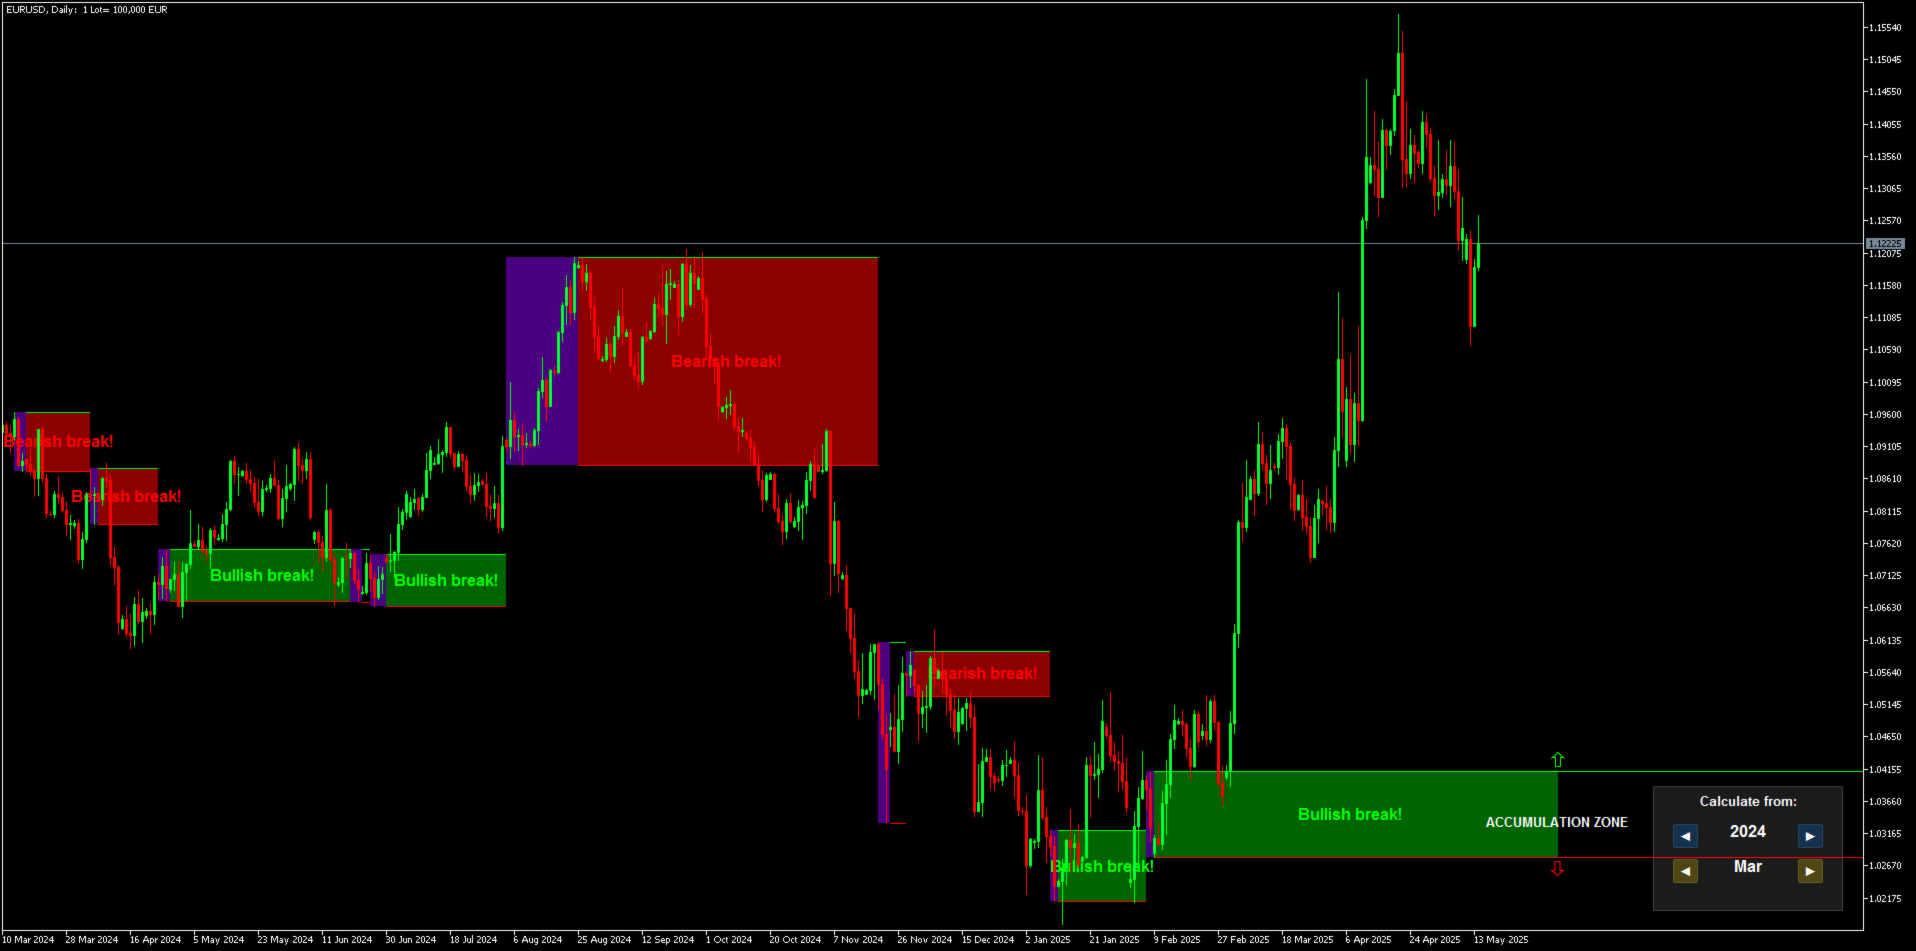
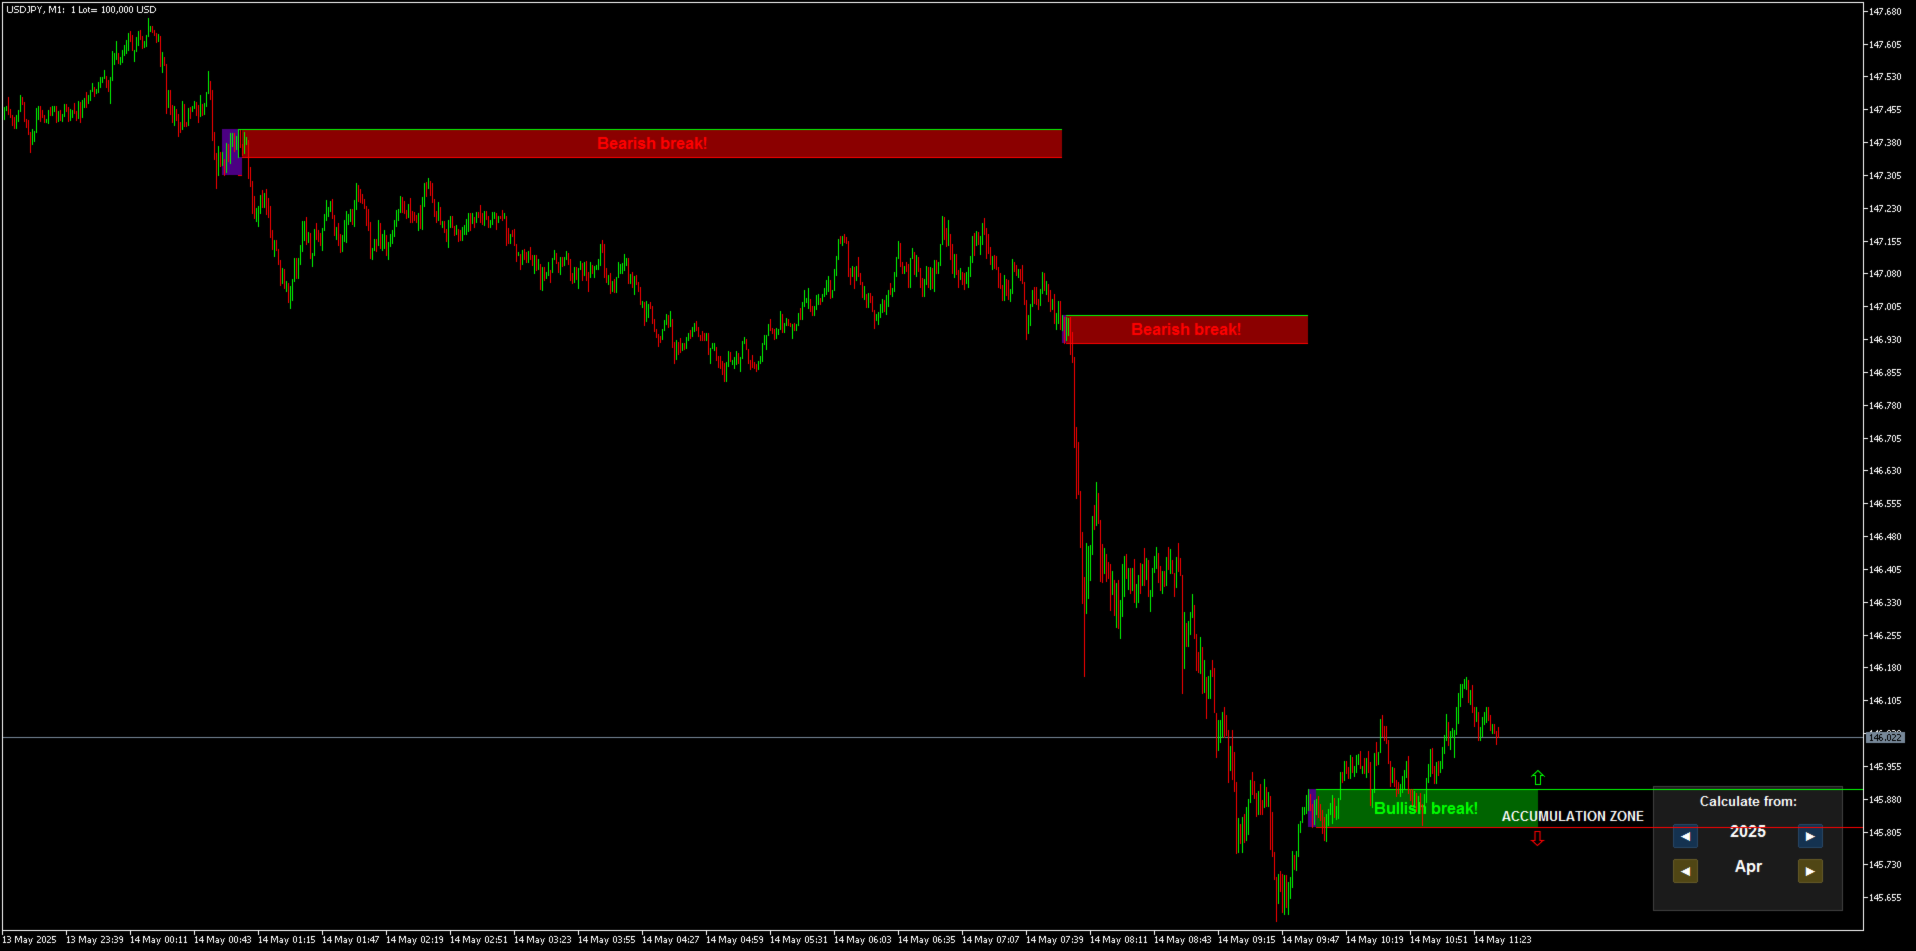
A área onde o mercado mostra DECLARED INTEREST é destacada com um retângulo roxo. Depois disso, aparece a ZONA DE ACUMULAÇÃO DE ORDENS.

Se o mercado romper essa zona para cima, a tendência é de alta e a zona de acumulação fica verde; se romper para baixo, a tendência é de baixa e a zona fica vermelha.

Uma vela que fecha totalmente fora da zona, sem tocar sua borda, é considerada um rompimento verdadeiro.

Quando uma vela se forma totalmente fora de uma zona de acumulação de ordens, isso sinaliza um rompimento e mostra a direção do mercado. Isso define a tendência. A tendência permanece válida até que haja um rompimento na direção oposta ou até que uma nova zona de interesse apareça no mercado.

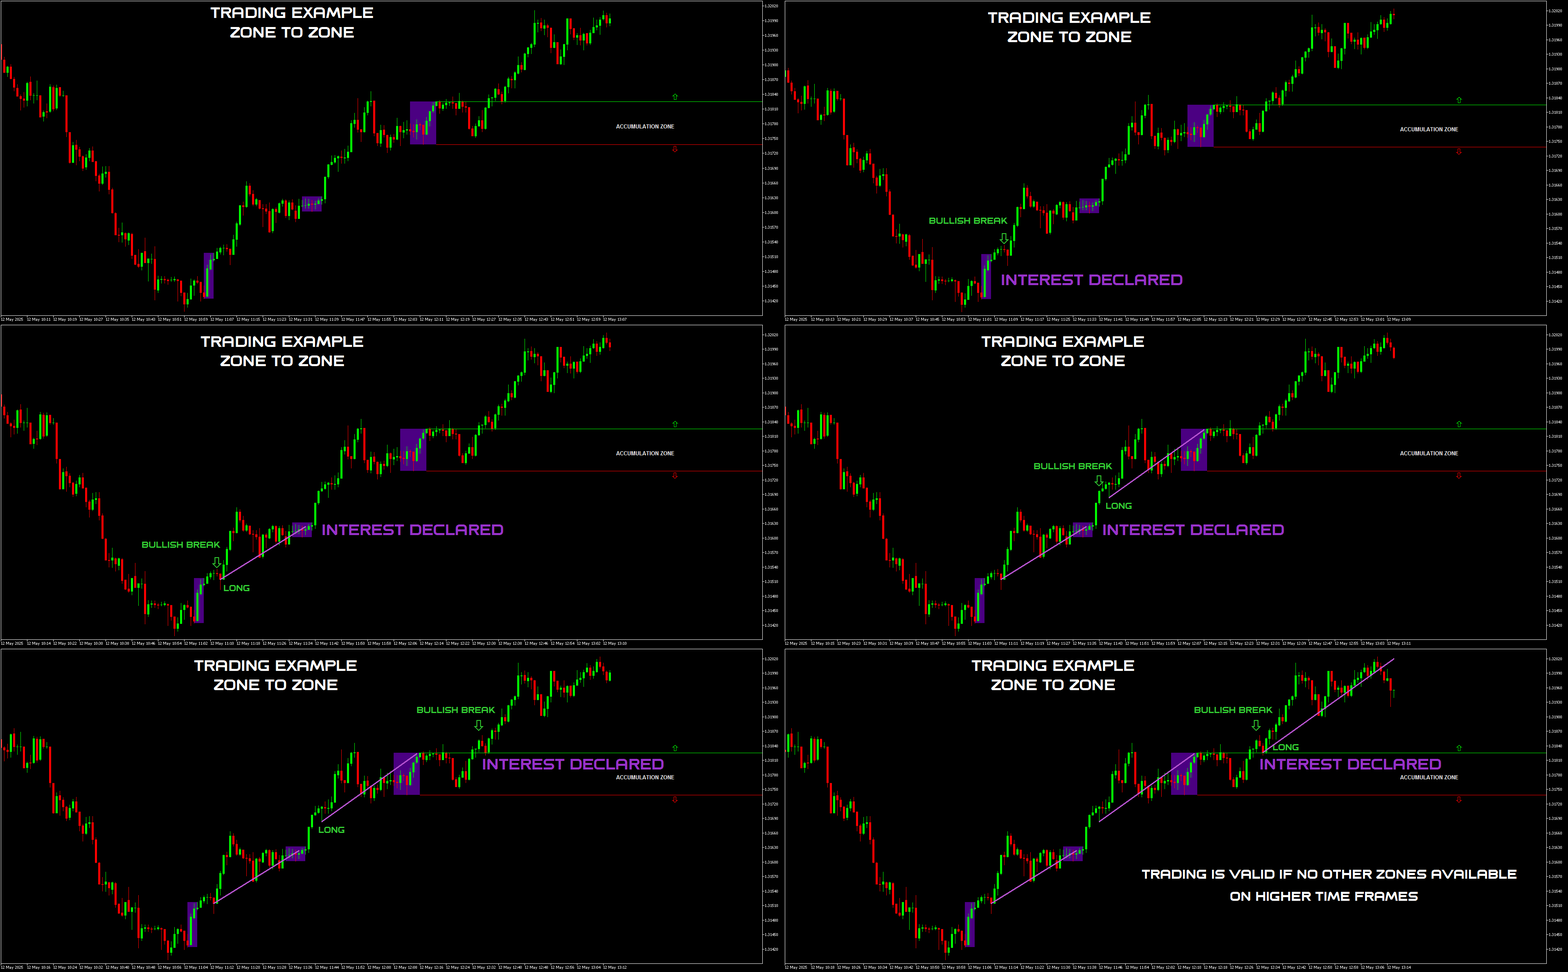
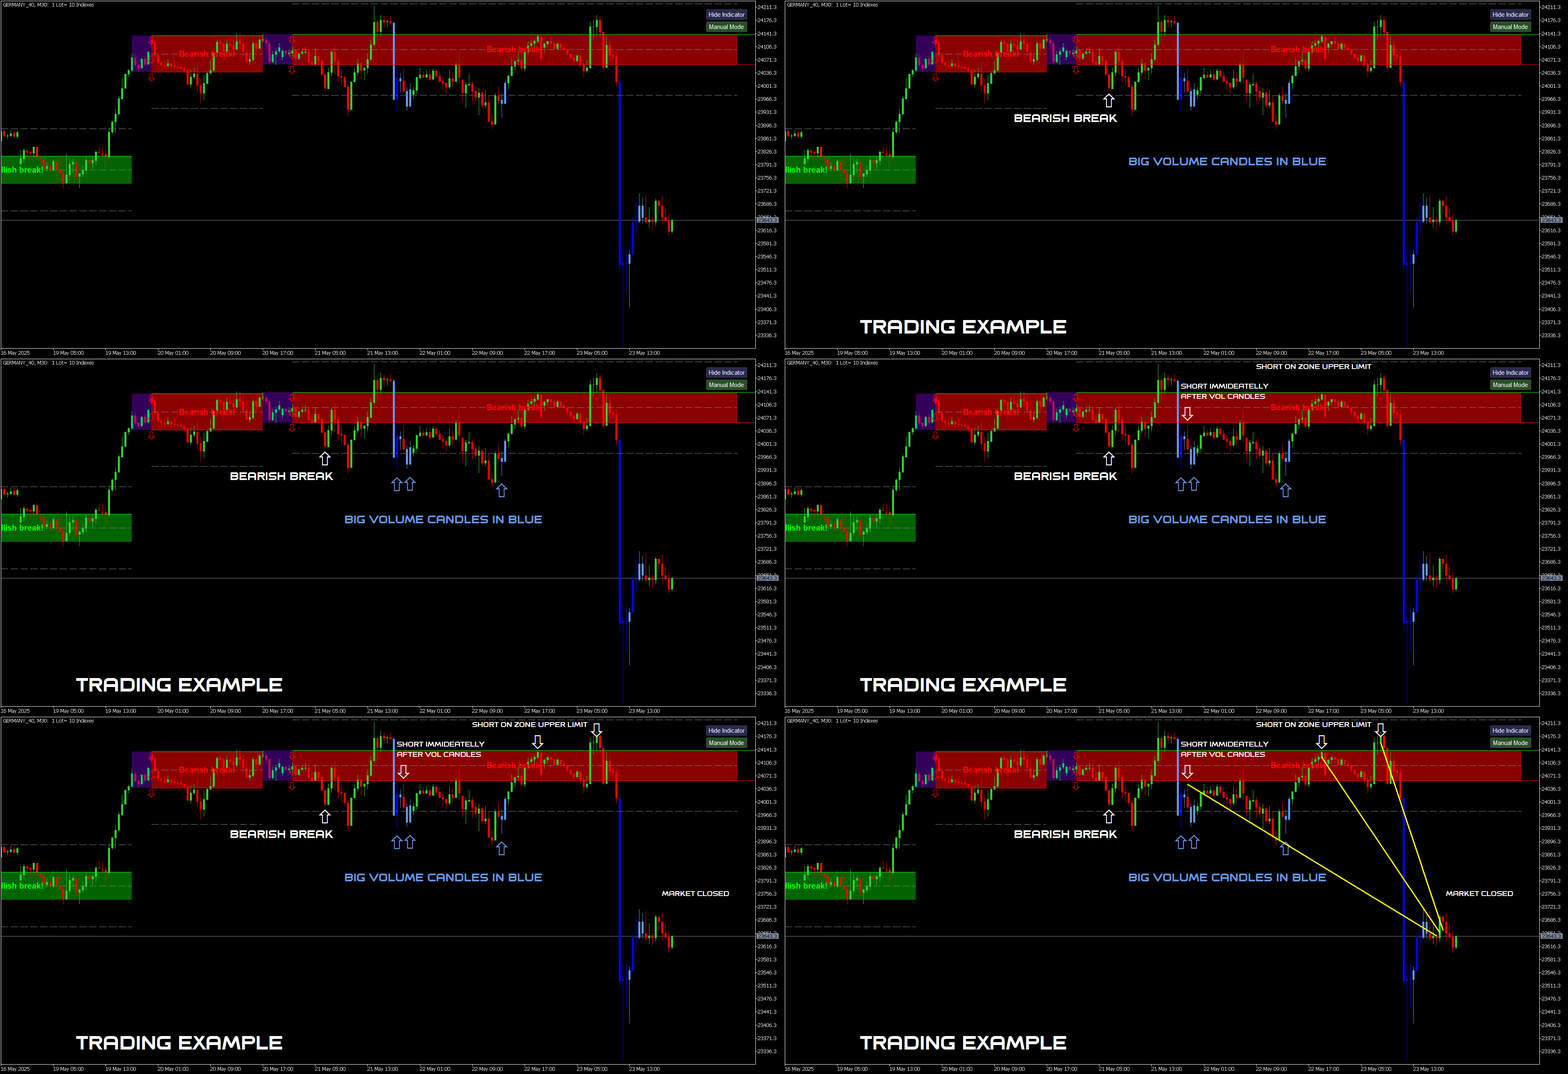
Você pode operar “zona a zona”.

Exemplo 1: Quando um rompimento da zona de acumulação, abra ordens na direção do mercado.

Exemplo 2: No gráfico de 4 horas ocorre um rompimento de alta e o mercado sobe. Após algum tempo, aparece uma zona no timeframe de 1 hora. Você pode fechar sua posição e esperar que a zona de 1 hora indique a direção seguinte.

Exemplo 3: Se você estiver dentro de uma zona, pode vender na parte superior ou comprar na parte inferior até que a zona seja rompida. Isso é operação em range, mas mais arriscada. Nunca opere contra o indicador. Nunca.

Se uma zona for rompida pelos dois lados, você recebe um sinal de High Volatility Alert.

Esses são os rastros do dinheiro. E tudo isso não pode ser visto a olho nu porque temos volume de ticks, que é a maior falácia. É para isso que serve este indicador de velocidade de transação, que converte o volume de ticks em atividade de mercado. É uma ferramenta muito séria, projetada para necessidades de análise avançada.

As zonas são criadas em todos os timeframes. A zona válida é a última na qual o mercado está negociando no momento. Para que uma zona seja considerada válida, ela não deve se sobrepor a nenhuma outra zona.

Recomendações:

Par de moedas: apenas instrumentos com grande volume de ticks EUR/USD, USD/JPY, GBP/USD etc. Timeframe: todos os timeframes. Depósito mínimo: sem mínimo. Tipo de conta: sem limitações. Corretoras: sem limitações. Corretoras maiores são preferíveis devido ao maior volume.

Ciência pura.

Suporte completo, orientação de configuração e materiais bônus estão disponíveis após a compra.

Antes de comprar: Este produto pode ser testado diretamente no MetaTrader Strategy Tester. Recomendo fortemente explorar como ele se comporta com seus instrumentos, timeframes e condições de mercado antes de tomar uma decisão de compra.

Tem dúvidas ou precisa de esclarecimentos? Se quiser verificar o indicador em operação real, envie-me uma mensagem. Estou disponível para ajudar e fornecer orientação clara para garantir que você compreenda totalmente o que o produto oferece.
Produtos recomendados
Alpha Trend sign has been a very popular trading tool in our company for a long time. It can verify our trading system and clearly indicate trading signals, and the signals will not drift. Main functions: Based on the market display of active areas, indicators can be used to intuitively determine whether the current market trend belongs to a trend market or a volatile market. And enter the market according to the indicator arrows, with green arrows indicating buy and red arrows indicating se
VR Cub
Vladimir Pastushak
VR Cub é um indicador para obter pontos de entrada de alta qualidade. O indicador foi desenvolvido para facilitar cálculos matemáticos e simplificar a busca por pontos de entrada em uma posição. A estratégia de negociação para a qual o indicador foi escrito tem provado a sua eficácia há muitos anos. A simplicidade da estratégia de negociação é a sua grande vantagem, o que permite que até mesmo os comerciantes novatos negociem com sucesso com ela. VR Cub calcula os pontos de abertura de posição e
PZ Harmonacci Patterns
PZ TRADING SLU
3.17 (6)
Este é sem dúvida o indicador de reconhecimento automático de formação de preço harmônico mais completo que você pode encontrar para a MetaTrader Platform. Ele detecta 19 padrões diferentes, leva as projeções de Fibonacci tão a sério quanto você, exibe a Zona de Reversão Potencial (PRZ) e encontra níveis adequados de stop loss e take-profit. [ Guia de instalação | Guia de atualização | Solução de problemas | FAQ | Todos os produtos ] Detecta 19 formações harmônicas de preços diferentes Traça
Gartley Projection D
Oleksandr Medviediev
3.71 (7)
The indicator identifies the harmonic patterns (XABCD) according to developments of H.M.Gartley ( "Profits in the Stock Market" , 1935г). It projects D-point as a point in the perspective projection (specify ProjectionD_Mode = true in the settings). Does not redraw. When a bar of the working timeframe closes, if the identified pattern point has not moved during Patterns_Fractal_Bars bars, an arrow appears on the chart (in the direction of the expected price movement). From this moment on, the ar
This is an arrow indicator without a future function,developed based on the most advanced profit trading algorithms.It has the most innovative and advanced dual trend analysis module, as well as the latest and highly effective market trend prediction algorithm.Trends are your friends, and following larger trends can earn the maximum profit in foreign exchange. This indicator helps traders identify current trends and track them. Someone once made a profit of 10 times in a week by relying on it.No
O indicador Crypto_Forex "Auto FIBO Pro" é uma ótima ferramenta auxiliar na negociação! - O indicador calcula e coloca automaticamente no gráfico os níveis de Fibonacci e as linhas de tendência locais (cor vermelha). - Os níveis de Fibonacci indicam áreas-chave onde o preço pode reverter. - Os níveis mais importantes são 23,6%, 38,2%, 50% e 61,8%. - Pode utilizá-lo para scalping de reversão ou para negociação de grelha de zona. - Existem muitas oportunidades para melhorar o seu sistema atual ut
Overview Harmonic Patterns MT4 is a technical analysis indicator designed for the MetaTrader 5 platform. It identifies and displays harmonic price patterns, such as Butterfly, Cypher, Crab, Bat, Shark, and Gartley, in both bullish and bearish directions. The indicator calculates key price levels, including entry, stop loss, and three take-profit levels, to assist traders in analyzing market movements. Visual elements and customizable alerts enhance usability on the chart. Features Detects six ha
Forex Gump
Andrey Kozak
2.4 (5)
Forex Gump is a fully finished semi-automatic trading system. In the form of arrows, signals are displayed on the screen for opening and closing deals. All you need is to follow the instructions of the indicator. When the indicator shows a blue arrow, you need to open a buy order. When the indicator shows a red arrow, you need to open a sell order. Close orders when the indicator draws a yellow cross. In order to get the most effective result, we recommend using the timeframes H1, H4, D1. There
The   RSI Divergence + FVG Signal   indicator combines   Relative Strength Index (RSI) Divergence   with   Fair Value Gap (FVG)   detection to generate high-probability buy and sell signals based on both momentum shifts and institutional imbalance zones. Core Features: RSI Divergence Detection : Identifies both regular and hidden bullish/bearish divergences between price and RSI. Divergences indicate potential trend reversals or continuation. FVG Zone Recognition : Detects Fair Value Gaps (imbal
Noize Absorption Index MT4
Ekaterina Saltykova
5 (1)
Noize Absorption Index - is the manual trading system that measures the difference of pressure between bears forces and bulls forces. Green line - is a noize free index that showing curent situation. Zero value of index shows totally choppy/flat market.Values above zero level shows how powerfull bullish wave is and values below zero measures bearish forces.Up arrow appears on bearish market when it's ready to reverse, dn arrow appears on weak bullish market, as a result of reverse expectation. S
PABT Pattern Indicator - it's classical system one of the signal patterns. Indicator logic - the Hi & Lo of the bar is fully within the range of the preceding bar, look to trade them as pullback in trend. In the way if indicator found PABT pattern it's drawing two lines and arrow what showing trend way.  - First line - it's entry point and drawing at: 1. On the high of signal bar or on middle of the signal bar (depending from indicator mode) for buy; 2. On the low of signal bar or on middle of t
Trendiness Index
Libertas LLC
5 (3)
"The trend is your friend" is one of the best known sayings in investing, because capturing large trendy price movements can be extremely profitable. However, trading with the trend is often easier said than done, because many indicators are based on price reversals not trends. These aren't very effective at identifying trendy periods, or predicting whether trends will continue. We developed the Trendiness Index to help address this problem by indicating the strength and direction of price trend
"Impulses and Corrections 4" is created to help traders navigate the market situation. The indicator shows multi-time frame upward and downward "Impulses" of price movements. These impulses are the basis for determining the "Base" , which is composed of zones of corrections of price movements, as well as "Potential" zones for possible scenarios of price movement. Up and down impulses are determined based on a modified formula of Bill Williams' "Fractals" indicator. The last impulse is always "U
The indicator provides a superior alternative to price action analysis. It enables the identification of normalized patterns, which are then transformed into a graphical representation to forecast future steps within a time series. In the top-left corner, you'll find information regarding the expected prediction accuracy, determined through a complex MSQE calculation. You have the flexibility to adjust the time window, making it easy to validate the indicator's performance. Additionally, you can

Trade with Gann on your side!! MASTER CIRCLE 360 CIRCLE CHART, originally created by Gann admitted that this is “The Mother of all charts”. It is one of the last studies that this great trader left for us. The numeric tab le is apparently quite simple like all the tables and is based on square numbers, the SQUARE OF 12 and is by evolution, one of the most important square numbers. Here we can find CYCLE, PRICE AND TIME thanks to angles and grades, to show past and future support and resistance.

Quantum Falcon Signal Free is a smart visual trading indicator for MetaTrader 4 designed for Forex and Gold traders. The indicator combines: • Trend analysis • RSI momentum confirmation • MACD momentum filtering • ATR volatility filtering • Higher timeframe confirmation • Smart exit signal detection Main Features: • Smart Buy and Sell signals • Exit Buy / Exit Sell alerts • Real-time dashboard on chart • Professional candle arrows • Multi-timeframe trend confirmation • ATR market volatility filt

FREE
The Th3Eng PipFinite indicator is based on a very excellent analysis of the right trend direction with perfect custom algorithms. It show the true direction and the best point to start trading. With StopLoss point and Three Take Profit points. Also it show the right pivot of the price and small points to order to replace the dynamic support and resistance channel, Which surrounds the price. And Finally it draws a very helpful Box on the left side on the chart includes (take profits and Stop loss

Trend Ray
Andriy Sydoruk
The indicator shows the potential trend direction by cyclical-wave dependence. Thus, all the rays of the intersection will be optimal rays, in the direction of which the price is expected to move, taking into account the indicator period. Rays can be used as a direction for potential market movement. But we must not forget that the approach must be comprehensive, the indicator signals require additional information to enter the market.
Os indicadores [ZhiBiCCI] são adequados para todo o ciclo de uso e também são adequados para todas as variedades do mercado. [ZhiBiCCI] Linha sólida verde é uma inversão da divergência de alta. A linha pontilhada verde é uma divergência de alta clássica. [ZhiBiCCI] A linha sólida para o vermelho é uma divergência de baixa reversa. A linha pontilhada vermelha é uma divergência clássica de baixa. [ZhiBiCCI] pode ser definido nos parâmetros (Alerta, Enviar e-mail, Enviar notificação), definido c
Antabod Gamechanger
Rev Anthony Olusegun Aboderin
*Antabod GameChanger Indicator – Transform Your Trading!*   Are you tired of chasing trends too late or second-guessing your trades? The *Antabod GameChanger Indicator* is here to *revolutionize your trading strategy* and give you the edge you need in the markets!   Why Choose GameChanger? *Accurate Trend Detection* – GameChanger identifies trend reversals with *pinpoint accuracy*, ensuring you enter and exit trades at the optimal time.   *Clear Buy & Sell Signals* – No more guesswork! T
The indicator detects and displays М. Gartley's Butterfly pattern. The pattern is plotted by the extreme values of the ZigZag indicator (included in the resources, no need to install). After detecting the pattern, the indicator notifies of that by the pop-up window, a mobile notification and an email. The pattern and wave parameters are displayed on the screenshots. The default parameters are used for demonstration purposes only in order to increase the amount of detected patterns. Parameters z
Daily Candle Predictor é um indicador que prevê o preço de fechamento de uma vela. O indicador destina-se principalmente ao uso em gráficos D1. Este indicador é adequado tanto para negociação forex tradicional quanto para negociação de opções binárias. O indicador pode ser usado como um sistema de negociação autônomo ou pode atuar como um complemento ao seu sistema de negociação existente. Este indicador analisa a vela atual, calculando certos fatores de força dentro do próprio corpo da vela, be
Color Stochastic Enhanced Stochastic Oscillator with Cross Detection and Visual Signal Support Overview Color Stochastic is a customized version of the classic Stochastic Oscillator designed for momentum analysis and crossover visualization. The indicator provides color-based signal marking and configurable crossover detection at user-defined overbought and oversold levels. It can be used as part of: Momentum analysis Mean reversion workflows DCA-based strategies Multi-indicator confirmation sys
The main idea of this indicator is rates analysis and prediction by Fourier transform. Indicator decomposes exchange rates into main harmonics and calculates their product in future. You may use the indicator as a standalone product, but for better prediction accuracy there is another related indicator - FreqoMaster - which uses FreqoMeterForecast as a backend engine and combines several instances of FreqoMeterForecast for different frequency bands. Parameters: iPeriod - number of bars in the ma
QuantumEdge Trader
Hossam Ali Ahmed Ali
QuantumEdge Trader v1.0 AI-Powered Precision Signals for Serious Traders QuantumEdge Trader is a smart and reliable indicator that delivers accurate BUY and SELL signals using advanced market analysis and trend detection. Designed for M1 to M60 timeframes, it's ideal for scalping and intraday strategies. --- Key Features: No Repaint – Signals never change after appearing Smart trend filters to reduce noise Adjustable sensitivity and alerts Perfect for XAUUSD, EURUSD, and m
Potential Reversal Price (PRP) Indicator - Ultimate Sniper Entries for XAUUSD Discounted   Price   !!     Secure your lifetime access   now   before it switches to   subscription-only ! Welcome to the   Potential Reversal Price (PRP) Indicator , your ultimate trading tool designed to catch high-probability market reversals with extreme precision. Built for serious traders who demand accuracy, the PRP Indicator combines advanced market structure analysis with momentum exhaustion to pinpoint the e
Chart Patterns Detect 15 patterns (Ascending Triangle, Descending Triangle, Rising Wedge, Falling Wedge, Bullish Flag, Bearish Flag, Bullish Rectangle, Bearish Rectangle Symmetrical triangle, Head and Shoulders, Inverted Head and Shoulders, Triple top, Triple Bottom, Double Top, Double Bottom) Use historical data to calculate the probability of each pattern to succeed (possibility to filter notification according to the chance of success) gives graphic indication about the invalidation level and
Price Magnet — Price Density and Attraction Levels Indicator Price Magnet is a professional analytical tool designed to identify key support and resistance levels based on statistical Price Density. The indicator analyzes a specified historical period and detects price levels where the market spent the most time. These zones act as “magnets,” attracting price action or forming a structural base for potential reversals. Unlike traditional Volume Profile tools, Price Magnet focuses on price-time d
RSI Speed mp
DMITRII GRIDASOV
Indicador Crypto_Forex "RSI SPEED" para MT4 - ótima ferramenta preditiva, sem necessidade de repintura. - O cálculo deste indicador é baseado em equações da física. O RSI SPEED é a primeira derivada do próprio RSI. - O RSI SPEED é bom para entradas de scalping na direção da tendência principal. - Use-o em combinação com um indicador de tendência adequado, por exemplo, HTF MA (como nas imagens). - O indicador RSI SPEED mostra a rapidez com que o próprio RSI muda de direção - ele é muito sensíve
Infinity Trend Pro
Yaroslav Varankin
1 (1)
This is a trend indicator without redrawing Developed instead of the binary options strategy (by the color of the Martingale candlestick) Also works well in forex trading When to open trades (binary options) A signal will appear in the place with a candle signaling the current candle It is recommended to open a deal for one candle of the current timeframe M1 and M5 When a blue dot appears, open a deal up When a red dot appears, open a trade down. How to open trades on Forex. When a signal is rec
Os compradores deste produto também adquirem
TrendMaestro
Stefano Frisetti
4 (4)
Attention: beware of SCAMS, TRENDMAESTRO is only ditributed throught MQL5.com market place. note: this indicator is for METATRADER4, if you want the version for METATRADER5 this is the link:  https://www.mql5.com/it/market/product/108106 TRENDMAESTRO ver 2.5 TRENDMAESTRO recognizes a new TREND from the start, he never makes mistakes. The certainty of identifying a new TREND is priceless. DESCRIPTION TRENDMAESTRO identifies a new TREND in the bud, this indicator examines the volatility, volumes a
Indicador Miraculous – Ferramenta 100% Não Repintável para Forex e Opções Binárias Baseada no Quadrado de Nove de Gann Este vídeo apresenta o Indicador Miraculous , uma ferramenta de negociação altamente precisa e poderosa, desenvolvida especificamente para traders de Forex e Opções Binárias . O que torna este indicador único é a sua base no lendário Quadrado de Nove de Gann e na Lei da Vibração de Gann , tornando-o uma das ferramentas de previsão mais precisas disponíveis na negociação moderna.
KuKl
IGOR KIRIANEN
The indicator is built on a non-standard Zig Zag, it draws accumulations after which if the price leaves this zone and a test of this zone occurs, then a sound signal is given and an arrow appears - after the test candle closes.The indicator does not redraw its signals, it is very easy to use, there are only three settings 1- this is the zig zag parameter 2- this is the minimum price exit from the zone 3- this is the maximum price exit from the zone. The lower the parameter for Zig Zag, the more
Breakout Arrows Mt4
Michael Oko Oboh
5 (1)
Trend Breakout Arrows Indicator The Trend Breakout Arrows Indicator is a momentum-based signal tool designed to identify potential bullish and bearish breakout opportunities. It displays clear arrow signals directly on the price chart, helping traders quickly recognize possible trend changes and continuation setups. Up Arrow (Buy Signal) A magenta up arrow appears below a candle when bullish momentum begins to strengthen. This signal indicates that buying pressure may be overtaking selling press
TRADING STRATEGY GUIDE DELIVERY The full Trading Strategy Guide will be sent directly to you after purchase. Just message me on MQL5 and ask for it — you'll receive it instantly, along with priority support and setup help. Powered Market Scanner for Smart Trading Decisions Keypad Support & Resistance is a next-generation MT4 trading system built for serious traders who demand precision, reliability, and clarity. It combines advanced smart filters with real-time price structure logic to genera
CountSig
Yin Zhou Luo
一款信号统计指标(MT4)——实现基于当前图表周期下的单线MA转向和双线MA金叉/死叉统计 . 转向定义:前一K向下或走平,当前K向上,视为转向向上;反之,转向向下。 金死叉定义:前一K快线在慢线下方,当前K快线在慢线上方,为金叉;反之,死叉。 参数及使用说明: 1、可指定统计K线数。 2、可指定4个不同的日内时间段,格式如"03:00-07:59",4个时间段可交叉任意输入。 3、可配置ABC三个浮盈区间段点值。如:分界区间统计小点值设为500,即当某转向信 号出现后到下一反向信号止浮盈<=此点值,计入A区间; 若大于此点值<大分界点值时,计入B区间;若大于“大分界点值”计入C区间。 4、最大/最小浮盈统计。显示所有统计区间内的最大浮盈点值和最小浮盈点值(亏损点值)。 5、输出完整信号,按信号出现顺序排列,如“ACCBCA”之类。 6、综合预测。使用概率、周期、趋势、马尔可夫链等综合概算输出预测该信号出现的归类概率值。 7、加载指定MA线。在当前图表自动载入相应设置的MA线。 8、自适应列宽。以完整显示统计信号数。 9、用法:点击相应统计按钮即输出相应的统计表格.
Fxland Price Reversal Zones (MT4) FXLAND Smart Reversal Indicator is a professional technical analysis tool designed to help traders identify potential price reversal zones and key market turning points with clarity and precision. The best reversal indicator and price return by choosing only one ceiling or floor in each time frame A masterpiece of combining mathematics and Gann, fractal matrix, Fibonacci, movement angle and time. Completely intelligent Key Features Detects potential pr
The Hurricane Indicator
Paul Nicholas Clevett
5 (1)
Currently switched to the 4 hour chart - but use other time frames for confirmation. :-)  I change my main time frame based on the market movement at the time. The Hurricane Forex Indicator is a multi time frame indicator that includes such things as Trade Notifications, Trade Calculator, Momentum Indicator, risk reward and much more. We have a free Trade room for our users as well. Please check out the video for full details of how this indicator works as it has over 15 years worth of developme
VTrende Pro mt4
Andrii Diachenko
3 (2)
VTrende Pro MT4 - MTF indicator for trend trading with a display panel for MT5 *** Videos can be translated into any language using subtitles (video language - Russian) Although the signals of the VTrende Pro indicator can be used as signals of a full-fledged trading system, it is recommended to use them in conjunction with the Bill Williams TS. VTrende Pro  MT4 is an extended version of the VTrende indicator. Difference between Pro version and VTrende: - Time zones - Signal V - signal 1-2 wave
WanaScalper MT4
Isaac Wanasolo
1 (1)
A scalping indicator based on mathematical patterns, which on average gives signals with relatively small SL, and also occasionally helps to catch big moves in the markets (more information in the video) This indicator has three main types of notifications: The first type warns of a possible/upcoming signal on the next bar The second type indicates the presence of a ready signal to enter the market/open a position The third type is for SL and TP levels - you will be notified every time price re
FFx Engulfing Setup Alerter gives trade suggestions with Entry, Target 1, Target 2 and StopLoss. Below are the different options available: Entry suggestion - pips to be added over the break for the entry 3 different options to calculate the SL - by pips, by ATR multiplier or at the pattern High/Low 3 different options to calculate the 2 TPs - by pips, by ATR multiplier or at Risk/Reward Offset the dashboard - any place on the chart Remove the suggestion once the price reached the SL line Lines
FFx InsideBar Setup Alerter gives trade suggestions with Entry, Target 1, Target 2 and StopLoss. Below are the different options available: Entry suggestion - pips to be added over the break for the entry Minimum candle size - to avoid too close buy/sell entry suggestions 3 different options to calculate the SL - by pips, by ATR multiplier or at the pattern High/Low 3 different options to calculate the 2 TPs - by pips, by ATR multiplier or at Risk/Reward Offset the dashboard - any place on the c
FFx OutsideBar Setup Alerter gives trade suggestions with Entry, Target 1, Target 2 and StopLoss. Below are the different options available: Entry suggestion - pips to be added over the break for the entry. 3 different options to calculate the SL - by pips, by ATR multiplier or at the pattern High/Low. 3 different options to calculate the 2 TPs - by pips, by ATR multiplier or at Risk/Reward. Offset the dashboard - any place on the chart. Remove the suggestion once the price reached the SL line.
FFx PinBar Setup Alerter gives trade suggestions with Entry, Target 1, Target 2 and StopLoss. Below are the different options available: Entry suggestion - pips to be added over the break for the entry Minimum candle size - to avoid too small candles 3 different options to calculate the SL - by pips, by ATR multiplier or at the pattern High/Low 3 different options to calculate the 2 TPs - by pips, by ATR multiplier or at Risk/Reward Offset the dashboard - any place on the chart Remove the sugges
Automatic, live & interactive picture of all trendlines. Assign push, email and sound alerts to the lines of your choice and be informed about price rollback, breakout, rollback after breakout, number of rollbacks, line expiration by double breakout. Correct, drag or delete the lines and interactively tune the line system. https://youtu.be/EJUo9pYiHFA . Chart examples https: //www.mql5.com/en/users/efficientforex Price Interaction Events All events are effective immediately and only after one
The purpose of this new version of the MT4 standard indicator provided in your platform is to display in a sub-window multiple timeframes of the same indicator with its divergences. See the example shown in the picture below. But the display isn't like a simple MTF indicator. This is the real display of the indicator on its timeframe. Here's the options available in the FFx divergences indicator: Select the timeframes to be displayed (M1 to Monthly) Define the width (number of bars) for each tim
The purpose of this new version of the MT4 standard indicator provided in your platform is to display in a sub-window multiple timeframes of the same indicator with its divergences. See the example shown in the picture below. But the display isn't like a simple MTF indicator. This is the real display of the indicator on its timeframe. Here's the options available in the FFx divergences indicator: Select the timeframes to be displayed (M1 to Monthly). Define the width (number of bars) for each ti
The FFx Dashboard MTF alerter will show you on a single chart all the timeframes (M1 to Monthly) with their own status for the indicator. 2 Alert Options: Single timeframe: each selected timeframe alert separately when a signal occurs Multi timeframes: all selected timeframes must agree for an alert to be triggered Both options have an input to select the timeframes to be used for the alert(s). How to Understand the Status: Green/Red square: histogram above/below 0 line Green square + Red bord
The FFx Dashboard MTF alerter will show you on a single chart all the timeframes (M1 to Monthly) with their own status for the indicator. 2 Alert Options: Single timeframe: each selected timeframe alert separately when a signal occurs Multi timeframes: all selected timeframes must agree for an alert to be triggered Both options have an input to select the timeframes to be used for the alert(s). How to understand the status: Green/Red square: RSI above/below 50 line Green square + Red border: R
The FFx Dashboard MTF alerter will show you on a single chart all the timeframes (M1 to Monthly) with their own status for the indicator. 2 Alert Options: Single timeframe: each selected timeframe alert separately when a signal occurs Multi timeframes: all selected timeframes must agree for an alert to be triggered Both options have an input to select the timeframes to be used for the alert(s). How to understand the status: Green/Red square: Stoch above/below 50 line Green square + Red border:
The FFx Dashboard MTF alerter will show you on a single chart all the timeframes (M1 to Monthly) with their own status for the indicator. 2 Alert Options: Single timeframe: each selected timeframe alert separately when a signal occurs Multi timeframes: all selected timeframes must agree for an alert to be triggered Both options have an input to select the timeframes to be used for the alert(s). How to understand the status: Green/Red square: Price above/below Cloud (Kumo) Green square + Red bo
The FFx Dashboard MTF alerter will show you on a single chart all the timeframes (M1 to Monthly) with their own status for the indicator. 2 Alert Options: Single timeframe: each selected timeframe alert separately when a signal occurs Multi timeframes: all selected timeframes must agree for an alert to be triggered Both options have an input to select the timeframes to be used for the alert(s). How to understand the status: Green/Red square: MA pointing Up/Down Green square + Red border: MA po
The FFx Dashboard MTF alerter will show you on a single chart all the timeframes (M1 to Monthly) with their own status for the indicator. 2 Alert Options: Single timeframe: each selected timeframe alert separately when a signal occurs. Multi timeframes: all selected timeframes must agree for an alert to be triggered. Both options have an input to select the timeframes to be used for the alert(s). How to understand the status: Green square: Price above PSAR Red square: Price below PSAR Options
The FFx Dashboard MTF alerter will show you on a single chart all the timeframes (M1 to Monthly) with their own status for the indicator. 2 Alert Options: Single timeframe: each selected timeframe alert separately when a signal occurs Multi timeframes: all selected timeframes must agree for an alert to be triggered Both options have an input to select the timeframes to be used for the alert(s). How to understand the status: Green/Red square: CCI above/below levels (ie. 100/-100) Grey square: C
The FFx Dashboard MTF alerter will show you on a single chart all the timeframes (M1 to Monthly) with their own status for the indicator. 2 Alert Options: Single timeframe: each selected timeframe alert separately when a signal occurs Multi timeframes: all selected timeframes must agree for an alert to be triggered Both options have an input to select the timeframes to be used for the alert(s). How to understand the status: Green/Red square: ADX above level Grey square: ADX below level Red bor
The FFx Dashboard MTF alerter will show you on a single chart all the timeframes (M1 to Monthly) with their own status. 2 Alert Options: Single timeframe: each selected timeframe alert separately when a signal occurs Multi timeframes: all selected timeframes must agree for an alert to be triggered Both options have an input to select the timeframes to be used for the alert(s). How to understand the status: Green/Red square: bullish/bearish candle Options available in the FFx Dashboard Alerter
The indicator of a Professional Trader is an arrow indicator for predicting the direction of price movement. I have been working on this indicator since 2014. You can use this indicator as your main indicator, use its entry signals, and use it as your only indicator to find entry points. About the product: Recommended TF [H4-D1-W1]   . The indicator predicts the direction of the next candle. Fits a variety of tools; Flexibility in settings for different instruments and intervals through the MO
Mais do autor
KAMA Confluence Engine Negocie a favor da tendência — e saiba seu ponto de Entrada, Stop e Alvos no exato momento em que ela muda. O KAMA Confluence Engine é um indicador de tendência completo, baseado na Média Móvel Adaptativa de Kaufman (KAMA), aprimorado com ponderação por volume de ticks, confirmação multi‑temporal e níveis automáticos de trade. Ele se adapta ao mercado: rápido e responsivo em tendências, estável e filtrado em períodos laterais — mantendo você do lado certo do movimento sem
O indicador destaca as zonas onde há declaração de interesse no mercado e, em seguida, mostra a zona de acumulação de ordens . Ele funciona como um livro de ofertas em escala ampliada . Este é o indicador para o dinheiro grande . Seu desempenho é excepcional. Qualquer interesse que existir no mercado, você verá com clareza . (Esta é uma versão totalmente reescrita e automatizada — não é mais necessário fazer análise manual .) A Velocidade de Transação é um indicador de conceito novo que mostra o
MACD divergency
Ivan Stefanov
4.63 (8)
Este indicador identifica com precisão as divergências altistas e baixistas entre os movimentos de preço e o histograma MACD, usando períodos de Médias Móveis Exponenciais (EMA) de 5 (rápido), 34 (lento) e um período de linha de sinal de 5. O indicador destaca os pontos onde o momentum enfraquece, sinalizando possíveis reversões de tendência. Regras para identificação correta de divergências: A divergência altista é válida quando o preço forma mínimas mais baixas e o histograma MACD simultaneame
FREE
Meravith MT5
Ivan Stefanov
5 (2)
Ferramenta dos market makers. O Meravith irá: Analisar todos os timeframes e exibir a tendência atual em vigor. Destacar zonas de liquidez (equilíbrio de volume) onde o volume comprador e vendedor é igual. Mostrar todos os níveis de liquidez de diferentes timeframes diretamente no seu gráfico. Gerar e apresentar análise de mercado em formato de texto para sua referência. Calcular alvos, níveis de suporte e pontos de stop-loss com base na tendência atual. Calcular a relação risco/retorno das suas
KAMA Confluence Engine Negocie a favor da tendência — e saiba seu ponto de Entrada, Stop e Alvos no exato momento em que ela muda. O KAMA Confluence Engine é um indicador de tendência completo, baseado na Média Móvel Adaptativa de Kaufman (KAMA), aprimorado com ponderação por volume de ticks, confirmação multi‑temporal e níveis automáticos de trade. Ele se adapta ao mercado: rápido e responsivo em tendências, estável e filtrado em períodos laterais — mantendo você do lado certo do movimento sem
FREE
RSI Divergence Pulse é um indicador abrangente de RSI que combina detecção de divergências, análise multi-timeframe e ferramentas visuais em um único aplicativo leve. Ele identifica automaticamente divergências Regulares e Ocultas, exibe um painel RSI Multi-Timeframe ao vivo, preenche zonas OB/OS para reconhecimento visual, desenha linhas de divergência tanto no gráfico de preços quanto na sub-janela RSI, coloca setas Buy/Sell e fornece alertas em tempo real. Features Color-Coded RSI Line A lin
Meravith Scanner
Ivan Stefanov
5 (2)
O MERAVITH SCANNER é um indicador profissional de mercados financeiros para MetaTrader 5 que consolida várias ferramentas analíticas em um único sistema integrado. Ele realiza todos os cálculos automaticamente usando uma metodologia proprietária de preço médio ponderado por volume (VWAP), eliminando completamente a interpretação subjetiva. O indicador funciona em todas as classes de ativos (Forex, Ações, Índices, Commodities, Criptomoedas) e em todos os prazos, de M1 a Mensal. O princípio fundam
Enigmera
Ivan Stefanov
5 (9)
ENIGMERA: O núcleo do mercado Importante: A demonstração do MQL5.com funciona no Strategy Tester e pode não refletir completamente a funcionalidade do Enigmera. Verifique a descrição, as capturas de tela e o vídeo para mais detalhes. Fique à vontade para me enviar uma mensagem com qualquer dúvida! O código do indicador foi completamente reescrito. A versão 3.0 adiciona novas funcionalidades e corrige erros acumulados desde o início do indicador. Introdução Este indicador e sistema de negociação
Este indicador identifica com precisão as divergências altistas e baixistas entre os movimentos de preço e o histograma MACD, usando períodos de Médias Móveis Exponenciais (EMA) de 5 (rápido), 34 (lento) e um período de linha de sinal de 5. O indicador destaca os pontos onde o momentum enfraquece, sinalizando possíveis reversões de tendência. Regras para identificação correta de divergências: A divergência altista é válida quando o preço forma mínimas mais baixas e o histograma MACD simultaneame
FREE
Times MT5
Ivan Stefanov
TIMES adiciona a dimensão temporal à sua análise. É a terceira peça da tríade de trading: Meravith mostra o preço justo, TransactionSpeed mostra o volume justo, e TIMES mostra onde, no tempo, a atividade de negociação está se concentrando — revelando se o momentum está sendo construído ou enfraquecendo. O que ele mostra: as zonas (retângulos) Em vez de encher o gráfico com linhas, TIMES condensa sua análise em retângulos coloridos desenhados diretamente no gráfico de preços. Cada retângulo marc
Meravith
Ivan Stefanov
5 (3)
Ferramenta dos market makers. O Meravith irá: Analisar todos os timeframes e exibir a tendência atual em vigor. Destacar zonas de liquidez (equilíbrio de volume) onde o volume comprador e vendedor é igual. Mostrar todos os níveis de liquidez de diferentes timeframes diretamente no seu gráfico. Gerar e apresentar análise de mercado em formato de texto para sua referência. Calcular alvos, níveis de suporte e pontos de stop-loss com base na tendência atual. Calcular a relação risco/retorno das sua
Imbalance Pro
Ivan Stefanov
5 (4)
O indicador mede o desequilíbrio entre os touros e os ursos durante um período escolhido e mostra uma linha reta entre os dois pontos. Se os touros tiverem mais volume do que os ursos, a linha fica verde.  Se os ursos tiverem mais volume, a linha fica vermelha. A linha também mostra a diferença percentual no volume. O indicador mostra os mesmos dados numa janela separada. Também é possível ver o volume dividido. O indicador tem dois modos. Para este efeito, existe um botão no canto superio
Two Snakes
Ivan Stefanov
5 (1)
2 SNAKES é um sistema de escalpelamento de primeira classe. Como as entradas são bastante precisas, é provável que você se torne viciado nesse sistema muito rapidamente.  Você tem 2 cobras. Quando você vê uma vela acima ou abaixo delas que não as toca, esse é o seu sinal de escalpelamento. Se você usar um período de tempo maior, o scalping pode se tornar um acompanhamento de tendência. As snakes são calculadas precisamente em relação ao estado atual do mercado. Elas NÃO SÃO médias móveis.
Levelss
Ivan Stefanov
5 (1)
O indicador LEVELSS mostra: - Zona diária de alta e de baixa. É visível todos os dias das 00:00 às 23:59.  - A zona semanal de alta e baixa. É visível de segunda-feira 0:00 a sexta-feira 23:59 todas as semanas. - Canal especialmente calculado a partir de um período de tempo específico que é exibido em todos os outros períodos de tempo. Por defeito, este é o período de 4 horas que pode ser alterado para qualquer outro período de tempo que deseje negociar. É calculado sem parar. No canto superi
GANN Master
Ivan Stefanov
5 (1)
Os alvos precisos de GANN são calculados com base em seus métodos testados pelo tempo e apresentados bem à sua frente. Esta ferramenta foi projetada para tornar a negociação mais fácil e intuitiva. Ao mover a linha branca para cima ou a linha verde para baixo, você verá imediatamente por que as técnicas de GANN continuam a ser influentes no mundo do trading. As estratégias de GANN se concentram em prever movimentos de mercado com alta precisão, e esta ferramenta traz esse poder para suas mãos
Sense
Ivan Stefanov
5 (2)
O SENSE é um sistema automatizado que combina métodos GANN selecionados com cálculos fractais. O sistema diz-nos onde abrir e fechar as transacções. Já não precisa de perder tempo com cálculos complexos - o SENSE faz tudo por si. Basta instalar o indicador. Princípios básicos: O mercado está em alta quando o preço está acima das linhas brancas Comprar acima das linhas brancas, parar abaixo As linhas verdes são objectivos de subida O mercado está em baixa quando o preço está abaixo das linhas
Stefanov
Ivan Stefanov
The indicator displays support and resistance zones defined logically using the MACD. The entire concept is explained in the video, with specific examples shown. The indicator works on any instruments and timeframes. It does not repaint. After placing it on the chart, please go through all the timeframes sequentially, from monthly to 1-minute, so that all lines load correctly. After that, you can start using it. The concept is unique and has not been seen in other systems or indicators.
Fifty Pro
Ivan Stefanov
5 (1)
O indicador FIFTY agora está disponível em uma versão automatizada, eliminando a necessidade de desenhar os níveis manualmente. Esta versão traça automaticamente os níveis diários, semanais, mensais e anuais no gráfico, garantindo precisão e economizando tempo. Além disso, há botões para alternar a visibilidade desses níveis, permitindo total personalização. Para aqueles que preferem, a versão gratuita do indicador continua disponível e totalmente funcional, permitindo que os traders escolham en
“Naturu” é um indicador manual que usa a simetria da natureza como seu algoritmo. Domine o mercado com uma estratégia simples e sabedoria oculta! Ao carregar o indicador, você verá duas linhas: Superior (Top) e Inferior (Bottom). Clique uma vez em uma linha para ativá-la. Para movê-la, basta clicar na vela onde deseja posicioná-la. Você define um ponto alto e um ponto baixo, e o indicador calcula automaticamente: Uma zona magenta que mostra onde os interesses de touros e ursos estão mais próximo
RSI Divergence Pulse — Smart Divergence Scanner with MTF Panel, Zone Fill, Alerts & Dashboard SHORT DESCRIPTION Professional RSI indicator with automatic Regular & Hidden divergence detection, color-coded RSI line, Multi-Timeframe panel, OB/OS zone fills, Buy/Sell arrows, signal labels, real-time dashboard, and multi-channel alerts. Works on any symbol and timeframe. FULL DESCRIPTION
Enigmera MT5
Ivan Stefanov
3.67 (3)
ENIGMERA: O núcleo do mercado (Este é um indicador manual e contém funções que podem não ser compatíveis com o ambiente atual de testes do MetaTrader) Introdução Este indicador e sistema de trading representam uma abordagem única aos mercados financeiros. ENIGMERA utiliza ciclos fractais para calcular com precisão os níveis de suporte e resistência. Mostra a fase autêntica de acumulação e fornece direção e objetivos. É um sistema que funciona tanto em tendência quanto em correção. Como funciona
Um dos poucos indicadores que calcula níveis exclusivamente com base no preço. O indicador não é afetado por timeframes, tendências ou ciclos de mercado. Um dos indicadores mais lógicos já criados. O indicador FIFTY agora está disponível em uma versão automatizada, eliminando a necessidade de desenhar níveis manualmente. Esta versão traça automaticamente os níveis diários, semanais, mensais e anuais no gráfico, garantindo precisão e economia de tempo. Além disso, botões estão disponíveis para al
Níveis lendários de William Gann em um indicador MT5 totalmente automatizado. O GANN Master identifica zonas-chave onde o preço tem maior probabilidade de reverter ou continuar sua tendência, com base em dados diários, semanais e mensais. Recursos principais: Botões de período com um clique: clique em Daily, Weekly ou Monthly para traçar instantaneamente as zonas do dia, da semana ou do mês atuais Modos Automático e Manual • Automático: o GANN Master calcula todos os níveis para você, sem neces
SPEKULATOR é um sistema de trading manual e um indicador que ajuda você a identificar zonas-chave de suporte e a direção do mercado. Domine o mercado com uma estratégia simples e sabedoria oculta. Você escolhe qualquer topo (TOP) e fundo (BOTTOM) no gráfico, e o indicador desenha: Uma zona de suporte para a sua tendência. Para uma tendência de alta, aparece uma zona verde; para uma tendência de baixa, uma zona vermelha. A sensibilidade da zona de suporte pode ser ajustada nas configurações do in
Naturu
Ivan Stefanov
5 (1)
“Naturu” é um indicador manual que usa a simetria da natureza como seu algoritmo. Domine o mercado com uma estratégia simples e sabedoria oculta! Ao carregar o indicador, você verá duas linhas: Superior (Top) e Inferior (Bottom). Clique uma vez em uma linha para ativá-la. Para movê-la, basta clicar na vela onde deseja posicioná-la. Você define um ponto alto e um ponto baixo, e o indicador calcula automaticamente: Uma zona magenta que mostra onde os interesses de touros e ursos estão mais próximo
Oscilador de momentum avançado que ajusta automaticamente o seu período com base na volatilidade do mercado para sinais de sobrecompra e sobrevenda mais precisos. Como funciona O indicador utiliza um cálculo de período adaptativo que encurta durante alta volatilidade e alonga durante baixa volatilidade. Esse ajuste dinâmico fornece sinais mais rápidos quando o mercado está em tendência e reduz sinais falsos em condições laterais. O valor do RSI é calculado com base nesse período variável, torna
Filtro:
Sem comentários
Responder ao comentário