SecScaleMultiSymbol Viewer
- Indicatori
- Versione: 1.2
- Aggiornato: 12 maggio 2026

[New Era of Speed] Canvas Engine Powered Tick-Chart
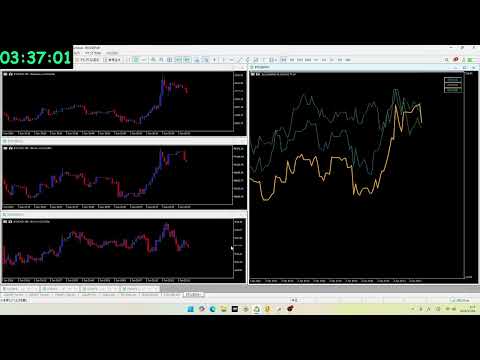
We have fundamentally redesigned the chart rendering system, fully migrating to a custom Canvas engine. This achieves an ultra-high-speed response equivalent to a raw tick chart, a level of performance impossible for standard indicators.
■ Key Updates:
-
Evolution to Canvas Rendering By minimizing the rendering load to the extreme, every micro-movement of each tick is captured in real-time. Experience a "silky smooth" interface with zero lag.
-
Advanced Smoothing Functionality Newly equipped with a smoothing feature to filter out market noise and reveal true currency strength. Toggle calculation periods instantly via the dropdown menu to grasp trends from short-term to long-term at a glance.
-
Intuitive Symbol Flash Feature The signature "Symbol Selection & Flashing" feature has been preserved. Instantly identify your target currency from a complex web of lines without ever losing track.
Ideal for:
-
Scalpers where a one-second delay can be fatal.
-
Traders who want to visually capture volatility differences between currency pairs.
-
Power users who feel limited by standard MT5 functions and demand professional-grade tools.
This indicator is available for free until June 1, 2026.