Stackable VWAP
- Indicatori
-
Flavio Javier Jarabeck
 We are a closed brotherhood of traders whose ultimate goal is to profit through well-studied, structured, and automated trades. As a result, we publish dozens of MT5 indicators (FREE and paid) to the global MQL5 community. 80% of our published products are high-quality free indicators so beginner
 - Versione: 1.1
- Aggiornato: 6 giugno 2020
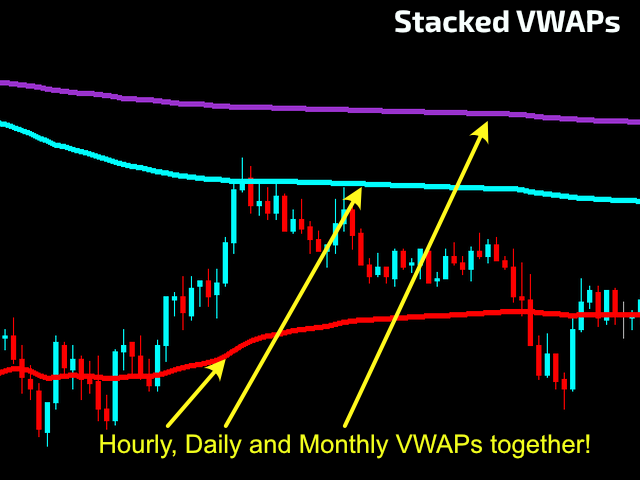
Volume Weighted Average Price (VWAP) is a trading benchmark commonly used by Big Players that gives the average price a Symbol has traded throughout the day. It is based on both Volume and price. Additionally we put in this indicator the MVWAP (Moving Volume Weighted Average Price).
For those who do not know the usage and the importance od this indicator I recommend a great article about this subject at Investopedia (https://www.investopedia.com/articles/trading/11/trading-with-vwap-mvwap.asp). We do not recommend to trade solely on this indicator. Use it as a one more tool in your toolbox to confirm Price and Market behaviour.
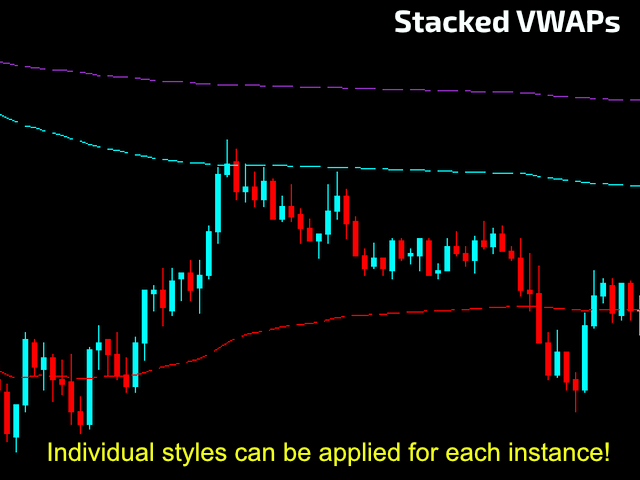
This version of the VWAP indicator is very flexible containing 4-type of timeframes that could be used simply by stacking the very same indicator within the same chart.
SETTINGS
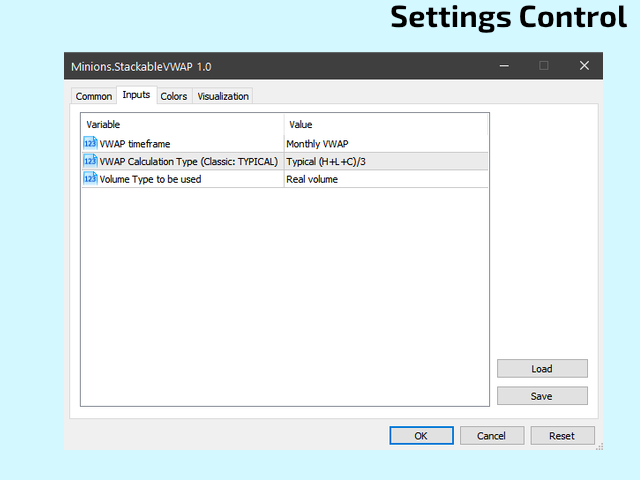
- VWAP Timeframe to use
- Choose the type of calculation of VWAP line. The classical method of calculation is TYPICAL: (H+L+C)/3
- Volume Type to use use in calculations (Real Volume or Ticks)
Looking for more FREE VWAP-related indicators, here you go:
If you like this indicator, all I am asking is a little Review (not a Comment, but a REVIEW!)...
This will mean A LOT to me... And this way I can continue to give away Cool Stuff for Free...
With No Strings Attached! Ever!
Live Long and Prosper!
;)


Muito obrigado por disponibilizar gratuitamente, indicador top, para identificar tendências e reversões