Upper and Lower Trendline mt5
- Indicatori
- Versione: 2.0
- Aggiornato: 5 settembre 2022
This indicator uses a different approach from the previous version to get it's trendlines. This method is derived from Orchard Forex, and the process of making the indicator is demonstrated in there video https://www.youtube.com/watch?v=mEaiurw56wY&t=1425s.
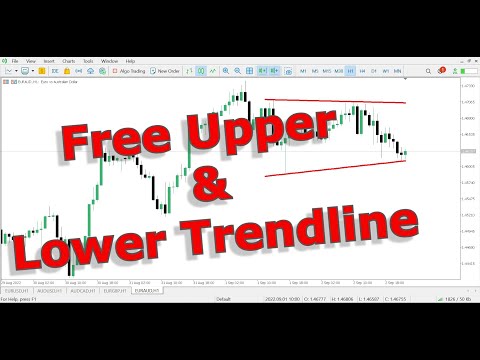
The basic idea behind this indicator is it draws a tangent line on the highest levels and lowest levels of the bars used for calculation, while ensuring that the lines don't intersect with the bars in review (alittle confusing? I know).
Let's dive into the practical side of things to get a better understanding. Skim through the photos, download the indicator and test it out for yourself to get a better feel of how it works.
Video description: https://youtu.be/eMDgL4BdYcc
For more free stuff: https://ABCtrading.xyz