Orderflow Absorption MT5

  • Indicatori
  • Chi Sum Poon
    Chi Sum Poon
    This is Gary Poon

    I will first study of trading on demo account then to real account.
    This is my only account on MQL5.com, I will not create another one for now.
    If there are any queries or concerns, please refer to the broker details from my signals.

    Thank you.
  • Versione: 1.3
  • Aggiornato: 17 dicembre 2025
  • Attivazioni: 5

OrderFlow Absorption – Indicatore professionale di Delta e Segnali di Assorbimento per MT5

Sblocca la potenza della vera analisi del flusso degli ordini con OrderFlow Absorption – l’indicatore definitivo di istogramma delta e segnali di assorbimento per MetaTrader 5. Progettato per i trader che vogliono vedere cosa succede davvero dietro ogni movimento di prezzo, questo strumento rivela la pressione nascosta di acquisto/vendita e gli eventi di assorbimento che muovono il mercato.

Caratteristiche

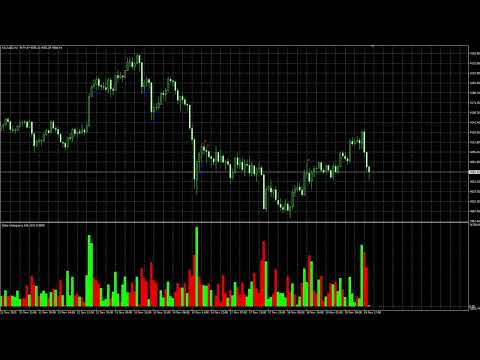
  • Visualizzazione istogramma delta: Visualizza istantaneamente la pressione di acquisto e vendita con istogrammi chiari e colorati.
  • Rilevamento segnali di assorbimento: Logica avanzata che identifica eventi di assorbimento rialzisti e ribassisti, avvisandoti in anticipo dei possibili cambi di tendenza.
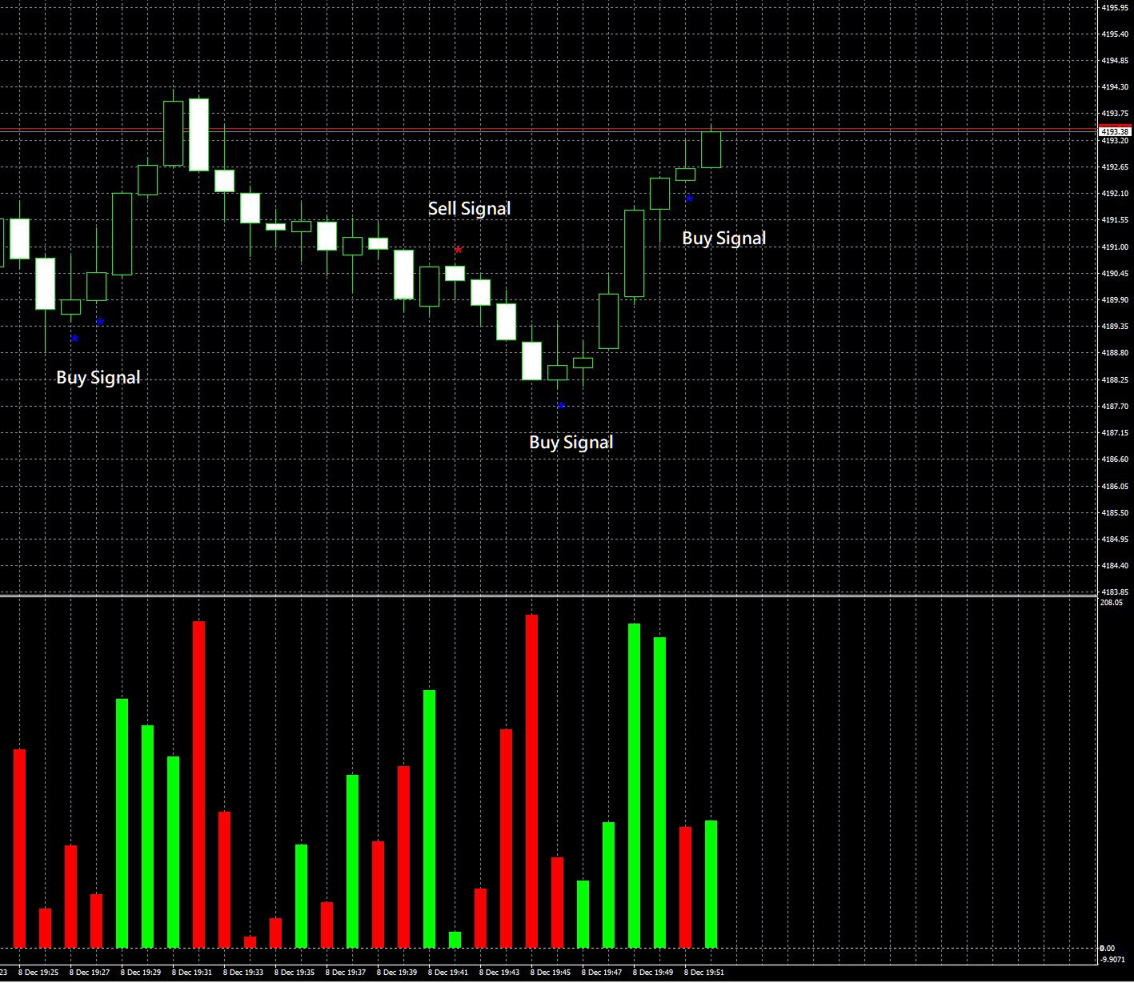
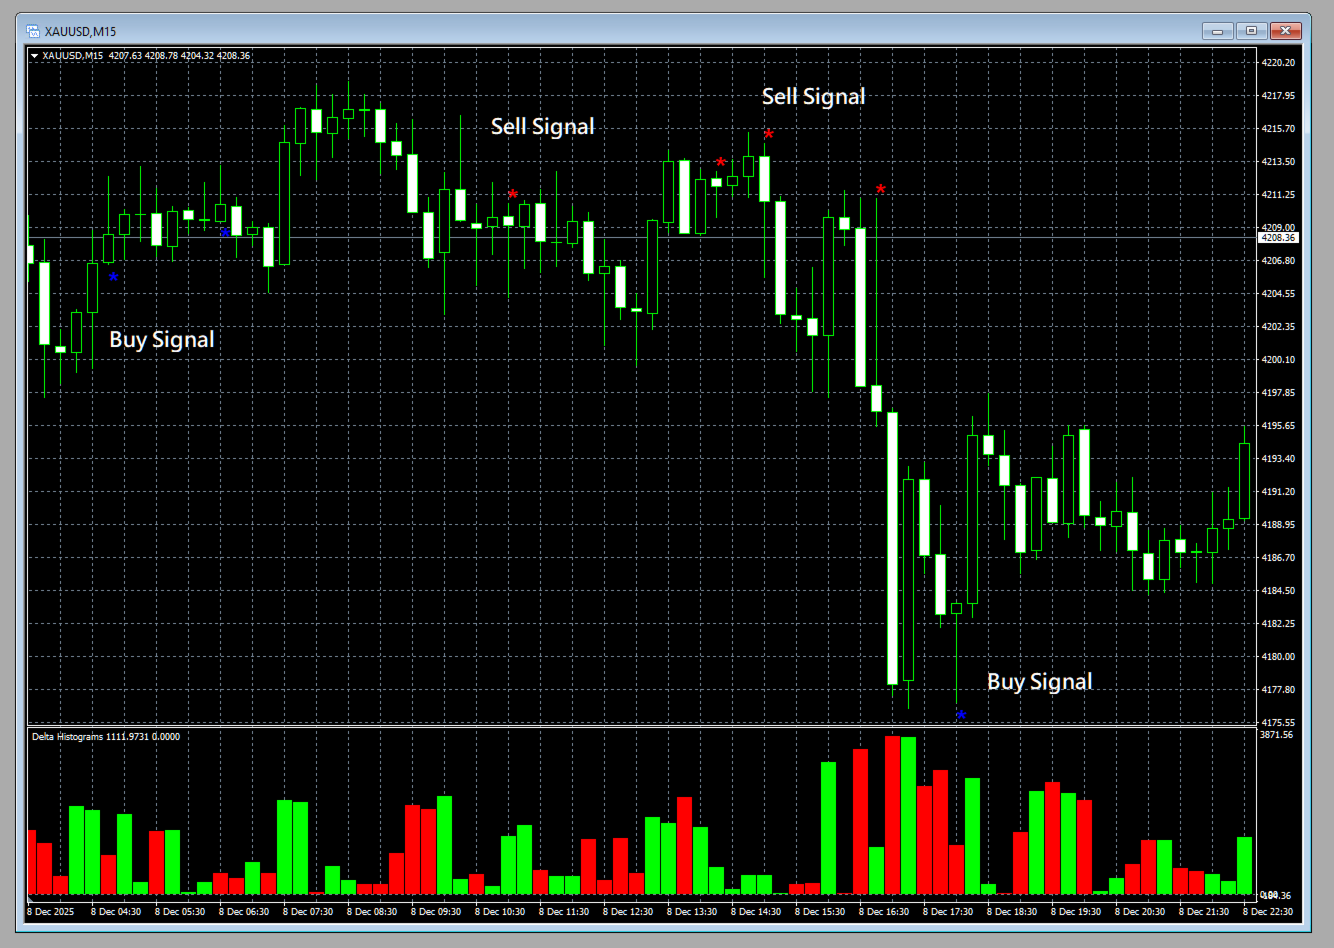
  • Marcatori sul grafico: I segnali di assorbimento sono segnati direttamente sul grafico per un facile riferimento visivo.
  • Avvisi popup: Ricevi notifiche in tempo reale quando compaiono nuovi segnali di assorbimento.
  • Soglie personalizzabili: Filtra i segnali deboli e concentrati solo sulle configurazioni ad alta probabilità.
  • Gestione delle risorse: Calcolo efficiente per prestazioni rapide, anche su grafici di grandi dimensioni.
  • Compatibile con tutti gli strumenti: Funziona su qualsiasi simbolo e timeframe, inclusi Forex, indici e materie prime.
  • Facile integrazione: Parametri semplici per una configurazione e regolazione rapide.

Logica di OrderFlow Absorption

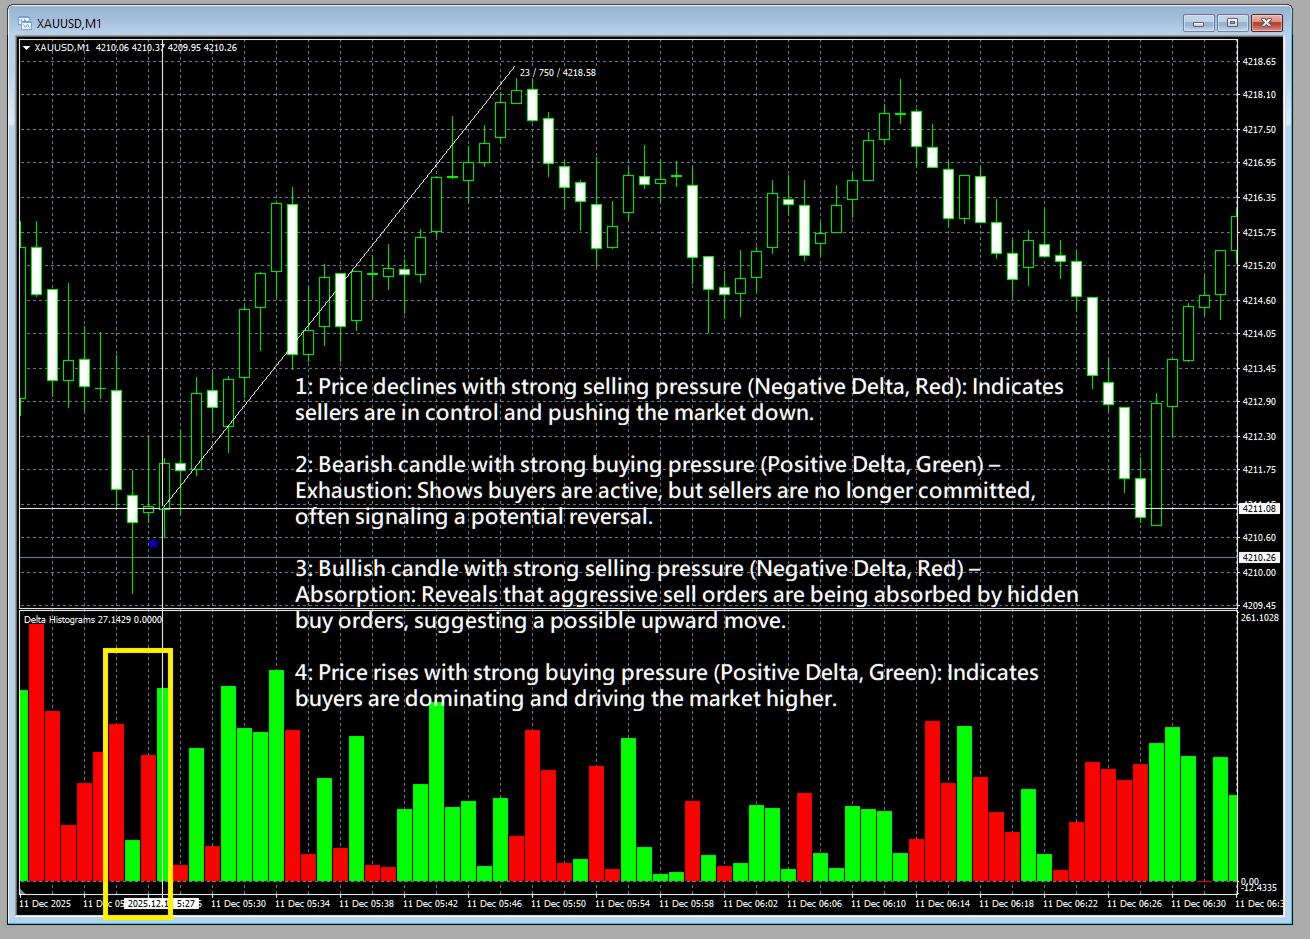
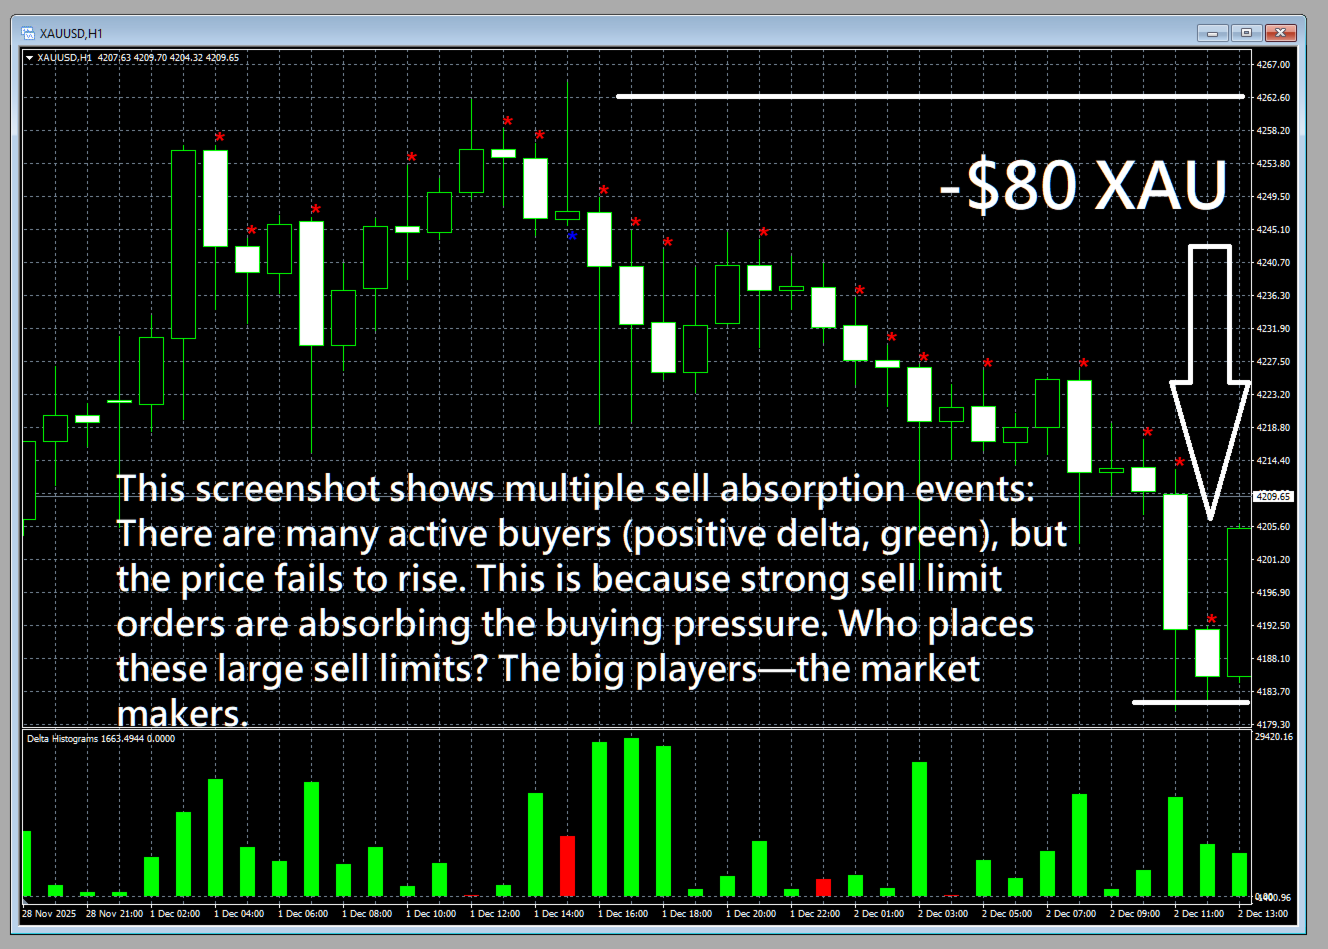
OrderFlow Absorption utilizza un algoritmo proprietario per stimare la pressione di acquisto e vendita (delta) di ogni barra, anche presso broker che non forniscono dati tick completi. Analizza volume, azione del prezzo, struttura della candela e lunghezza delle ombre per rilevare eventi di assorbimento nascosti: momenti in cui acquisti o vendite aggressive vengono assorbiti da grandi ordini contrari, spesso segnalando un’inversione o un movimento forte.

  • Assorbimento ribassista: Rilevato quando c’è forte pressione di acquisto (delta positivo) ma la candela chiude ribassista, indicando che i venditori hanno assorbito gli acquisti.
  • Assorbimento rialzista: Rilevato quando c’è forte pressione di vendita (delta negativo) ma la candela chiude rialzista, indicando che gli acquirenti hanno assorbito le vendite.

Questi segnali sono segnati sul grafico e possono attivare avvisi istantanei, così non perderai mai un evento di mercato importante.

Come si usa

  1. Aggiungi l’indicatore: Inserisci OrderFlow Absorption su qualsiasi grafico e timeframe.
  2. Regola le impostazioni: Imposta la soglia delta preferita e il numero di barre da analizzare.
  3. Osserva l’istogramma: Le barre verdi mostrano la pressione di acquisto, quelle rosse la pressione di vendita.
  4. Cerca segnali di assorbimento: I marcatori “*” sul grafico evidenziano gli eventi di assorbimento. Gli avvisi popup ti notificano immediatamente.
  5. Opera in modo più intelligente: Usa i segnali di assorbimento per individuare inversioni, confermare ingressi o evitare falsi breakout.

Provalo ora – Scarica la demo!

Sperimenta tu stesso la potenza di OrderFlow Absorption. Scarica la demo gratuita e scopri come può trasformare il tuo trading. Non perdere le opportunità di mercato nascoste – aggiungi OrderFlow Absorption al tuo arsenale oggi stesso!

OrderFlow Absorption – Scopri le vere intenzioni del mercato. Scarica la demo e opera con fiducia!


Prodotti consigliati
WickAndBody Volume Flow
Henry Armando Baltazar
WickAndBody Volume Flow v5.2 Order Flow Analysis through Candle Segmentation The WickAndBody Volume Flow is an advanced diagnostic tool for MetaTrader that allows traders to "see" inside every Japanese candlestick. Unlike conventional volume indicators, this algorithm utilizes Multi-Timeframe (MTF) technology to break down real volume and determine exactly how much capital was traded in the wicks versus the candle body . Key Features Volume Detection: Uses lower timeframe data (M1/M5) to reconst
FREE
Was: $249  Now: $99   Market Profile defines a number of day types that can help the trader to determine market behaviour. A key feature is the Value Area, representing the range of price action where 70% of trading took place. Understanding the Value Area can give traders valuable insight into market direction and establish the higher odds trade. It is an excellent addition to any system you may be using. Inspired by Jim Dalton’s book “Mind Over Markets”, this indicator is designed to suit the
L'indicatore costruisce le quotazioni attuali, che possono essere confrontate con quelle storiche e su questa base fanno una previsione del movimento dei prezzi. L'indicatore ha un campo di testo per una rapida navigazione fino alla data desiderata. Opzioni: Simbolo - selezione del simbolo che visualizzerà l'indicatore; SymbolPeriod - selezione del periodo da cui l'indicatore prenderà i dati; IndicatorColor - colore dell'indicatore; HorisontalShift - spostamento delle virgolette disegnate d
Price Magnet — Price Density and Attraction Levels Indicator Price Magnet is a professional analytical tool designed to identify key support and resistance levels based on statistical Price Density. The indicator analyzes a specified historical period and detects price levels where the market spent the most time. These zones act as “magnets,” attracting price action or forming a structural base for potential reversals. Unlike traditional Volume Profile tools, Price Magnet focuses on price-time d
ALIEN Dashboard
Youssef Esseghaiar
ALIEN DASHBOARD FULL EDITION – Professional ICT & Precision Trading Dashboard for MT5 ( HYBRID ENGINE ) Overview The   Alien Dashboard Full Edition   is a comprehensive, all‑in‑one technical indicator for MetaTrader 5 that merges the most powerful concepts from Inner Circle Trader (ICT) methodology with advanced precision‑entry logic, multi‑timeframe analysis, and an intuitive on‑chart dashboard. Designed for serious traders who want to visualise institutional order flow, identify high‑probabili
Here   our more valuable tools SMC Trend Trading   ,  Easy SMC Trading  ,  Institutional SMC Architect Volume Analysis Tools  ,  Volume flow Profile  ,  Market volume profile  , FVG with Volume  , Liquidity Heatmap Profile  ,  Volume Spread Analysis The    Liquidity Heatmap   is a sophisticated institutional trading tool designed to reveal where over-leveraged traders are trapped. By calculating estimated liquidation levels based on volume spikes and leverage, this indicator draws a dynamic "h
Delta Profile Volume
Teresinha Moraes Correia
Technical Description of the Indicator – Delta Profile for MetaTrader 5 The Delta Profile is an indicator developed for MetaTrader 5 focused on detailed analysis of volume flow within a defined range of candles. It organizes and displays information about the imbalance of positive volumes (associated with upward movements) and negative volumes (associated with downward movements) at different price levels. The result is a clear view of the chart points where the highest concentration of trades o
L'indicateur SMC Venom Model BPR est un outil professionnel pour les traders travaillant dans le concept Smart Money (SMC). Il identifie automatiquement deux modèles clés sur le graphique des prix: FVG   (Fair Value Gap) est une combinaison de trois bougies, dans laquelle il y a un écart entre la première et la troisième bougie. Forme une zone entre les niveaux où il n'y a pas de support de volume, ce qui conduit souvent à une correction des prix. BPR   (Balanced Price Range) est une combinaiso
Il livello Premium è un indicatore unico con una precisione superiore all'80% delle previsioni corrette! Questo indicatore è stato testato dai migliori Specialisti di Trading per più di due mesi! L'indicatore dell'autore che non troverai da nessun'altra parte! Dagli screenshot puoi vedere di persona la precisione di questo strumento! 1 è ottimo per il trading di opzioni binarie con un tempo di scadenza di 1 candela. 2 funziona su tutte le coppie di valute, azioni, materie prime, criptovalu
Market Profile 3 ForexArby com
Hussien Abdeltwab Hussien Ryad
4 (15)
Market Profile 3 MetaTrader 5 indicator  version 4.70— is a classic Market Profile implementation that can show the price density over time, outlining the most important price levels, value area, and control value of a given trading session. This indicator can be attached to timeframes between M1 and D1 and will show the Market Profile for daily, weekly, monthly, or even intraday sessions. Lower timeframes offer higher precision. Higher timeframes are recommended for better visibility. It is als
FREE
Order Book, known also as Market Book, market depth, Level 2, - is a dynamically updated table with current volumes of orders to buy and to sell specific financial instument at price levels near Bid and Ask. MetaTrader 5 provides the means for receiving market book from your broker, but in real time only, without access to its history. The indicator OrderBook Cumulative Indicator accumulates market book data online and visualizes them on the chart. In addition, the indicator can show the market
Volume Profile For MT5
Abdelkhabir Yassine Alaoui
Volume Profile VPVR per MT5 Volume Profile VPVR è un indicatore potente e performante per MetaTrader 5, progettato per replicare l'avanzato Volume Profile (Visible Range) direttamente sul grafico. Fornisce una visione approfondita della struttura del mercato, visualizzando le aree in cui si concentra l'attività di trading e aiutando i trader a identificare con precisione i livelli di prezzo chiave. Questo indicatore analizza dinamicamente la distribuzione dei volumi sui diversi livelli di pre
Mirror Chart MT5
Andrej Hermann
5 (1)
The Mirror Chart MT5 is a overlay indicator specifically designed to project a second financial instrument directly onto the main chart window. This tool is invaluable for traders who rely on correlation analysis, as it visualizes the price movements of two different instruments in real time. Unlike traditional overlays, this indicator utilizes intelligent, dynamic centering and scaling logic. It continuously analyzes the visible price range in the current window for both symbols and calculates
FREE
Mine Farm
Maryna Kauzova
Mine Farm is one of the most classic and time-tested scalping strategies based on the breakdown of strong price levels. Mine Farm is the author's modification of the system for determining entry and exit points into the market... Mine Farm - is the combination of great potential with reliability and safety. Why Mine Farm?! - each order has a short dynamic Stop Loss - the advisor does not use any risky methods (averaging, martingale, grid, locking, etc.) - the advisor tries to get the most
BoxChart MT5
Evgeny Shevtsov
5 (7)
The market is unfair if only because 10% of participants manage 90% of funds. An ordinary trader has slim changes to stand against these "vultures". This problem can be solved. You just need to be among these 10%, learn to predict their intentions and move with them. Volume is the only preemptive factor that faultlessly works on any timeframe and symbol. First, the volume appears and is accumulated, and only then the price moves. The price moves from one volume to another. Areas of volume accumu
Volume Profile Canvas - Professional Volume Profile Indicator for MetaTrader 5 DESCRIPTION Volume Profile Canvas is a professional volume profile indicator for MetaTrader 5 that renders directly on the chart using a high-performance Canvas engine. It calculates and displays the volume distribution across price levels, identifying the Point of Control (POC), Value Area High (VAH) and Value Area Low (VAL) in real time. This is a pure analysis tool. It does not trade. It gives you an instant vi
Binary Rise Fall
Israr Hussain Shah
Here   our more valuable tools SMC Trend Trading   ,  Easy SMC Trading  ,  Institutional SMC Architect Volume Analysis Tools  ,  Volume flow Profile  ,  Market volume profile  , FVG with Volume  , Liquidity Heatmap Profile  ,  Volume Spread Analysis The Fractals_Price indicator is a technical analysis tool that identifies fractal patterns on price charts. Fractals are recurring patterns that signal potential trend reversals or continuation points. This indicator marks both upward and downward
Indicatore Professionale di Monitoraggio Multi-Timeframe DESCRIZIONE DEL PRODOTTO Scanner 3 del Movimento è un indicatore per MetaTrader 5 che monitora simultaneamente 11 timeframe e identifica automaticamente uno specifico pattern di inversione a 3 candele. Con questo indicatore non è più necessario cambiare grafico manualmente. Tutto viene visualizzato in un unico pannello direttamente sullo schermo del tuo MT5. PRINCIPIO DI FUNZIONAMENTO Il Pattern delle Candele L’indicatore cerca un pa
VOLUME PROFILE SAF-XII Analisi Market Profile Professionale per MT5 (L'indicatore ideale per i trader che utilizzano strategie Grid) COS'È IL VOLUME PROFILE? Il Volume Profile è uno strumento istituzionale professionale che visualizza l'attività di trading a specifici livelli di prezzo, a differenza dei tradizionali indicatori di volume che mostrano il volume nel tempo. Rivela DOVE sono avvenuti gli scambi all'interno della finestra temporale scelta, aiutando a identificare: VALUE AREAS (VAH/VA
The   Visual Volatility Clustering   indicator clusters the market based on volatility. The indicator does not redraw and gives accurate data, does not use closing prices. Uses the opening prices or the highs or lows of the previous completed bar. Therefore, all information will be clear and unambiguous. The essence of the indicator is to divide the price market into certain areas according to a similar type of volatility. This can be done in any way. In this example, the indicator is configure
Volume Candle Indicator
Pablo Filipe Soares De Almeida
Istogramma del Volume Colorato per MetaTrader 5 Questo indicatore mostra il volume come un istogramma in una finestra separata. Le barre sono colorate in base alla direzione della candela: verde per rialzista (chiusura > apertura) e rosso per ribassista (chiusura < apertura). Funzionalità principali Fonte del volume: volume dei tick o volume reale (selezionabile). Linea di media mobile opzionale sopra l’istogramma del volume. Tipi di media supportati: SMA, EMA, SMMA, LWMA. Periodo medio configur
Here   our more valuable tools SMC Trend Trading   ,  Easy SMC Trading  ,  Institutional SMC Architect Volume Analysis Tools  ,  Volume flow Profile  ,  Market volume profile  , FVG with Volume  , Liquidity Heatmap Profile  ,  Volume Spread Analysis 2. Key Features Dynamic Filtering : The core feature. As soon as the current price crosses a historical liquidity level, that level disappears. This reduces chart clutter and prevents you from trading off "dead" support/resistance. Liquidity Heatma
Super Trend Live
Israr Hussain Shah
Here   our more valuable tools SMC Trend Trading   ,  Easy SMC Trading  ,  Institutional SMC Architect Volume Analysis Tools  ,  Volume flow Profile  ,  Market volume profile  , FVG with Volume  , Liquidity Heatmap Profile  ,  Volume Spread Analysis buy signal line and arrow to help you understand batter the direction sell signal line and arrow to help you understand batter the direction trade what you see not what you think this is an simple and best trading tool for our traders of any market
FREE
Weis Wave Scouter
Jean Carlos Martins Roso
Scopri la potenza dell'analisi avanzata del volume con Weis Wave Scouter, un indicatore rivoluzionario per MetaTrader 5 che combina i principi comprovati del metodo Wyckoff e dell'analisi VSA (Volume Spread Analysis). Progettato per trader che cercano precisione e profondità nelle loro operazioni, questo indicatore offre una lettura tattica del mercato attraverso l'analisi delle onde di volume cumulativo, aiutando a individuare punti chiave di inversione e continuazione di tendenza. Weis Wave Sc
No Demand No Supply MT5
Trade The Volume Waves Single Member P.C.
No Demand No Supply   This indicator identifies   No Demand –No Supply candles to your chart and plots volume bars colored according to the signal. It can be applied to all timeframes or to a specific one only. It can also be used as regular volume indicator  with exceptional future of WEIGHTED VOLUME. Furthermore is has an alert notification, sound and email when a signals occurs. The indicator does not repaint but the alert will come on two candles back due to the definition of No Demand No Su
Noize Absorption Index - is the manual trading system that measures the difference of pressure between bears forces and bulls forces. Green line - is a noize free index that showing curent situation. Zero value of index shows totally choppy/flat market.Values above zero level shows how powerfull bullish wave is and values below zero measures bearish forces.Up arrow appears on bearish market when it's ready to reverse, dn arrow appears on weak bullish market, as a result of reverse expectation.
Time and Sales Tick
Pablo Filipe Soares De Almeida
Time & Sales Tick Indicator è un indicatore per MetaTrader 5 che mostra i dati dei tick in tempo reale. Visualizza prezzo, volume dei tick e orario direttamente sul grafico. Funzionalità Mostra i dati dei tick, inclusi prezzo, volume e tempo, in un pannello sul grafico. Raggruppa i tick in intervalli definiti dall’utente, con colori distinti (verde per rialzo, rosso per ribasso). Il pannello può essere posizionato in qualsiasi angolo del grafico.
MR Volume Profile 5
Sergey Khramchenkov
The "MR Volume Profile 5" indicator is a charting tool that displays trading volume at different price levels rather than time intervals. A key concept in volume profile is the point of control (POC)—the price level with the highest volume traded during the session or time range. While tools like VWAP or OBV provide volume trends, the "MR Volume Profile 5" indicator offers granular detail about where the most market activity occurs at specific price levels. This makes it a more precise tool for
The indicator highlights the points that a professional trader sees in ordinary indicators. VisualVol visually displays different volatility indicators on a single scale and a common align. Highlights the excess of volume indicators in color. At the same time, Tick and Real Volume, Actual range, ATR, candle size and return (open-close difference) can be displayed. Thanks to VisualVol, you will see the market periods and the right time for different trading operations. This version is intended f
FREE
Cumulative Volume Delta MA-X MTF (con Gradient Momentum) Questo indicatore esegue un'analisi multi-timeframe del Delta del Volume Cumulativo (CVD) per MetaTrader 5. Calcola la differenza netta tra la pressione di acquisto e di vendita analizzando i dati del volume reale o dei tick, fornendo una rappresentazione visiva del sentiment del flusso degli ordini. Logica e Caratteristiche dell'Indicatore L'indicatore utilizza un approccio matematico per l'analisi del volume: Origine dei Dati: Supporta
Gli utenti di questo prodotto hanno anche acquistato
PrimeScalping
Temirlan Kdyrkhan
PrimeScalping is a powerful trading companion designed to generate high-probability entry signals with dynamic TP/SL/DP levels based on volatility. Built-in performance tracking shows win/loss stats, PP1/PP2 hits, and success rates — all updated live. Key Features: Buy/Sell signals with adaptive volatility bands Real-time TP/SL/DP levels based on ATR Built-in MA Filter with optional ATR/StdDev volatility Performance stats panel (Success, Profit/Loss, PP1/PP2) Alerts via popup, sound, push, or e
SignalTech is an unique fully rule based trading system delivers an Institutional approach for both Independent Traders and Prop Firm Challengers. Never Repaint. Push Notification available. No over-optimization. All the winning trades with chart setups are published on the comments page. 2026-05 4107 Pips (Until 05-29 NY Closed) 2026-04 2243 Pips 2026-03 2165 Pips 2026-02 2937 Pips 2026-01 2624 Pips 2025-12 1174 Pips It can generate signals with Buy/Sell Arrows, Push Notification (To Mobile) an
ARIPoint
Temirlan Kdyrkhan
1 (1)
ARIPoint is a powerful trading companion designed to generate high-probability entry signals with dynamic TP/SL/DP levels based on volatility. Built-in performance tracking shows win/loss stats, PP1/PP2 hits, and success rates all updated live. Key Features: Buy/Sell signals with adaptive volatility bands Real-time TP/SL/DP levels based on ATR Built-in MA Filter with optional ATR/StdDev volatility Performance stats panel (Success, Profit/Loss, PP1/PP2) Alerts via popup, sound, push, or email Cu
Azimuth Pro
Ottaviano De Cicco
5 (7)
Azimuth Pro V2: Synthetic Fractal Structure and Confirmed Entries for MT5 Overview Azimuth Pro is a multi-level swing structure indicator by Merkava Labs . Four nested swing layers, swing-anchored VWAP, ABC pattern detection, three-timeframe structural filtering, and closed-bar confirmed entries — one chart, one workflow from micro-swings to macro-cycles. This is not a blind signal product. It is a structure-first workflow for traders who care about location, context, and timing. V2 Launch Offe
SmartScalping
Temirlan Kdyrkhan
SmartScalping is a powerful trading companion designed to generate high-probability entry signals with dynamic TP/SL/DP levels based on volatility. Built-in performance tracking shows win/loss stats, PP1/PP2 hits, and success rates — all updated live. Key Features: Buy/Sell signals with adaptive volatility bands Real-time TP/SL/DP levels based on ATR Built-in MA Filter with optional ATR/StdDev volatility Performance stats panel (Success, Profit/Loss, PP1/PP2) Alerts via popup, sound, push, or e
ScalpPoint
Temirlan Kdyrkhan
ScalpPoint is a powerful trading companion designed to generate high-probability entry signals with dynamic TP/SL/DP levels based on volatility. Built-in performance tracking shows win/loss stats, PP1/PP2 hits, and success rates — all updated live. Key Features: Buy/Sell signals with adaptive volatility bands Real-time TP/SL/DP levels based on ATR Built-in MA Filter with optional ATR/StdDev volatility Performance stats panel (Success, Profit/Loss, PP1/PP2) Alerts via popup, sound, push, or emai
Gladiator Indicator: Conquer the Markets Step into the trading arena with the Gladiator Indicator, a robust and highly effective trading tool designed exclusively for MQL5. Built for traders who want clear, actionable insights, Gladiator cuts through market noise to deliver precise Buy and Sell signals right on your charts. Whether you are a beginner looking for guidance or an experienced trader seeking a reliable confirmation tool, Gladiator provides the edge you need to battle the markets wi
TrendProMaster
Temirlan Kdyrkhan
MasterTrend Indicator for MT5 A powerful trend-following and signal-evaluation tool MasterTrend   is a custom MT5 indicator that combines Moving Averages and ATR-based risk/reward logic to generate clear buy/sell signals. It visualizes dynamic SL/TP levels, evaluates past trade outcomes, and displays win/loss statistics in a clean on-chart panel. Key features include: Buy/Sell signals based on MA crossovers ATR-based SL/TP1/TP2/TP3 levels with visual lines and labels Signal outcome tracking wit
MasterTrend
Temirlan Kdyrkhan
MasterTrend Indicator for MT5 A powerful trend-following and signal-evaluation tool MasterTrend   is a custom MT5 indicator that combines Moving Averages and ATR-based risk/reward logic to generate clear buy/sell signals. It visualizes dynamic SL/TP levels, evaluates past trade outcomes, and displays win/loss statistics in a clean on-chart panel. Key features include: Buy/Sell signals based on MA crossovers ATR-based SL/TP1/TP2/TP3 levels with visual lines and labels Signal outcome tracking wit
Meravith MT5
Ivan Stefanov
5 (1)
Strumento per market maker. Meravith: Analizzerà tutti i timeframe e mostrerà il trend attualmente in corso. Evidenzierà le zone di liquidità (equilibrio dei volumi) dove i volumi rialzisti e ribassisti sono uguali. Mostrerà tutti i livelli di liquidità dei diversi timeframe direttamente sul grafico. Genererà e presenterà un’analisi di mercato testuale a scopo di riferimento. Calcolerà obiettivi, livelli di supporto e punti di stop-loss in base al trend attuale. Calcolerà il rapporto rischio/ren
OmniSync Projection
Antonio-alin Teculescu
5 (1)
Chronos Fractal Engine is an innovative price projection indicator for MetaTrader 5, designed to transform your technical analysis by intelligently identifying and projecting historical price patterns. Built upon an advanced correlation algorithm and the fractal principles of the market, this powerful tool visualizes potential future price movements, giving you a unique edge in your trading decisions. What is Chronos Fractal Engine? At its core, the Chronos Fractal Engine employs a sophisticat
ARICoins
Temirlan Kdyrkhan
ARICoin is a powerful trading companion designed to generate high-probability entry signals with dynamic TP/SL/DP levels based on volatility. Built-in performance tracking shows win/loss stats, PP1/PP2 hits, and success rates all updated live. Key Features: Buy/Sell signals with adaptive volatility bands Real-time TP/SL/DP levels based on ATR Built-in MA Filter with optional ATR/StdDev volatility Performance stats panel (Success, Profit/Loss, PP1/PP2) Alerts via popup, sound, push, or email Cust
AriX
Temirlan Kdyrkhan
1 (4)
AriX Indicator for MT5 A powerful trend-following and signal-evaluation tool AriX is a custom MT5 indicator that combines Moving Averages and ATR-based risk/reward logic to generate clear buy/sell signals. It visualizes dynamic SL/TP levels, evaluates past trade outcomes, and displays win/loss statistics in a clean on-chart panel. Key features include: Buy/Sell signals based on MA crossovers ATR-based SL/TP1/TP2/TP3 levels with visual lines and labels Signal outcome tracking with real-time stat
CGE Trading Suite
Carl Gustav Johan Ekstrom
5 (2)
Institutional-Grade Analytics for MT5 C GE Trading Suite delivers the analytical edge typically reserved for professional trading desks. The platform integrates a full suite of analytical tools into one seamless workflow: dynamic grid mapping, liquidity behavior analysis, ECM, trend lines, MIDAS, trade cycles, and directional channel projections. Together, these provide a unified view of market structure and momentum. Directional clarity is further enhanced by the capital flow index, which meas
First time on MetaTrader, introducing IQ Star Lines - an original Vedic Astrology based indicator. "Millionaires don't use astrology, billionaires do" . - J.P. Morgan, Legendary American financier and banker. Welcome to  the new and updated  IQ Star Lines , the ultimate fusion of ancient planetary harmonic cycles and modern quantitative trading. published for the   first time on Metatrader. This is an indicator built by the developer, who has spent almost 2 decades trading while studying Vedic
Big Player Range
Thalles Nascimento De Carvalho
5 (3)
BigPlayerRange – Il miglior indicatore per MT5 BigPlayerRange è considerato il miglior indicatore per Mini Indice e Mini Dollaro su MetaTrader 5. Questo strumento essenziale evidenzia le zone strategiche di azione dei grandi player, offrendo un’analisi tecnica istituzionale di altissima precisione. Come usare BigPlayerRange: Questo indicatore mostra zone di acquisto (linea verde) e di vendita (linea rossa). Quando il prezzo chiude fuori da queste aree, è probabile un movimento di tendenz
Rilevatore intelligente multistrato di breakout e pullback per MetaTrader 5 "Intelligente. Semplice. Veloce!" Sei stanco di perdere entrate su breakout ad alta probabilità? Passi ore a scansionare più grafici, cercando di allineare i breakout con la direzione del trend e il momentum delle valute — solo per perdere il movimento? Break Pullback risolve tutto questo con un solo indicatore. Cos'è Break Pullback? Break Pullback è un indicatore MetaTrader 5 di livello professionale, progettato speci
L'indicatore " Dynamic Scalper System MT5 " è progettato per il metodo di scalping, ovvero per il trading all'interno di onde di trend. Testato sulle principali coppie di valute e sull'oro, è compatibile con altri strumenti di trading. Fornisce segnali per l'apertura di posizioni a breve termine lungo il trend, con ulteriore supporto al movimento dei prezzi. Il principio dell'indicatore. Le frecce grandi determinano la direzione del trend. Un algoritmo per generare segnali per lo scalping sott
Triple Crox Strategy v4.10 Triple Crox Strategy v4.10 Professional MetaTrader 5 Indicator 13 Patterns • Fibonacci • CLUSTER ML • Multi-Filter 1. Overview Advanced MT5 indicator combining 13 Pattern Detection , Fibonacci Analysis , CLUSTER Machine Learning and Multi-Filter system for precise signals on Forex, indices, commodities, crypto. 5-step pipeline: indicators → filter → patterns → signals → levels. 2. Trading Setup Heikin-Ashi colored bars. Buy/Sell arrows with Entry, TP1(1x ATR), TP2(2x
The Zain GOLD indicator
Haitham Gamal Abdelnaser Mohamed
Specializing in (All brokers supported): Professional Trading Tools Want the same tools used by professional traders? Get them now and start dominating the markets! Join our premium communities for free: Specializing in (All brokers supported): Gold (XAUUSD) - Unmatched accuracy Forex Pairs - Comprehensive global market coverage Binary Options - Highly accurate signals ️ Synthetic Derivatives - Trade pairs using Drive Cryptocurrencies - Professional cryptocurrency trad
Hidden Trend Channel Project 17 Tool SPECIAL NOVEMBER SALE is now finished. Price goes back to normal.  This is an Automated Tool for Multi Timeframe Trend Channel Analysis Visualization with Intelligent Range Market, Trending Market, Reversal, Breakout Detection.  It draws multiple Trend Channels with multiple sub-trendlines levels inside the channel for perfectly give you the trader, the crystal clear Trend channels where price trend direction is moving. This tool is accurately useful for T
Btcusd Pro
Metin Erkamoglu
BTCUSD PRO Signal Solution for MT5 BTCUSD PRO is a decision-support indicator for MetaTrader 5, designed for traders who analyze BTCUSD or BTCUSD# with a structured signal workflow. The product is not an automated trading system. It does not open, close, or manage trades automatically. It provides analytical buy and sell signal information and displays a visual trade plan on the chart so the user can make their own trading decisions. Main purpose BTCUSD PRO is designed for traders who prefe
Aiuta a determinare se questo punto è adatto per acquistare. Aiuta a determinare se questo punto è adatto per vendere. Quando tutti e quattro gli indicatori raggiungono contemporaneamente il fondo, occorre concentrarsi sulle opportunità di rimbalzo. Quando tutti e quattro gli indicatori si trovano contemporaneamente nella parte alta, occorre concentrarsi sulle opportunità di ribasso. Questo sistema è costruito sulla base di avanzate tecnologie algoritmiche cinesi e di una struttura di modellazio
ZIVA Signal Intelligence
Hassan Abdullah Hassan Al Balushi
ZIVA Signal Intelligence An Adaptive, Modular Market Intelligence System ZIVA Signal Intelligence is not positioned as a conventional trading indicator. It is a fully integrated, proprietary market intelligence system engineered to deliver structured, high-precision interpretation of price behavior within a controlled analytical environment. Developed through an independent architectural approach, ZIVA does not rely on, derive from, or replicate existing indicators. It represents a standalone
"Manual channel drawing? Not anymore. Let the market structure reveal itself automatically." "Track long-term price zones 24/7, in real-time." Real Trader Pain Points Identifying pivot points manually takes   huge time   and   effort Difficult to adapt to   high volatility   and pinpoint   reliable channels Copy Ideas "Markets never sleep. Why should your analysis stop?" "Dozens of assets a day—how do you keep up?" Core Claim AutoChannels   automatically reads market structure , reducin
==================================================================== SMC Pro v6.1 APEX AI — XAUUSD Gold Empire MetaTrader 5 Indicator · Smart Money Concepts · Predictive Intelligence Engine ==================================================================== SMC Pro v6.1 APEX AI is a professional Smart Money Concepts indicator system built exclusively for XAUUSD (Gold) on MetaTrader 5. It combines the complete SMC framework — Order Blocks, Liquidity sweeps, Fair Value Gaps, Break of Structure,
Gold Xausd Hunter
Metin Erkamoglu
5 (1)
MATADOR GOLD XAUUSD M5 Scalp Signals for MT5 MATADOR GOLD is a decision-support indicator for MetaTrader 5, designed for traders who analyze short-term Gold movement on the M5 timeframe. The indicator does not open, close, or manage trades automatically. It provides buy and sell signal guidance so the user can make their own trading decisions according to their risk plan, broker conditions, and trade management rules. Main purpose MATADOR GOLD is built to help traders avoid noisy signal flow and
Assembler
Darko Licardo
5 (1)
Introducing Assembler:  The best value for money,  Designed for advanced traders and professionals, yet accessible for ambitious beginners ready to elevate their trading game. Great for ICT, SMC, TREND and breakout traders . Combining advanced analytics, a sleek graphical interface, and highly customizable features, Assembler empowers you to trade with precision, clarity, and confidence. Key Features of Assembler 1. Dynamic Graphical User Interface (GUI): A fully draggable, customizable interf
SunSignal ML — AI Gold Signals with Multi-Timeframe Confluence SunSignal ML is an advanced AI-powered signal indicator purpose-built for XAUUSD gold trading. It combines a proprietary adaptive trend algorithm with six machine learning models trained on confirmed price pivots to produce high-confidence entry signals with multi-timeframe validation. The indicator runs efficiently on M1, M5 and M15 timeframes and is designed for traders who want precision entries guided by data rather than guesswor
FX Analysis is an all-in-one MT5 indicator dashboard that combines eight analytical tools in a single panel, helping traders identify high-probability setups without switching between charts or indicators. Designed for standard forex pairs on MetaTrader 5. Best results on M15 - H4 timeframes when all components are used together as part of the included workflow. Components Volatility Analyzer Displays historical average movement by hour and by day of the week. A real-time Pip Balance shows the
Altri dall’autore
Flat Reminder Overview Flat Reminder is a powerful technical analysis tool that identifies and highlights price consolidation zones on your chart. It detects when price action slows down and moves sideways, indicating potential reversal points, continuation setups, or key decision zones in the market. Key Features Consolidation Detection : Automatically identifies flat price zones where market momentum decreases Range Measurement : Calculates and displays the exact range of each consolidation in
FREE
MA Reminder Overview MA Reminder is a versatile moving average indicator that provides visual cues and background coloring to help traders identify trend direction and potential trading opportunities based on MA crossovers. Key Features Multiple Moving Averages : Displays up to 4 configurable moving averages on the chart Background Coloring : Highlights chart background based on MA1 and MA2 crossovers Timeframe Flexibility : Choose between dynamic (follows chart timeframe) or fixed timeframe mod
FREE
Key Zone
Chi Sum Poon
Please refer to full version: https://www.mql5.com/en/market/product/140908 Key Zone Detector Key Level Supply & Demand Zone Detector   Overview A sophisticated supply and demand zone detection indicator that identifies and rates key price levels where significant market activity occurs. The indicator uses fractal analysis and multiple validation methods to detect and classify trading zones. Key Features Zone Detection Auto-detects support and resistance zones Uses dual fractal system (fast and
FREE
大家睇住冬令夏令時間呀~ MEDIAN = (High + Low)/2 TYPICAL = (High + Low + Close)/3 WEIGHTED =   (High + Low + Close + Open)/4 --------------------- 附上自己用緊的 Setting, 不代表是最好的, 還需大家反饋 附上真倉紀錄, 全部EA入市, 但出市我成日手動, 但手動的效果欠佳, 應該信EA的... 附上今日2024/2/23的Cap圖, 16727.44追升, 16819.28手動平左, 高位~16895,  有進步空間的 --------------------- Min distance 係咩 ? Check time同Ordertime相距的距離 原意係, 兩個價差唔多即係冇方向, 就唔開單 用呢個最少距離可以只做大單邊 Checktime恆指16000 最少距離10000 <- 100點 Ordertime 16100以上/15900以下先會開 其他都當佢橫行唔玩 --------------------- -Check time means r
MTF Parabolic SAR S11
Chi Sum Poon
5 (1)
附上20240307市況, 順勢加單真開心 附上20240306市況, 順勢加單真開心 ※ ※ ※ This configuration is extremely aggressive and extremely risky. Please conduct your own backtesting and adjust it to a suitable risk level. ※ ※ ※ Additionally, please share the configuration and EA modification requirements with me. ※ ※ ※ ※ This EA trades based on the multi-time frame Parabolic SAR indicator. E.G. if there still a buy signal on the M15 timeframe SAR, In the M1 timeframe, the EA will execute a buy trade when M1 SAR buy signal.
---Bar Open Time Trading--- Most of the EA in the market, it is often the case that trades are executed at the beginning of each bar, known as "Per Bar." We can infer the future trend in the first few seconds of each bar. Let the bullets fly! This EA compares the opening price of each bar with the price "after a few seconds" to make trades. This EA is suitable for all markets, including gold, indices, forex, and more. Let's explore different strategies for various markets and time periods. Have
What goes to the extreme must reverse; what goes to the negative will bring prosperity. This EA captures technical rallies when there are consecutive bearish (bullish) candles making new lows (highs). It buys on the upward reversal when a consecutive bearish candle starts to retrace from a low position. It sells on the downward reversal when a consecutive bullish candle starts to retrace from a high position. === 物極必反、否極泰來 此 EA 捕捉連續陰(陽)燭創新低(高)時的技術性反彈(Technical Rally) 在 連續陰 燭 低位 回調開始時反手買升 在 連續
Raging Demon This EA can place stop orders on both sides up to 1 second before the news release. Please try the demo live version yourself to see what happens first. Use it at your own risk; I do not recommend gambling. The screenshots show actual results from the U.S. non-farm payroll data. It's all real. I tried it three times before daring to share it. It is possible to lose. But winning once can offset 4-5 losses. You can trade major news events on Friday at 8:30(HKT). I've traded CPI, I
BallBallG
Chi Sum Poon
BallBallG L'Expert Advisor (EA) BallBallG sfrutta una combinazione di indicatori tecnici per prendere decisioni di trading informate. Utilizza principalmente l'ADX (Indice Direzionale Medio) e le sue tendenze in aumento/diminuzione, la differenza tra DI+ e DI-, l'RSI (Indice di Forza Relativa) e l'indicatore Parabolic SAR. Questa strategia è applicata su sei diversi intervalli di tempo per aumentare la robustezza e la precisione. Caratteristiche Principali: Strategia Basata sugli Indicatori : Le
Mad Max T
Chi Sum Poon
Mad Max This EA trades based on the ADX, ADX rising/falling, Di+ and Di- difference, RSI, 5-timeframe 6-MA, total 30 MAs indicators, and their difference. Can trade single bets, can trade Martingale. This EA is suitable for all markets, including gold, indices, forex, and more. ====== 瘋狂麥斯 此EA跟據 ADX, ADX 升緊/跌緊, Di+ 和 Di- Difference, RSI, 5 個 TimeFrame 6 條 MA 指標共30條MA, 和它們的相差 作出交易; 可玩單注, 可玩馬丁 此EA適用於所有市場, 黃金, 指數, 外匯......
Ichiichiichiku This EA trades based on the ADX, ADX rising/falling, Di+ and Di- difference, RSI, 5-timeframe 2-ichimoku conversion, base line, total 10 MAs indicators. Can trade single bets, can trade Martingale. This EA is suitable for all markets, including gold, indices, forex, and more. ====== 一齊一齊一齊沽 此EA跟據 ADX, ADX 升緊/跌緊, Di+ 和 Di- Difference, RSI, 5 個 TimeFrame 2 條 ichimoku conversion, base line 指標共10條MA, 作出交易; 可玩單注, 可玩馬丁 此EA適用於所有市場, 黃金, 指數, 外匯......
YinYang Marty This EA trades based on 2-timeframe ADX, ADX rising/falling, Di+ and Di- difference, RSI indicators. Martin Rule: Only open a Buy order when the previous candlestick is bullish; Only open a Sell order when the previous candlestick is bearish. Can trade single bets, can trade Martingale. This EA is suitable for all markets, including gold, indices, forex, and more. ====== 陰陽馬丁 此EA跟據 2 個 TimeFrame ADX, ADX 升緊/跌緊, Di+ 和 Di- Difference, RSI, 作出交易; 馬丁單限制: 上支陽燭才可開Buy單; 上支陰燭才可開Sell單 可玩單注,
DarkGhost
Chi Sum Poon
DarkGhost DarkGhost è un EA (Expert Advisor) innovativo in singola scommessa che utilizza diversi indicatori tecnici per prendere decisioni di trading. Utilizza principalmente i seguenti indicatori per determinare il momentum: Il valore dell'Average True Range (ATR) Il valore dell'Average Directional Index (ADX) e la determinazione se l'ADX sta salendo o scendendo La differenza tra DI+ e DI- Questa strategia viene applicata su sei diversi frame temporali per aumentare la robustezza e l'accuratez
Rilevatore di Zone Chiave (Key Zone Detector) Rilevatore di Livelli di Offerta e Domanda (Key Level Supply & Demand Zone Detector) Panoramica (Overview) Un sofisticato indicatore di rilevamento delle zone di offerta e domanda che identifica e valuta i livelli di prezzo chiave in cui si verifica un'attività significativa del mercato. L'indicatore utilizza l'analisi frattale e più metodi di convalida per rilevare e classificare le zone di trading. Caratteristiche Principali (Key Features) Rileva
Energy X
Chi Sum Poon
EnergyX Indicator EnergyX is a unique tool that visualizes the "energy" of the market in a separate window. It helps you quickly see when energy is rising or falling, making it easier to spot potential trading opportunities. Yellow bars  show when energy is increasing. Red bars  show when energy is decreasing. How to Use: When price is approaching a  resistance  level: If energy is high and increasing (yellow), there is a higher chance the price will break the resistance. You may consider a  buy
OrderFlow Absorption – Indicatore professionale di Delta e Segnali di Assorbimento per MT4 Sblocca la potenza della vera analisi del flusso degli ordini con OrderFlow Absorption – l’indicatore definitivo di istogramma delta e segnali di assorbimento per MetaTrader 4. Progettato per i trader che vogliono vedere cosa succede davvero dietro ogni movimento di prezzo, questo strumento rivela la pressione nascosta di acquisto/vendita e gli eventi di assorbimento che muovono il mercato. Caratteristiche
Breakout Detector — Strumento avanzato per l’analisi della volatilità e il rilevamento dei breakout Descrizione Breakout Detector è un indicatore tecnico avanzato che identifica i periodi di bassa volatilità, i quali spesso precedono importanti breakout di prezzo. Questo indicatore combina il calcolo della volatilità di Parkinson con l’analisi RSI, aiutando i trader a individuare le opportunità di breakout prima che si verifichino. Problemi che risolve Breakout mancati : Quando ti accorgi del br
# TrendBoard - Dashboard Definitiva di Analisi Tecnica Multi-Timeframe **Trasforma il tuo trading con lo strumento di analisi delle tendenze più completo sul mercato!** ## **VERSIONE DI PROVA GRATUITA DISPONIBILE - Scarica e Testa Ora!** Sperimenta il potere dell'analisi tecnica di livello professionale a portata di mano. Scarica la versione di prova e scopri perché i trader la chiamano un "game-changer" per la loro strategia di trading. ## **Perché TrendBoard è Diverso** TrendBoard
KmeanSuperTrend – Indicatore SuperTrend Avanzato Alimentato da IA Sblocca il potere del trading adattivo con KmeanSuperTrend! Trasforma il tuo trading con il primo indicatore SuperTrend al mondo alimentato dalla tecnologia di clustering K-means IA. KmeanSuperTrend combina la metodologia SuperTrend comprovata con l'apprendimento automatico all'avanguardia per fornire una precisione senza precedenti nella rilevazione delle tendenze e nell'analisi di mercato. Caratteristiche Rivoluzionarie
CVD Divergenza Rilevazione - Analisi Avanzata del Delta Volume   IL PROBLEMA CHE RISOLVIAMO La maggior parte dei trader si affida esclusivamente all'azione del prezzo, perdendo informazioni cruciali sul flusso di volume che rivelano il vero sentiment del mercato. Gli indicatori tradizionali sono in ritardo rispetto ai movimenti di prezzo, causando entrate tardive e cattiva gestione del rischio. CVD Divergenza Rilevazione risolve questo analizzando la relazione tra prezzo e momentum del delta
Filtro:
Wan Suryolaksono
1946
Wan Suryolaksono 2026.05.23 05:51 
 

L'utente non ha lasciato alcun commento sulla valutazione.

Chi Sum Poon
2082
Risposta dello sviluppatore Chi Sum Poon 2026.05.23 05:52
thanks
Rispondi alla recensione