Orderflow Absorption MT5
- 지표
-
Chi Sum Poon
 This is Gary Poon
I will first study of trading on demo account then to real account.
This is my only account on MQL5.com, I will not create another one for now.
If there are any queries or concerns, please refer to the broker details from my signals.
Thank you. - 버전: 1.3
- 업데이트됨: 17 12월 2025
- 활성화: 5
OrderFlow Absorption – MT5용 전문 델타 & 흡수 신호 인디케이터
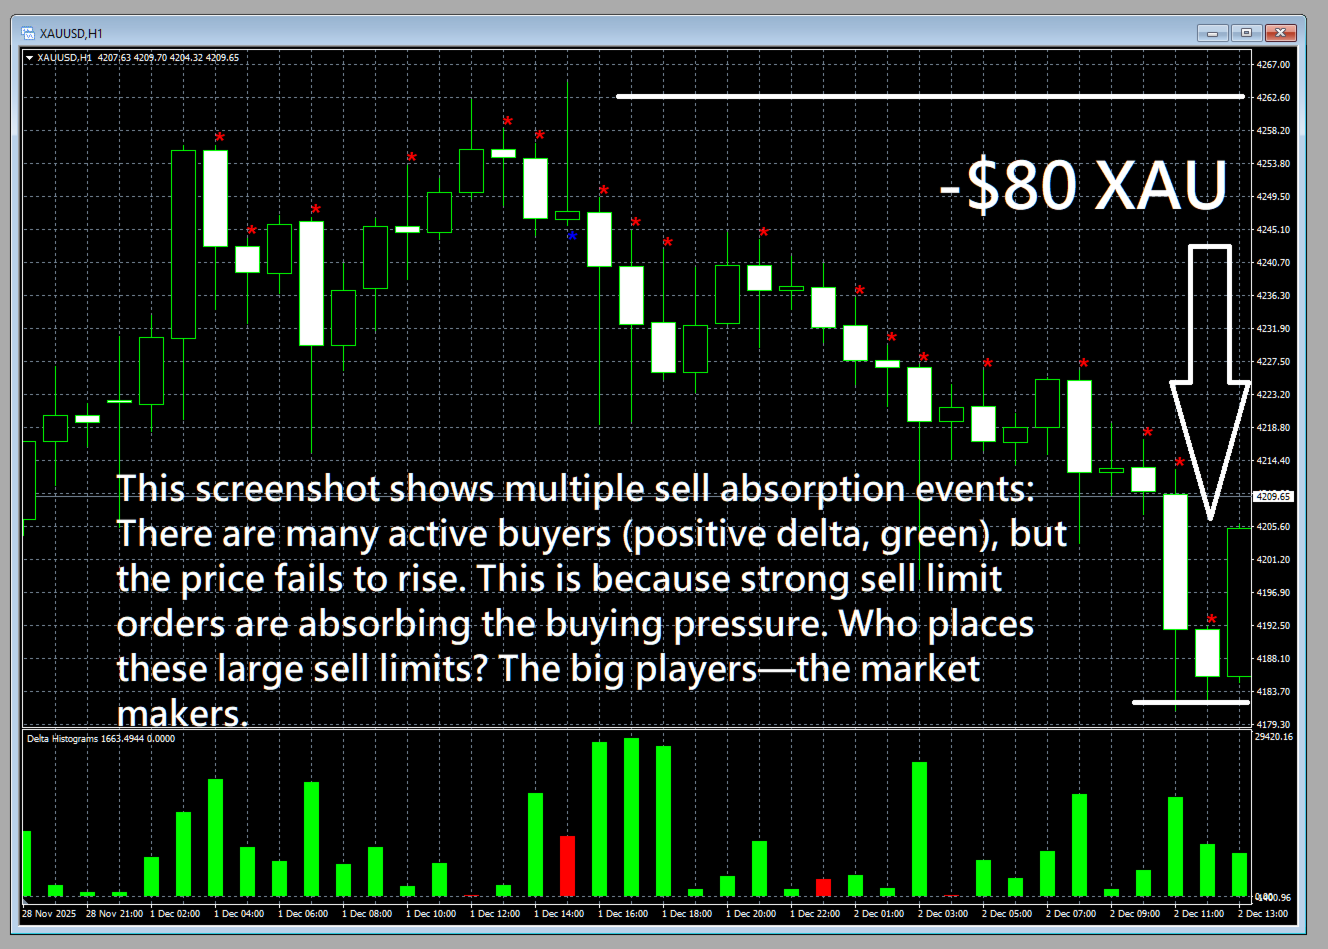
OrderFlow Absorption으로 진정한 오더플로우 분석의 힘을 경험하세요. MetaTrader 5를 위한 궁극의 델타 히스토그램 및 흡수 신호 인디케이터입니다. 가격 움직임의 이면에서 실제로 무슨 일이 일어나는지 알고 싶은 트레이더를 위해 설계된 이 도구는, 시장을 움직이는 숨겨진 매수/매도 압력과 흡수 이벤트를 드러냅니다.
주요 기능
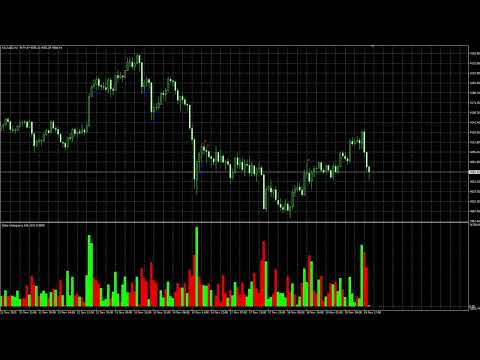
- 델타 히스토그램 시각화: 매수와 매도 압력을 색상별 히스토그램으로 즉시 확인할 수 있습니다.
- 흡수 신호 감지: 고급 로직으로 강세 및 약세 흡수 이벤트를 식별하여 반전 신호를 미리 알려줍니다.
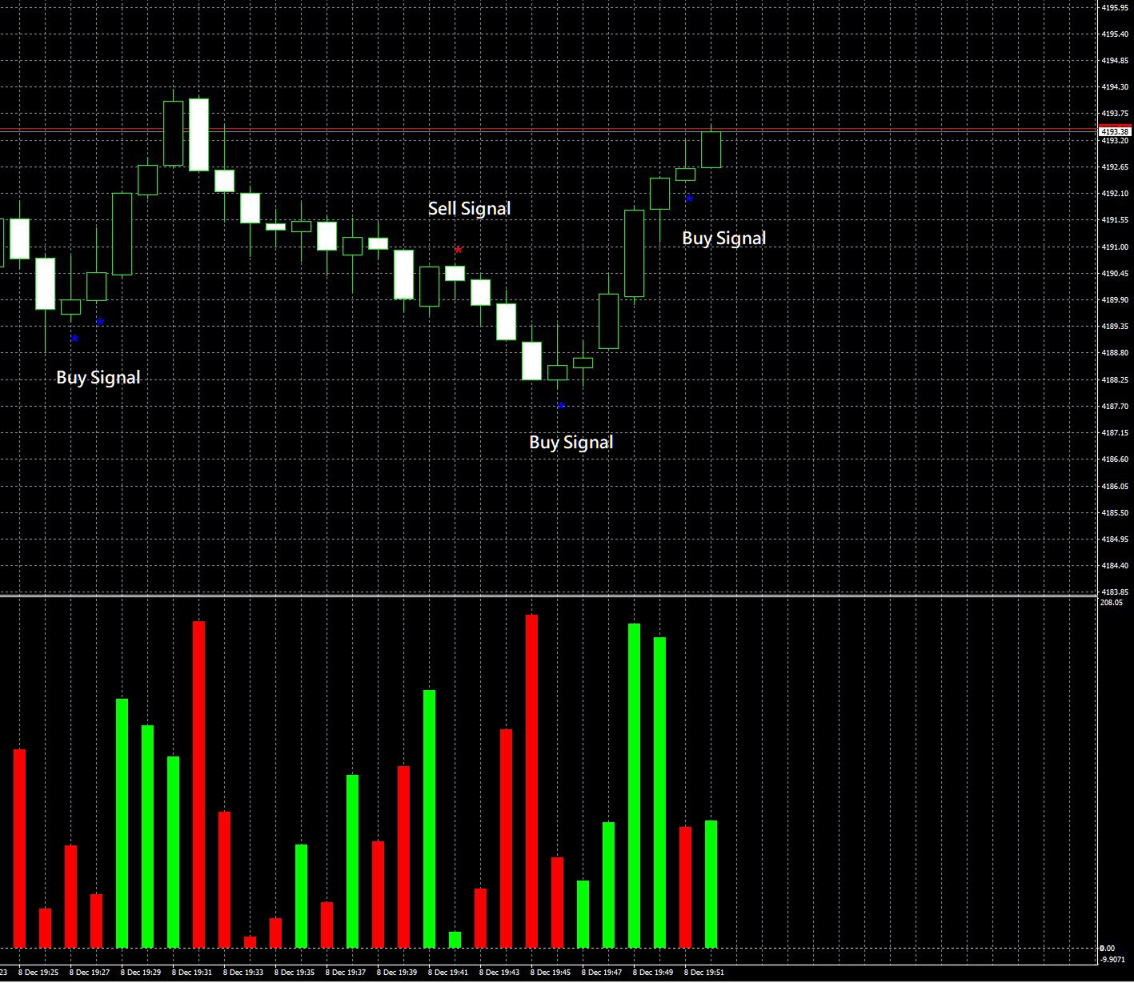
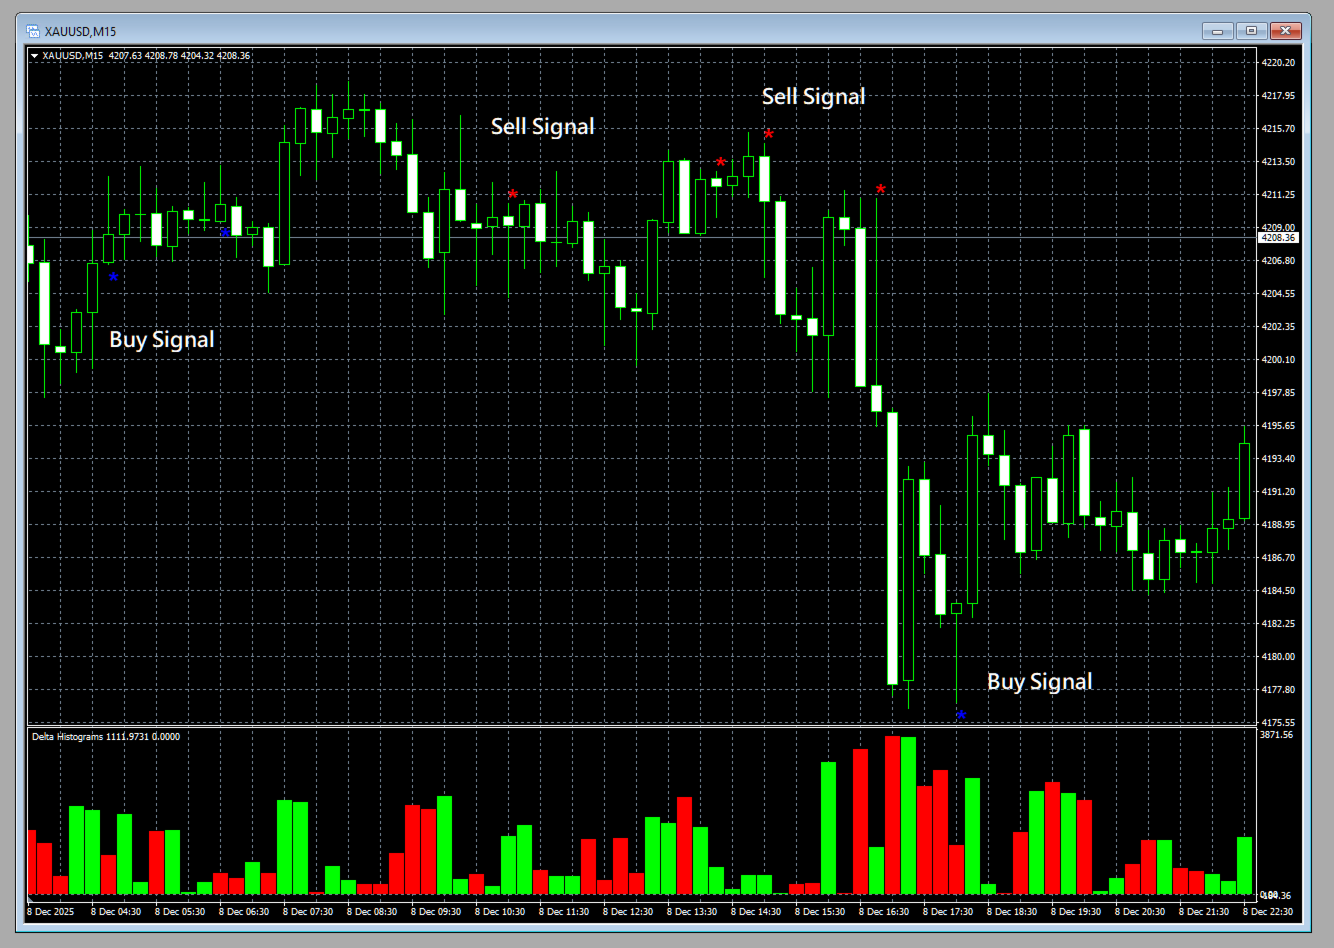
- 차트 마커: 흡수 신호가 차트에 직접 표시되어 시각적으로 쉽게 확인할 수 있습니다.
- 팝업 알림: 새로운 흡수 신호가 발생하면 실시간으로 알림을 받을 수 있습니다.
- 사용자 지정 임계값: 약한 신호는 필터링하고, 확률이 높은 기회에 집중할 수 있습니다.
- 리소스 관리: 대형 차트에서도 빠르게 동작하는 효율적인 계산 구조.
- 모든 종목 호환: 외환, 지수, 원자재 등 모든 심볼과 타임프레임에서 사용 가능.
- 간편한 통합: 간단한 입력 파라미터로 빠른 설정과 조정이 가능합니다.
OrderFlow Absorption의 논리
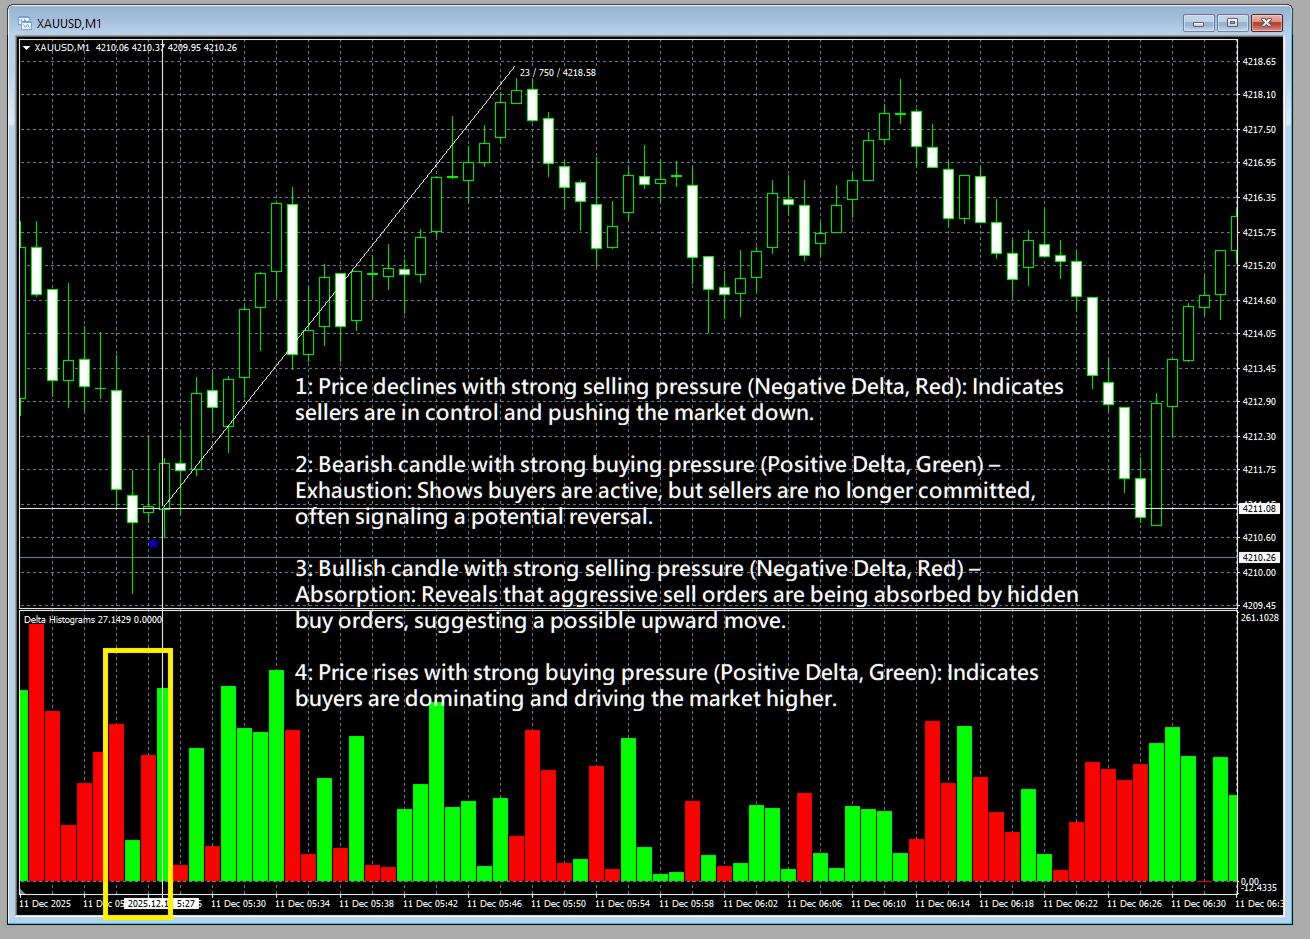
OrderFlow Absorption은 독자적인 알고리즘을 사용하여, 틱 데이터가 완전하지 않은 브로커에서도 각 봉의 매수/매도 압력(델타)을 추정합니다. 거래량, 가격 움직임, 캔들 구조, 꼬리 길이 등을 분석하여 숨겨진 흡수 이벤트—즉, 대량의 매수/매도 주문이 반대 대기 주문에 의해 흡수되는 순간—을 감지합니다. 이는 종종 반전이나 강한 움직임의 신호가 됩니다.
- 약세 흡수: 강한 매수 압력(양의 델타)이 있지만 캔들이 하락 마감하면, 매수세가 매도세에 흡수된 것으로 간주합니다.
- 강세 흡수: 강한 매도 압력(음의 델타)이 있지만 캔들이 상승 마감하면, 매도세가 매수세에 흡수된 것으로 간주합니다.
이 신호들은 차트에 표시되며, 즉시 알림을 통해 중요한 시장 이벤트를 놓치지 않도록 도와줍니다.
사용 방법
- 인디케이터 추가: OrderFlow Absorption을 원하는 차트와 타임프레임에 적용하세요.
- 설정 조정: 원하는 델타 임계값과 분석할 봉 개수를 설정하세요.
- 히스토그램 관찰: 녹색은 매수 압력, 빨간색은 매도 압력을 나타냅니다.
- 흡수 신호 확인: 차트의 "*" 마커가 흡수 이벤트를 표시합니다. 팝업 알림으로 즉시 확인할 수 있습니다.
- 스마트하게 트레이딩: 흡수 신호로 반전 포착, 진입 확인, 가짜 돌파 회피 등에 활용하세요.
지금 바로 체험해보세요 – 데모 다운로드!
OrderFlow Absorption의 강력함을 직접 경험해보세요. 무료 데모를 다운로드하고, 트레이딩이 어떻게 달라지는지 확인해보세요. 숨겨진 시장 기회를 놓치지 마시고, 지금 바로 OrderFlow Absorption을 여러분의 트레이딩 도구에 추가하세요!
OrderFlow Absorption – 시장의 진짜 의도를 파악하세요. 데모를 다운로드하고 자신 있게 트레이딩하세요!

Simply amazing! It help me with easiest ways to understand the behavior of the movement of big player!