Orderflow Absorption MT5

OrderFlow Absorption – Indicateur professionnel de delta et de signaux d’absorption pour MT5

Libérez la puissance de l’analyse réelle du flux d’ordres avec OrderFlow Absorption – l’indicateur ultime d’histogramme delta et de signaux d’absorption pour MetaTrader 5. Conçu pour les traders qui veulent comprendre ce qui se passe réellement derrière chaque mouvement de prix, cet outil révèle la pression d’achat/vente cachée et les événements d’absorption qui font bouger le marché.

Fonctionnalités

  • Visualisation de l’histogramme delta : Visualisez instantanément la pression acheteuse et vendeuse grâce à des histogrammes clairs et colorés.
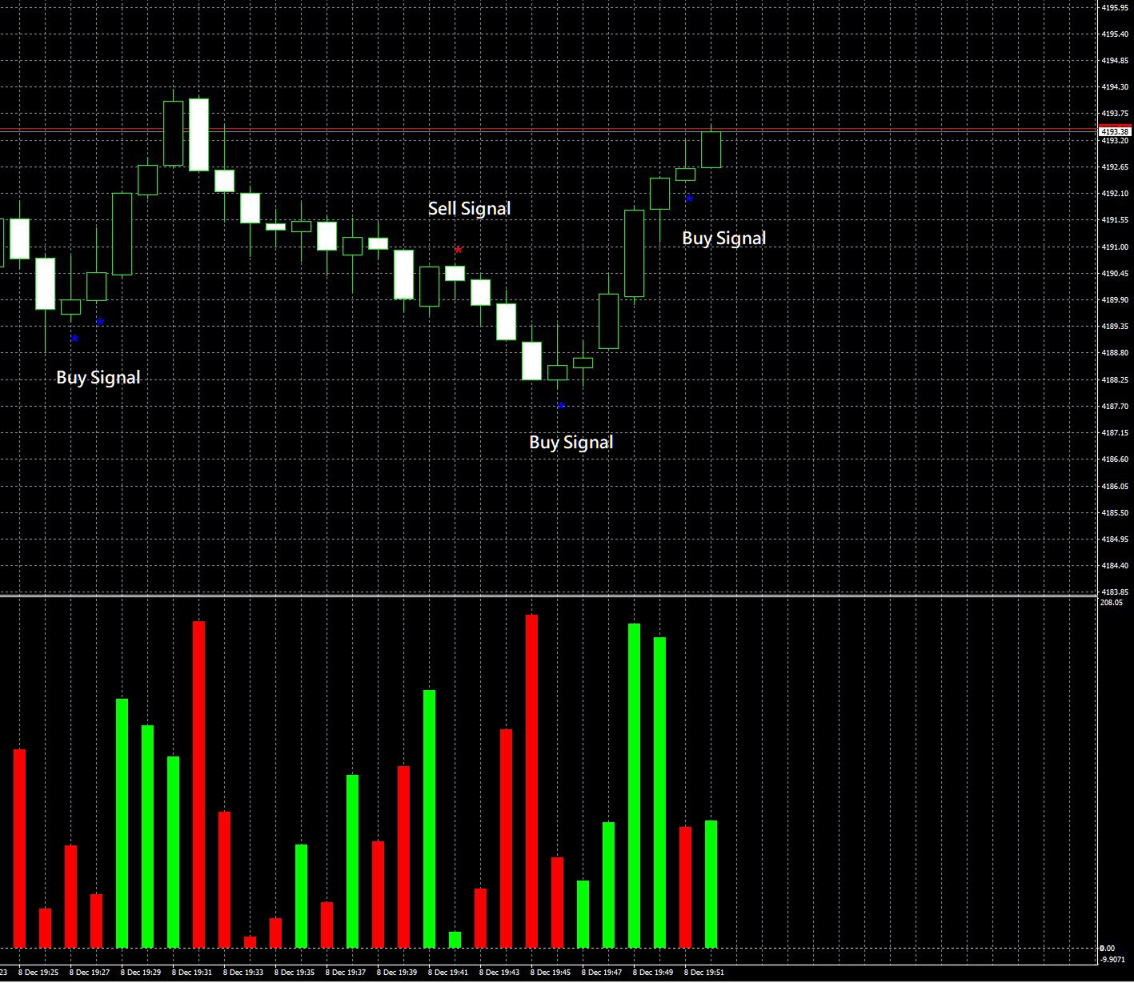
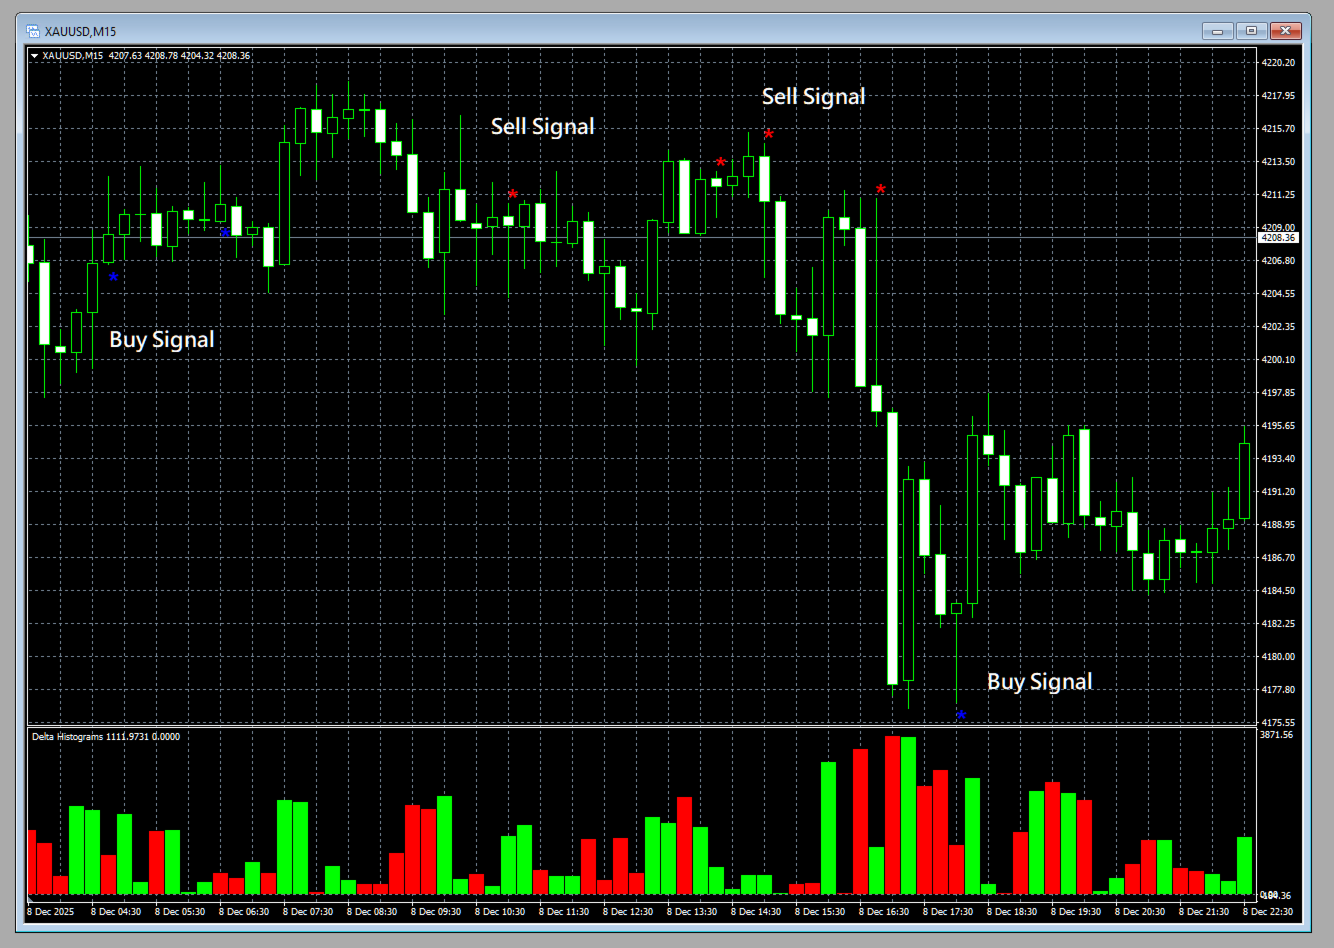
  • Détection des signaux d’absorption : Une logique avancée identifie les événements d’absorption haussiers et baissiers, vous alertant en avance sur les retournements potentiels.
  • Marqueurs sur le graphique : Les signaux d’absorption sont marqués directement sur votre graphique pour une référence visuelle facile.
  • Alertes popup : Recevez des notifications en temps réel dès qu’un nouveau signal d’absorption apparaît.
  • Seuils personnalisables : Filtrez les signaux faibles et concentrez-vous sur les opportunités à forte probabilité.
  • Gestion des ressources : Calcul efficace pour des performances rapides, même sur de grands graphiques.
  • Compatible avec tous les instruments : Fonctionne sur tous les symboles et unités de temps, y compris le Forex, les indices et les matières premières.
  • Intégration facile : Paramètres simples pour une configuration et un ajustement rapides.

Logique derrière OrderFlow Absorption

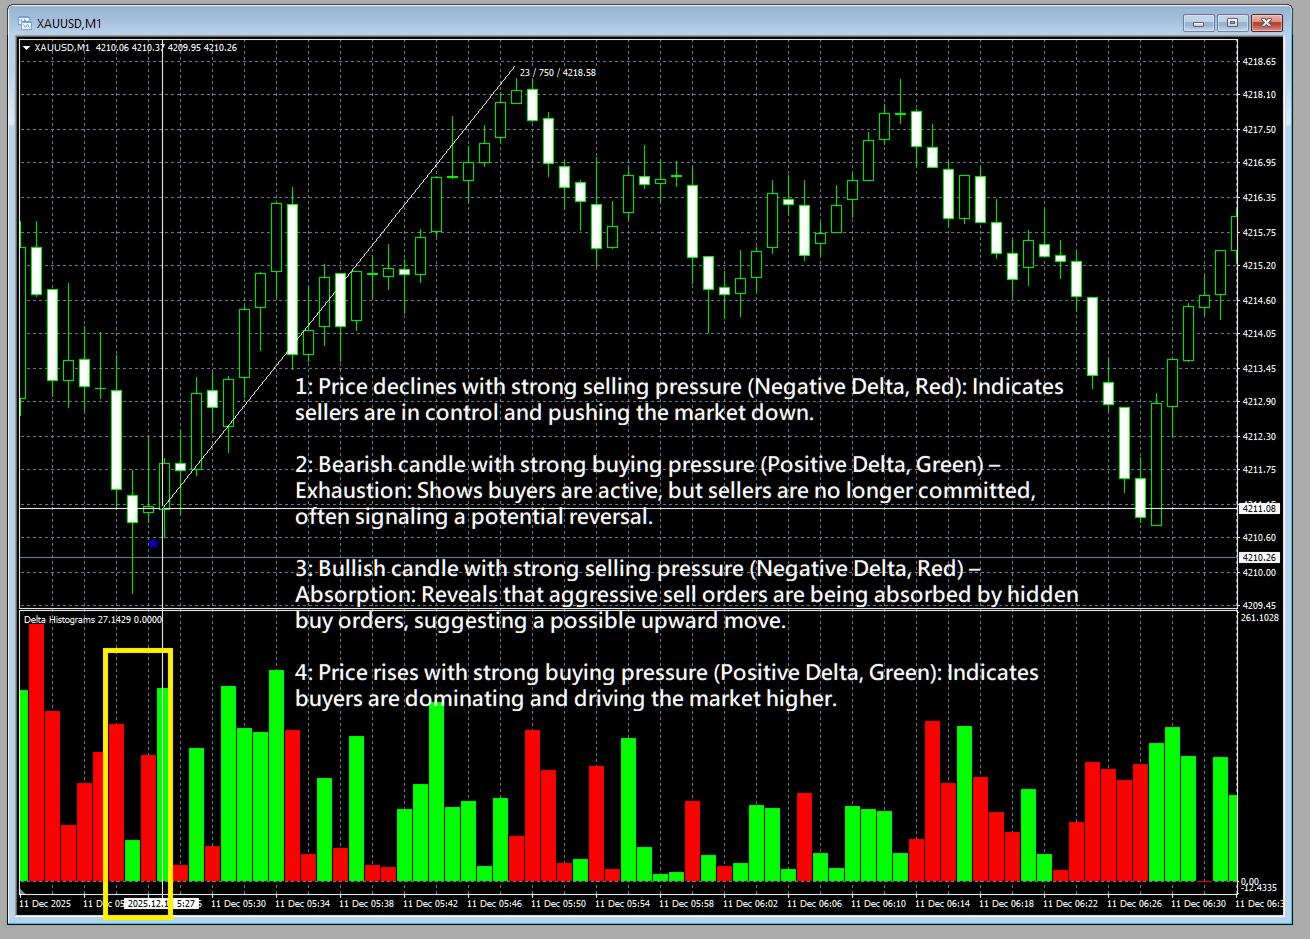
OrderFlow Absorption utilise un algorithme propriétaire pour estimer la pression d’achat et de vente (delta) de chaque bougie, même chez les courtiers qui ne fournissent pas de données tick complètes. Il analyse le volume, l’action des prix, la structure des bougies et la taille des mèches pour détecter les événements d’absorption cachés – des moments où des achats ou ventes agressifs sont absorbés par de gros ordres opposés, signalant souvent un retournement ou un mouvement fort.

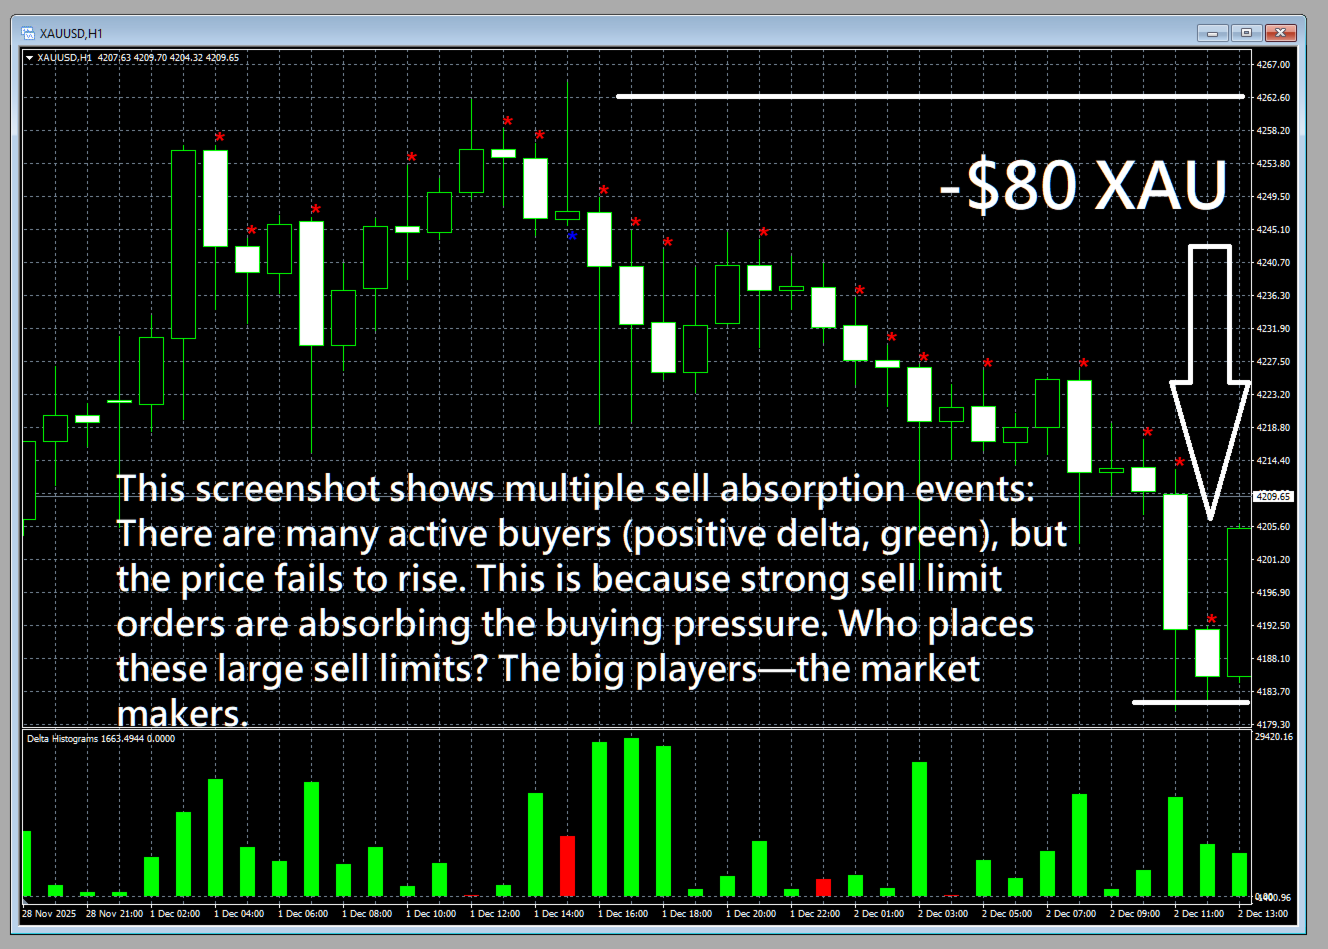
  • Absorption baissière : Détectée lorsqu’il y a une forte pression acheteuse (delta positif) mais que la bougie clôture baissière, indiquant que les vendeurs ont absorbé les achats.
  • Absorption haussière : Détectée lorsqu’il y a une forte pression vendeuse (delta négatif) mais que la bougie clôture haussière, indiquant que les acheteurs ont absorbé les ventes.

Ces signaux sont marqués sur votre graphique et peuvent déclencher des alertes instantanées, pour que vous ne manquiez jamais un événement de marché important.

Comment utiliser

  1. Ajoutez l’indicateur : Placez OrderFlow Absorption sur n’importe quel graphique et unité de temps.
  2. Ajustez les paramètres : Définissez votre seuil delta préféré et le nombre de bougies à analyser.
  3. Observez l’histogramme : Les barres vertes indiquent la pression acheteuse, les rouges la pression vendeuse.
  4. Repérez les signaux d’absorption : Les marqueurs « * » sur le graphique mettent en évidence les événements d’absorption. Les alertes popup vous informent instantanément.
  5. Tradez plus intelligemment : Utilisez les signaux d’absorption pour détecter les retournements, confirmer vos entrées ou éviter les faux cassures.

Essayez-le maintenant – Téléchargez la démo !

Découvrez la puissance d’OrderFlow Absorption par vous-même. Téléchargez la démo gratuite et voyez comment elle peut transformer votre trading. Ne manquez pas les opportunités cachées du marché – ajoutez OrderFlow Absorption à votre arsenal dès aujourd’hui !

OrderFlow Absorption – Découvrez les véritables intentions du marché. Téléchargez la démo et tradez en toute confiance !


Produits recommandés
WickAndBody Volume Flow
Henry Armando Baltazar
WickAndBody Volume Flow v5.2 Order Flow Analysis through Candle Segmentation The WickAndBody Volume Flow is an advanced diagnostic tool for MetaTrader that allows traders to "see" inside every Japanese candlestick. Unlike conventional volume indicators, this algorithm utilizes Multi-Timeframe (MTF) technology to break down real volume and determine exactly how much capital was traded in the wicks versus the candle body . Key Features Volume Detection: Uses lower timeframe data (M1/M5) to reconst
FREE
Volume Profile V6
Andrey Kolesnik
4.67 (3)
Indicateur de profil de volume de marché + oscillateur intelligent. Fonctionne sur pratiquement tous les instruments — paires de devises, actions, futures, crypto-monnaies, sur volumes réels et sur ticks. Il est possible de configurer la définition automatique de la plage de construction du profil (par exemple, pour une semaine ou un mois, etc.), ou de définir la plage manuellement en déplaçant les limites (deux lignes verticales : rouge et bleue). L'affichage se fait sous forme d'histogramme. L
Was: $249  Now: $99   Market Profile defines a number of day types that can help the trader to determine market behaviour. A key feature is the Value Area, representing the range of price action where 70% of trading took place. Understanding the Value Area can give traders valuable insight into market direction and establish the higher odds trade. It is an excellent addition to any system you may be using. Inspired by Jim Dalton’s book “Mind Over Markets”, this indicator is designed to suit the
ALIEN Dashboard
Youssef Esseghaiar
ALIEN DASHBOARD FULL EDITION – Professional ICT & Precision Trading Dashboard for MT5 ( HYBRID ENGINE ) Overview The   Alien Dashboard Full Edition   is a comprehensive, all‑in‑one technical indicator for MetaTrader 5 that merges the most powerful concepts from Inner Circle Trader (ICT) methodology with advanced precision‑entry logic, multi‑timeframe analysis, and an intuitive on‑chart dashboard. Designed for serious traders who want to visualise institutional order flow, identify high‑probabili
L'indicateur construit les cotations actuelles, qui peuvent être comparées aux cotations historiques et, sur cette base, faire une prévision de l'évolution des prix. L'indicateur dispose d'un champ de texte pour une navigation rapide jusqu'à la date souhaitée. Option : Symbole - sélection du symbole que l'indicateur affichera ; SymbolPeriod - sélection de la période à partir de laquelle l'indicateur prendra des données ; IndicatorColor - couleur de l'indicateur ; HorisontalShift - décalage
Price Magnet — Price Density and Attraction Levels Indicator Price Magnet is a professional analytical tool designed to identify key support and resistance levels based on statistical Price Density. The indicator analyzes a specified historical period and detects price levels where the market spent the most time. These zones act as “magnets,” attracting price action or forming a structural base for potential reversals. Unlike traditional Volume Profile tools, Price Magnet focuses on price-time d
Delta Profile Volume
Teresinha Moraes Correia
Technical Description of the Indicator – Delta Profile for MetaTrader 5 The Delta Profile is an indicator developed for MetaTrader 5 focused on detailed analysis of volume flow within a defined range of candles. It organizes and displays information about the imbalance of positive volumes (associated with upward movements) and negative volumes (associated with downward movements) at different price levels. The result is a clear view of the chart points where the highest concentration of trades o
L'indicateur SMC Venom Model BPR est un outil professionnel pour les traders travaillant dans le concept Smart Money (SMC). Il identifie automatiquement deux modèles clés sur le graphique des prix: FVG   (Fair Value Gap) est une combinaison de trois bougies, dans laquelle il y a un écart entre la première et la troisième bougie. Forme une zone entre les niveaux où il n'y a pas de support de volume, ce qui conduit souvent à une correction des prix. BPR   (Balanced Price Range) est une combinaiso
Le niveau Premium est un indicateur unique avec une précision de plus de 80 % des prédictions correctes ! Cet indicateur a été testé par les meilleurs Trading Specialists depuis plus de deux mois ! L'indicateur de l'auteur que vous ne trouverez nulle part ailleurs ! À partir des captures d'écran, vous pouvez constater par vous-même la précision de cet outil ! 1 est idéal pour le trading d'options binaires avec un délai d'expiration de 1 bougie. 2 fonctionne sur toutes les paires de devises
Market Profile 3 ForexArby com
Hussien Abdeltwab Hussien Ryad
4 (15)
Market Profile 3 MetaTrader 5 indicator  version 4.70— is a classic Market Profile implementation that can show the price density over time, outlining the most important price levels, value area, and control value of a given trading session. This indicator can be attached to timeframes between M1 and D1 and will show the Market Profile for daily, weekly, monthly, or even intraday sessions. Lower timeframes offer higher precision. Higher timeframes are recommended for better visibility. It is als
FREE
Order Book, known also as Market Book, market depth, Level 2, - is a dynamically updated table with current volumes of orders to buy and to sell specific financial instument at price levels near Bid and Ask. MetaTrader 5 provides the means for receiving market book from your broker, but in real time only, without access to its history. The indicator OrderBook Cumulative Indicator accumulates market book data online and visualizes them on the chart. In addition, the indicator can show the market
Mirror Chart MT5
Andrej Hermann
5 (1)
The Mirror Chart MT5 is a overlay indicator specifically designed to project a second financial instrument directly onto the main chart window. This tool is invaluable for traders who rely on correlation analysis, as it visualizes the price movements of two different instruments in real time. Unlike traditional overlays, this indicator utilizes intelligent, dynamic centering and scaling logic. It continuously analyzes the visible price range in the current window for both symbols and calculates
FREE
Mine Farm
Maryna Kauzova
Mine Farm is one of the most classic and time-tested scalping strategies based on the breakdown of strong price levels. Mine Farm is the author's modification of the system for determining entry and exit points into the market... Mine Farm - is the combination of great potential with reliability and safety. Why Mine Farm?! - each order has a short dynamic Stop Loss - the advisor does not use any risky methods (averaging, martingale, grid, locking, etc.) - the advisor tries to get the most
BoxChart MT5
Evgeny Shevtsov
5 (7)
The market is unfair if only because 10% of participants manage 90% of funds. An ordinary trader has slim changes to stand against these "vultures". This problem can be solved. You just need to be among these 10%, learn to predict their intentions and move with them. Volume is the only preemptive factor that faultlessly works on any timeframe and symbol. First, the volume appears and is accumulated, and only then the price moves. The price moves from one volume to another. Areas of volume accumu
Volume Profile Canvas - Professional Volume Profile Indicator for MetaTrader 5 DESCRIPTION Volume Profile Canvas is a professional volume profile indicator for MetaTrader 5 that renders directly on the chart using a high-performance Canvas engine. It calculates and displays the volume distribution across price levels, identifying the Point of Control (POC), Value Area High (VAH) and Value Area Low (VAL) in real time. This is a pure analysis tool. It does not trade. It gives you an instant vi
The   Visual Volatility Clustering   indicator clusters the market based on volatility. The indicator does not redraw and gives accurate data, does not use closing prices. Uses the opening prices or the highs or lows of the previous completed bar. Therefore, all information will be clear and unambiguous. The essence of the indicator is to divide the price market into certain areas according to a similar type of volatility. This can be done in any way. In this example, the indicator is configure
Volume Candle Indicator
Pablo Filipe Soares De Almeida
Histogramme de Volume Coloré pour MetaTrader 5 Cet indicateur affiche le volume sous forme d’histogramme dans une fenêtre séparée. Les barres sont colorées selon la direction de la bougie : vert pour haussier (clôture > ouverture) et rouge pour baissier (clôture < ouverture). Caractéristiques principales Source de volume : volume de ticks ou volume réel (au choix). Ligne de moyenne mobile optionnelle au-dessus de l’histogramme. Types de moyennes pris en charge : SMA, EMA, SMMA, LWMA. Période moy
Weis Wave Scouter
Jean Carlos Martins Roso
Découvrez la puissance de l'analyse avancée du volume avec le Weis Wave Scouter, un indicateur révolutionnaire pour MetaTrader 5 combinant les principes éprouvés de la méthode Wyckoff et de l'analyse VSA (Volume Spread Analysis). Conçu pour les traders recherchant précision et profondeur, cet indicateur fournit une lecture tactique du marché via l'analyse des vagues de volume cumulatif, aidant à identifier les points clés de retournement et de continuation de tendance. Le Weis Wave Scouter propo
No Demand No Supply MT5
Trade The Volume Waves Single Member P.C.
No Demand No Supply   This indicator identifies   No Demand –No Supply candles to your chart and plots volume bars colored according to the signal. It can be applied to all timeframes or to a specific one only. It can also be used as regular volume indicator  with exceptional future of WEIGHTED VOLUME. Furthermore is has an alert notification, sound and email when a signals occurs. The indicator does not repaint but the alert will come on two candles back due to the definition of No Demand No Su
Noize Absorption Index - is the manual trading system that measures the difference of pressure between bears forces and bulls forces. Green line - is a noize free index that showing curent situation. Zero value of index shows totally choppy/flat market.Values above zero level shows how powerfull bullish wave is and values below zero measures bearish forces.Up arrow appears on bearish market when it's ready to reverse, dn arrow appears on weak bullish market, as a result of reverse expectation.
Time and Sales Tick
Pablo Filipe Soares De Almeida
Time & Sales Tick Indicator est un indicateur pour MetaTrader 5 qui affiche les données de ticks en temps réel. Il montre le prix, le volume des ticks et l’heure directement sur le graphique. Fonctionnalités Affiche les données de ticks (prix, volume et heure) dans un panneau sur le graphique. Regroupe les ticks selon des intervalles définis par l’utilisateur, avec un code couleur (vert pour la hausse, rouge pour la baisse). Le panneau peut être positionné dans n’importe quel coin du graphique.
The "MR Volume Profile 5" indicator is a charting tool that displays trading volume at different price levels rather than time intervals. A key concept in volume profile is the point of control (POC)—the price level with the highest volume traded during the session or time range. While tools like VWAP or OBV provide volume trends, the "MR Volume Profile 5" indicator offers granular detail about where the most market activity occurs at specific price levels. This makes it a more precise tool for
The indicator highlights the points that a professional trader sees in ordinary indicators. VisualVol visually displays different volatility indicators on a single scale and a common align. Highlights the excess of volume indicators in color. At the same time, Tick and Real Volume, Actual range, ATR, candle size and return (open-close difference) can be displayed. Thanks to VisualVol, you will see the market periods and the right time for different trading operations. This version is intended f
FREE
Your Trend Friend
Luigi Nunes Labigalini
5 (1)
The trend is your friend! Look at the color of the indicator and trade on that direction. It does not  repaint. After each candle is closed, that's the color of the trend. You can focus on shorter faster trends or major trends, just test what's most suitable for the symbol and timeframe you trade. Simply change the "Length" parameter and the indicator will automatically adapt. You can also change the color, thickness and style of the lines. Download and give it a try! There are big movements w
Fibaction
Abdelkhalek Orabi
Indicator Name: Fibaction – price action candle Detector Description: Fibo Signal Boxes is a powerful Smart Money Concept (SMC)-inspired indicator that auto-detects price action candles. bullish hammers and shooting stars, then draws precise Fibonacci entry zones and multiple take-profit levels directly on the chart. as for the SL personally i use 40 pips rules  Key Features: Detects bullish hammer and shooting star reversal candles. Automatically draws Fibonacci entry and TP boxes. as
Wapv Price and volume
Eduardo Da Costa Custodio Santos
L'indicateur de prix et de volume WAPV pour MT5 fait partie de l'ensemble d'outils (Wyckoff Academy Wave Market) et (Wyckoff Academy Price and Volume). L'indicateur de prix et de volume WAPV pour MT5 a été créé pour faciliter la visualisation intuitive du mouvement du volume sur le graphique. Avec lui, vous pouvez observer les moments de pic de volume et les moments où le marché n'a aucun intérêt professionnel Identifiez les moments où le marché évolue par inertie et non par mouvement de "smart
French Cet indicateur agit comme un assistant d'analyse graphique avancé pour les traders qui aiment trader les figures graphiques (Chart Patterns). Il est conçu pour réduire la charge de l'analyse visuelle et augmenter la précision de la prise de profit. Caractéristiques principales de cet indicateur du point de vue de l'utilisation pratique : 1. Détection automatique des figures (Automated Pattern Detection) Gain de temps et réduction des biais : Vous n'avez pas besoin de tracer manuellement d
Trading Utility for Forex Currency Pairs Only not for Gold  Functions Auto Lot Calculation based on Risk Auto stoploss  Auto TakeProfit Breakeven Auto Close Half % Close in percentage with respect to the PIPs Pending Orders BuyLimit Sell Limit with distances BuyStop Sell Stop    with distances Trading Informations Risk in percentage For Multiple trades Combine Takeprofit and Combine Stoplosses
VR Grid Mt5
Vladimir Pastushak
3.25 (8)
L'indicateur VR Grid est conçu pour créer une grille graphique avec des paramètres définis par l'utilisateur. Contrairement à la grille standard , VR Grid est utilisée pour créer des niveaux circulaires . Selon le choix de l'utilisateur, le pas entre les niveaux ronds peut être arbitraire. De plus, contrairement à d'autres indicateurs et utilitaires, VR Grid maintient la position de la grille même lorsque la période de temps change ou que le terminal est redémarré. Les paramètres, les fichiers d
FREE
Advance Demand and Supply
Oyinemomoemi Emeledor
5 (1)
This   Demand & Supply Zone Indicator with Volume Filtering   is a technical analysis tool for MetaTrader that identifies key price zones where buying (demand) or selling (supply) pressure is concentrated. It uses fractals, volume analysis, and price action to detect and highlight these zones on the chart. Key Features: Zone Detection Based on Fractals Identifies demand (support) and supply (resistance) zones using   fractal patterns   (local highs/lows). Zones are formed from   open prices   ar
FREE
Les acheteurs de ce produit ont également acheté
SignalTech MT5 is a trading system for EURUSD, USDCHF, USDJPY, AUDUSD, NZDUSD, EURJPY, AUDJPY, NZDJPY, CADJPY H2 and H3 Timeframe.  It can generate signals with Buy/Sell Arrows and Pop-Up/Sound Alerts. Each signal has clear Entry and Stop Loss levels, which should be automatically flagged on the chart, as well as potential Targets 1, 2, and 3. The Entry and TP levels are fixed after the trade is taken. The exit level is dynamic. If there are signs of a potential short-term trend reversal, the
OmniSync Projection
Antonio-alin Teculescu
5 (1)
Chronos Fractal Engine is an innovative price projection indicator for MetaTrader 5, designed to transform your technical analysis by intelligently identifying and projecting historical price patterns. Built upon an advanced correlation algorithm and the fractal principles of the market, this powerful tool visualizes potential future price movements, giving you a unique edge in your trading decisions. What is Chronos Fractal Engine? At its core, the Chronos Fractal Engine employs a sophisticat
Azimuth Pro
Ottaviano De Cicco
5 (7)
Azimuth Pro V2: Synthetic Fractal Structure and Confirmed Entries for MT5 Overview Azimuth Pro is a multi-level swing structure indicator by Merkava Labs . Four nested swing layers, swing-anchored VWAP, ABC pattern detection, three-timeframe structural filtering, and closed-bar confirmed entries — one chart, one workflow from micro-swings to macro-cycles. This is not a blind signal product. It is a structure-first workflow for traders who care about location, context, and timing. V2 Launch Offe
ARICoins
Temirlan Kdyrkhan
ARICoin is a powerful trading companion designed to generate high-probability entry signals with dynamic TP/SL/DP levels based on volatility. Built-in performance tracking shows win/loss stats, PP1/PP2 hits, and success rates all updated live. Key Features: Buy/Sell signals with adaptive volatility bands Real-time TP/SL/DP levels based on ATR Built-in MA Filter with optional ATR/StdDev volatility Performance stats panel (Success, Profit/Loss, PP1/PP2) Alerts via popup, sound, push, or email Cust
L'indicateur « Dynamic Scalper System MT5 » est conçu pour la méthode de scalping, permettant de trader au sein des vagues de tendance. Testé sur les principales paires de devises et l'or, il est compatible avec d'autres instruments de trading. Fournit des signaux pour l'ouverture de positions à court terme le long de la tendance, avec un support supplémentaire pour les fluctuations de prix. Principe de l'indicateur : De grandes flèches déterminent la direction de la tendance. Un algorithme de
Meravith MT5
Ivan Stefanov
5 (1)
Outil des market makers. Meravith va : Analyser toutes les unités de temps et afficher la tendance actuellement en vigueur. Mettre en évidence les zones de liquidité (équilibre des volumes) où le volume haussier et baissier est égal. Afficher tous les niveaux de liquidité provenant de différentes unités de temps directement sur votre graphique. Générer et présenter une analyse de marché sous forme de texte pour votre référence. Calculer les objectifs, les niveaux de support et les points de stop
CGE Trading Suite
Carl Gustav Johan Ekstrom
5 (2)
Institutional-Grade Analytics for MT5 C GE Trading Suite delivers the analytical edge typically reserved for professional trading desks. The platform integrates a full suite of analytical tools into one seamless workflow: dynamic grid mapping, liquidity behavior analysis, ECM, trend lines, MIDAS, trade cycles, and directional channel projections. Together, these provide a unified view of market structure and momentum. Directional clarity is further enhanced by the capital flow index, which meas
AriX
Temirlan Kdyrkhan
1 (4)
AriX Indicator for MT5 A powerful trend-following and signal-evaluation tool AriX is a custom MT5 indicator that combines Moving Averages and ATR-based risk/reward logic to generate clear buy/sell signals. It visualizes dynamic SL/TP levels, evaluates past trade outcomes, and displays win/loss statistics in a clean on-chart panel. Key features include: Buy/Sell signals based on MA crossovers ATR-based SL/TP1/TP2/TP3 levels with visual lines and labels Signal outcome tracking with real-time stat
ZIVA Signal Intelligence
Hassan Abdullah Hassan Al Balushi
ZIVA Signal Intelligence An Adaptive, Modular Market Intelligence System ZIVA Signal Intelligence is not positioned as a conventional trading indicator. It is a fully integrated, proprietary market intelligence system engineered to deliver structured, high-precision interpretation of price behavior within a controlled analytical environment. Developed through an independent architectural approach, ZIVA does not rely on, derive from, or replicate existing indicators. It represents a standalone
L’indicateur met en évidence les zones où un intérêt est déclaré sur le marché , puis montre la zone d’accumulation des ordres . Il fonctionne comme un carnet d’ordres à grande échelle . C’est l’indicateur destiné aux grands capitaux . Ses performances sont exceptionnelles. Quel que soit l’intérêt présent sur le marché, vous le verrez clairement . (Il s’agit d’une version entièrement réécrite et automatisée – l’analyse manuelle n’est plus nécessaire.) La vitesse de transaction est un indicateur
TrendMaestro5
Stefano Frisetti
note: this indicator is for METATRADER4, if you want the version for METATRADER5 this is the link:  https://www.mql5.com/it/market/product/108106 TRENDMAESTRO ver 2.5 TRENDMAESTRO recognizes a new TREND from the start, he never makes mistakes. The certainty of identifying a new TREND is priceless. DESCRIPTION TRENDMAESTRO identifies a new TREND in the bud, this indicator examines the volatility, volumes and momentum to identify the moment in which there is an explosion of one or more of these da
IVISTscalp5
Vadym Zhukovskyi
5 (6)
iVISTscalp5 — Système de prévision du marché basé sur le temps iVISTscalp5 n’est pas un indicateur classique. C’est un système basé sur le timing pour MetaTrader 5, qui identifie quand le marché est le plus susceptible de bouger. ⸻ Fonctionnalités  • Timing précis  • Signaux BUY / SELL  • Potentiel de profit moyen  • Prévisions hebdomadaires  • 120+ instruments ⸻ Idée clé Le marché est influencé par le temps, pas seulement par le prix ⸻ iVISTscalp5 — Votre avantage temporel Nous vous
Rtc ML Ai Predictor
Muhammad Faisal Sagala
Rtc ML Ai | Predictor CORE MACHINE LEARNING ENGINE Adaptive ML Market Predictor – Multi-Bar Trend & Candle Forecast What This Indicator Does This indicator is a  real-time market prediction engine  designed to analyze price behavior and estimate  future market tendencies . Unlike conventional indicators, this system  does not rely on static parameters or historical curve-fitting , but adapts its internal state dynamically during live market operation. Instead of using static rules, the indic
SunSignal ML — AI Gold Signals with Multi-Timeframe Confluence SunSignal ML is an advanced AI-powered signal indicator purpose-built for XAUUSD gold trading. It combines a proprietary adaptive trend algorithm with six machine learning models trained on confirmed price pivots to produce high-confidence entry signals with multi-timeframe validation. The indicator runs efficiently on M1, M5 and M15 timeframes and is designed for traders who want precision entries guided by data rather than guesswor
ARIScalping
Temirlan Kdyrkhan
ARIScalp is a powerful trading companion designed to generate high-probability entry signals with dynamic TP/SL/DP levels based on volatility. Built-in performance tracking shows win/loss stats, PP1/PP2 hits, and success rates all updated live. Key Features: Buy/Sell signals with adaptive volatility bands Real-time TP/SL/DP levels based on ATR Built-in MA Filter with optional ATR/StdDev volatility Performance stats panel (Success, Profit/Loss, PP1/PP2) Alerts via popup, sound, push, or email Cus
MATADOR GOLD — XAUUSD M5 ( TimeFrame M5 ) Scalp Signals for MT5 Strategy Tester Visualization Video https://youtu.be/_cWbbyg2RSs Not every move deserves a signal. MATADOR GOLD was built for traders who prefer selective, structured, high-quality decision support over noisy, hyperactive signal tools. Designed specifically for Gold (XAUUSD / GOLD) on M5 , MATADOR helps you read short-term momentum with more discipline by combining trend logic, market-condition filters, momentum timing, spread pro
VTrende Pro
Andrii Diachenko
5 (1)
VTrende Pro - MTF indicator for trend trading with a display panel for MT5 *** Videos can be translated into any language using subtitles (video language - Russian) Although the signals of the VTrende Pro indicator can be used as signals of a full-fledged trading system, it is recommended to use them in conjunction with the Bill Williams TS. VTrende Pro is an extended version of the VTrende indicator. Difference between Pro version and VTrende: - Time zones - Signal V - signal 1-2 waves -    S
Weis Wave with Alert MT5
Trade The Volume Waves Single Member P.C.
4.94 (17)
Rental/Lifetime Package Options and Privileges  Rent Monthly Six Months   Yearly/Lifetime Weis Wave with Speed with Alert+Speed Index x x x Manual  x x x Quick Set up Video x x x Blog x x x Lifetime Updates x x x Setup and Training Material x x Discord Access Channel "The SI traders"          x Rectangle Break Alert Tool      x How to trade with it:    http://www.tradethevolumewaves.com   ** If you purchase please contact me to setup your  : Training Room and  complete manual access.  Wei
Aide à déterminer si cette zone convient à l’achat. Aide à déterminer si cette zone convient à la vente. Lorsque les quatre indicateurs atteignent le bas en même temps, il convient de se concentrer sur les opportunités de rebond. Lorsque les quatre indicateurs se trouvent simultanément en haut, il convient de se concentrer sur les opportunités de baisse. Ce système repose sur une technologie algorithmique chinoise avancée et sur une structure de modélisation mathématique de haut niveau. J’utilis
Triple Crox Strategy- Système de Trading Professionnel Vue d'ensemble Triple Crox Strategy est un indicateur technique avancé pour MetaTrader 5 qui combine plusieurs méthodes d'analyse pour fournir des signaux de trading précis. Conçu pour les traders sérieux, cet indicateur intègre des stratégies multiples basées sur les moyennes mobiles, l'ATR, le RSI et des configurations de nuages pour identifier les opportunités de marché avec une grande fiabilité. Configuration Principale Types de
Indicateur intelligent de signaux de trading « Red and Green Light » Présentation du produit Red and Green Light est un indicateur professionnel de signaux de trading basé sur l’algorithme T3 à lissage multi-niveaux. Il intègre un système visuel de feux tricolores, une reconnaissance intelligente des signaux, des alertes de risque et un système d’alertes multiples. Que vous soyez trader manuel ou développeur d’Expert Advisors (EA), cet indicateur vous aide à saisir les opportunités du marc
Big Player Range
Thalles Nascimento De Carvalho
5 (3)
BigPlayerRange – Meilleur indicateur pour MT5 BigPlayerRange est considéré comme le meilleur indicateur pour le Mini Indice et le Mini Dollar sur MetaTrader 5. Cet outil met en évidence les zones stratégiques d’action des gros acteurs du marché, offrant une analyse technique institutionnelle d’une grande précision. Comment utiliser BigPlayerRange : Cet indicateur trace des zones d’achat (ligne verte) et de vente (ligne rouge). Lorsque le prix clôture en dehors de ces zones, une tendance
Jita Indicator Pro MT5 | All Timeframes Professional Trend Agreement System – Premium Edition ($500) What Is Jita Indicator Pro? Jita Indicator Pro is a structured trend-confirmation system designed for serious traders who value precision, alignment, and controlled signal behavior. It combines: Advanced band-based trend direction logic ATR-driven structural trigger engine Dual-confirmation agreement system Locked history update design This indicator prints signals only when multiple conditions
Recommended TimeFrame >= H1. 100% Non Repainted at any moment.  Use it carefully, only with Trend Direction. Trading Usage: 2 Variants: as Range System or as BreakOut System (Both Only With Trend Direction)::: (Always use StopLoss for minimise Risk); [1] as Range System: (Recommended) in UP TREND:  - BUY in Blue Line , then if price goes down by 50 points (on H1) open Second BUY.   Close in any Profit you wish: TrailingStop(45 points) or Close when Price touches upper Gold Line. in DOWN TREND
FXLAND Smart Reversal Indicator (MT5) FXLAND Smart Reversal Indicator is a professional technical analysis tool designed to help traders identify potential price reversal zones and key market turning points with clarity and precision. The best reversal indicator and price return by choosing only one ceiling or floor in each time frame A masterpiece of combining mathematics and Gann, fractal matrix, Fibonacci, movement angle and time. Completely intelligent Key Features Detects potenti
Piranha version 2
Maria Strudov
5 (1)
"Piranha" - an autonomous trading system that determines overbought and oversold levels on the chart. Red and blue zones represent overbought and oversold levels respectively. Entry points are marked with arrows: a downward arrow in the red zone for "sell" and an upward arrow in the blue zone for "buy". The Take profit level is indicated by the green moving average. Key features: Adjusting the Take profit level as the green moving average changes position. Averaging ability when a new market e
Thisras an advanced indicator used to catch Boom and Crash Inmmend indiless probability signals  ️ Non repaint arrowsnd less probability signals  ️ Non repaint arrowsnd less probability signals  ️ Non repaint arrowsnd less ns as sound,meframe for recommended Notifications as sound,meframe for recommended Notifications as sound, pop up, email and phone notifications s as sound, pop up, email and phone notifications s as sound, pop up, email and phone notifications
Pantera Indicator
Temirlan Kdyrkhan
5 (1)
A tool for on-chart strategy backtesting and performance analysis. A utility for developing, debugging, and testing custom trading ideas and indicator functions. An indicator designed to quickly test trading concepts and visualize the effectiveness of different input parameters. An all-in-one sandbox for testing everything from simple crossovers to complex, multi-condition trading systems.
AlgoEAs Trend Dashboard V1 Indicator for MT5 Introduction: This is a Dashboard Indicator based on 7 built in Multi Timeframe indicators. This strategy gives Buy/Sell Ideas based on 9 trend states. Easy to view gas guage to view current trend. Has as optional Alerts to enable with 9 messages. Run on M15 chart, with M15, H1, and H4 indicator time frames. Great tool! Features: Non-Repainting Dashboard For Desktop MT5 Only, Works On Any Mt5 Pair Great for Intraday and Swing Trading Easy view gas
WanaScalper
Isaac Wanasolo
1 (1)
A scalping indicator based on mathematical patterns, which on average gives signals with relatively small SL, and also occasionally helps to catch big moves in the markets (more information in the video) This indicator has three main types of notifications: The first type warns of a possible/upcoming signal on the next bar The second type indicates the presence of a ready signal to enter the market/open a position The third type is for SL and TP levels - you will be notified every time price re
Plus de l'auteur
OrderFlow Absorption – Indicateur professionnel de delta et de signaux d’absorption pour MT4 Libérez la puissance de l’analyse réelle du flux d’ordres avec OrderFlow Absorption – l’indicateur ultime d’histogramme delta et de signaux d’absorption pour MetaTrader 4. Conçu pour les traders qui veulent comprendre ce qui se passe réellement derrière chaque mouvement de prix, cet outil révèle la pression d’achat/vente cachée et les événements d’absorption qui font bouger le marché. Fonctionnalités Vis
Flat Reminder Overview Flat Reminder is a powerful technical analysis tool that identifies and highlights price consolidation zones on your chart. It detects when price action slows down and moves sideways, indicating potential reversal points, continuation setups, or key decision zones in the market. Key Features Consolidation Detection : Automatically identifies flat price zones where market momentum decreases Range Measurement : Calculates and displays the exact range of each consolidation in
FREE
Détecteur de Zone Clé (Key Zone Detector) Détecteur de Niveaux d'Offre et de Demande (Key Level Supply & Demand Zone Detector) Aperçu (Overview) Un indicateur sophistiqué de détection de zones d'offre et de demande qui identifie et évalue les niveaux de prix clés où se produit une activité significative du marché. L'indicateur utilise une analyse fractale et plusieurs méthodes de validation pour détecter et classer les zones de trading. Caractéristiques Clés (Key Features) Détection de Zone (Z
Energy X
Chi Sum Poon
EnergyX Indicator EnergyX is a unique tool that visualizes the "energy" of the market in a separate window. It helps you quickly see when energy is rising or falling, making it easier to spot potential trading opportunities. Yellow bars  show when energy is increasing. Red bars  show when energy is decreasing. How to Use: When price is approaching a  resistance  level: If energy is high and increasing (yellow), there is a higher chance the price will break the resistance. You may consider a  buy
大家睇住冬令夏令時間呀~ MEDIAN = (High + Low)/2 TYPICAL = (High + Low + Close)/3 WEIGHTED =   (High + Low + Close + Open)/4 --------------------- 附上自己用緊的 Setting, 不代表是最好的, 還需大家反饋 附上真倉紀錄, 全部EA入市, 但出市我成日手動, 但手動的效果欠佳, 應該信EA的... 附上今日2024/2/23的Cap圖, 16727.44追升, 16819.28手動平左, 高位~16895,  有進步空間的 --------------------- Min distance 係咩 ? Check time同Ordertime相距的距離 原意係, 兩個價差唔多即係冇方向, 就唔開單 用呢個最少距離可以只做大單邊 Checktime恆指16000 最少距離10000 <- 100點 Ordertime 16100以上/15900以下先會開 其他都當佢橫行唔玩 --------------------- -Check time means r
Key Zone
Chi Sum Poon
Please refer to full version: https://www.mql5.com/en/market/product/140908 Key Zone Detector Key Level Supply & Demand Zone Detector   Overview A sophisticated supply and demand zone detection indicator that identifies and rates key price levels where significant market activity occurs. The indicator uses fractal analysis and multiple validation methods to detect and classify trading zones. Key Features Zone Detection Auto-detects support and resistance zones Uses dual fractal system (fast and
FREE
MA Reminder Overview MA Reminder is a versatile moving average indicator that provides visual cues and background coloring to help traders identify trend direction and potential trading opportunities based on MA crossovers. Key Features Multiple Moving Averages : Displays up to 4 configurable moving averages on the chart Background Coloring : Highlights chart background based on MA1 and MA2 crossovers Timeframe Flexibility : Choose between dynamic (follows chart timeframe) or fixed timeframe mod
FREE
MTF Parabolic SAR S11
Chi Sum Poon
5 (1)
附上20240307市況, 順勢加單真開心 附上20240306市況, 順勢加單真開心 ※ ※ ※ This configuration is extremely aggressive and extremely risky. Please conduct your own backtesting and adjust it to a suitable risk level. ※ ※ ※ Additionally, please share the configuration and EA modification requirements with me. ※ ※ ※ ※ This EA trades based on the multi-time frame Parabolic SAR indicator. E.G. if there still a buy signal on the M15 timeframe SAR, In the M1 timeframe, the EA will execute a buy trade when M1 SAR buy signal.
---Bar Open Time Trading--- Most of the EA in the market, it is often the case that trades are executed at the beginning of each bar, known as "Per Bar." We can infer the future trend in the first few seconds of each bar. Let the bullets fly! This EA compares the opening price of each bar with the price "after a few seconds" to make trades. This EA is suitable for all markets, including gold, indices, forex, and more. Let's explore different strategies for various markets and time periods. Have
What goes to the extreme must reverse; what goes to the negative will bring prosperity. This EA captures technical rallies when there are consecutive bearish (bullish) candles making new lows (highs). It buys on the upward reversal when a consecutive bearish candle starts to retrace from a low position. It sells on the downward reversal when a consecutive bullish candle starts to retrace from a high position. === 物極必反、否極泰來 此 EA 捕捉連續陰(陽)燭創新低(高)時的技術性反彈(Technical Rally) 在 連續陰 燭 低位 回調開始時反手買升 在 連續
Raging Demon This EA can place stop orders on both sides up to 1 second before the news release. Please try the demo live version yourself to see what happens first. Use it at your own risk; I do not recommend gambling. The screenshots show actual results from the U.S. non-farm payroll data. It's all real. I tried it three times before daring to share it. It is possible to lose. But winning once can offset 4-5 losses. You can trade major news events on Friday at 8:30(HKT). I've traded CPI, I
BallBallG
Chi Sum Poon
BallBallG Le conseiller expert (EA) BallBallG utilise une combinaison d'indicateurs techniques pour prendre des décisions de trading informées. Il utilise principalement l'ADX (Average Directional Index) et ses tendances croissantes/décroissantes, la différence entre DI+ et DI-, le RSI (Relative Strength Index) et l'indicateur Parabolic SAR. Cette stratégie est appliquée sur six périodes de temps différentes pour améliorer la robustesse et la précision. Caractéristiques Clés: Stratégie Basée sur
Mad Max T
Chi Sum Poon
Mad Max This EA trades based on the ADX, ADX rising/falling, Di+ and Di- difference, RSI, 5-timeframe 6-MA, total 30 MAs indicators, and their difference. Can trade single bets, can trade Martingale. This EA is suitable for all markets, including gold, indices, forex, and more. ====== 瘋狂麥斯 此EA跟據 ADX, ADX 升緊/跌緊, Di+ 和 Di- Difference, RSI, 5 個 TimeFrame 6 條 MA 指標共30條MA, 和它們的相差 作出交易; 可玩單注, 可玩馬丁 此EA適用於所有市場, 黃金, 指數, 外匯......
Ichiichiichiku This EA trades based on the ADX, ADX rising/falling, Di+ and Di- difference, RSI, 5-timeframe 2-ichimoku conversion, base line, total 10 MAs indicators. Can trade single bets, can trade Martingale. This EA is suitable for all markets, including gold, indices, forex, and more. ====== 一齊一齊一齊沽 此EA跟據 ADX, ADX 升緊/跌緊, Di+ 和 Di- Difference, RSI, 5 個 TimeFrame 2 條 ichimoku conversion, base line 指標共10條MA, 作出交易; 可玩單注, 可玩馬丁 此EA適用於所有市場, 黃金, 指數, 外匯......
YinYang Marty This EA trades based on 2-timeframe ADX, ADX rising/falling, Di+ and Di- difference, RSI indicators. Martin Rule: Only open a Buy order when the previous candlestick is bullish; Only open a Sell order when the previous candlestick is bearish. Can trade single bets, can trade Martingale. This EA is suitable for all markets, including gold, indices, forex, and more. ====== 陰陽馬丁 此EA跟據 2 個 TimeFrame ADX, ADX 升緊/跌緊, Di+ 和 Di- Difference, RSI, 作出交易; 馬丁單限制: 上支陽燭才可開Buy單; 上支陰燭才可開Sell單 可玩單注,
DarkGhost
Chi Sum Poon
DarkGhost DarkGhost est un EA (Expert Advisor) révolutionnaire en pari unique qui utilise plusieurs indicateurs techniques pour prendre des décisions de trading. Il utilise principalement les indicateurs suivants pour déterminer le momentum : La valeur de l'indicateur de la plage réelle moyenne (ATR) La valeur de l'indice directionnel moyen (ADX) et la détermination de la hausse ou de la baisse de l'ADX La différence entre DI+ et DI- Cette stratégie est appliquée sur six cadres temporels différe
Breakout Detector — Outil avancé d’analyse de volatilité et de détection de cassures Description Breakout Detector est un indicateur technique avancé qui identifie les périodes de faible volatilité, lesquelles précèdent souvent des cassures de prix importantes. Cet indicateur combine le calcul de la volatilité de Parkinson avec l’analyse RSI, aidant les traders à repérer les opportunités de cassure avant qu’elles ne se produisent. Problèmes résolus Cassures manquées   : Lorsque vous remarquez la
# TrendBoard - Tableau de Bord Ultime d'Analyse Technique Multi-Timeframe **Transformez votre trading avec l'outil d'analyse de tendance le plus complet du marché !** ## **VERSION D'ESSAI GRATUITE DISPONIBLE - Téléchargez et Testez Maintenant !** Découvrez la puissance de l'analyse technique de niveau professionnel à portée de main. Téléchargez la version d'essai et découvrez pourquoi les traders appellent cela un "game-changer" pour leur stratégie de trading. ## **Pourquoi TrendBoa
KmeanSuperTrend – Indicateur SuperTrend Avancé Alimenté par IA Libérez la puissance du trading adaptatif avec KmeanSuperTrend ! Transformez votre trading avec le premier indicateur SuperTrend au monde alimenté par la technologie de clustering K-means IA. KmeanSuperTrend combine la méthodologie SuperTrend éprouvée avec l'apprentissage automatique de pointe pour offrir une précision sans précédent dans la détection des tendances et l'analyse de marché. Fonctionnalités Révolutionnaires   Cl
CVD Divergence Détection - Analyse Avancée du Delta de Volume   LE PROBLÈME QUE NOUS RÉSOLVONS La plupart des traders s'appuient uniquement sur l'action des prix, manquant des informations cruciales sur le flux de volume qui révèlent le véritable sentiment du marché. Les indicateurs traditionnels sont en retard par rapport aux mouvements de prix, causant des entrées tardives et une mauvaise gestion des risques. CVD Divergence Detection résout cela en analysant la relation entre le prix et le
Filtrer:
Aucun avis
Répondre à l'avis