Liquidity Heatmap Basic
- Indicatori
- Versione: 2.0
- Attivazioni: 5

Here our more valuable tools
SMC Trend Trading , Easy SMC Trading , Institutional SMC Architect
SMC Trend Trading , Easy SMC Trading , Institutional SMC Architect
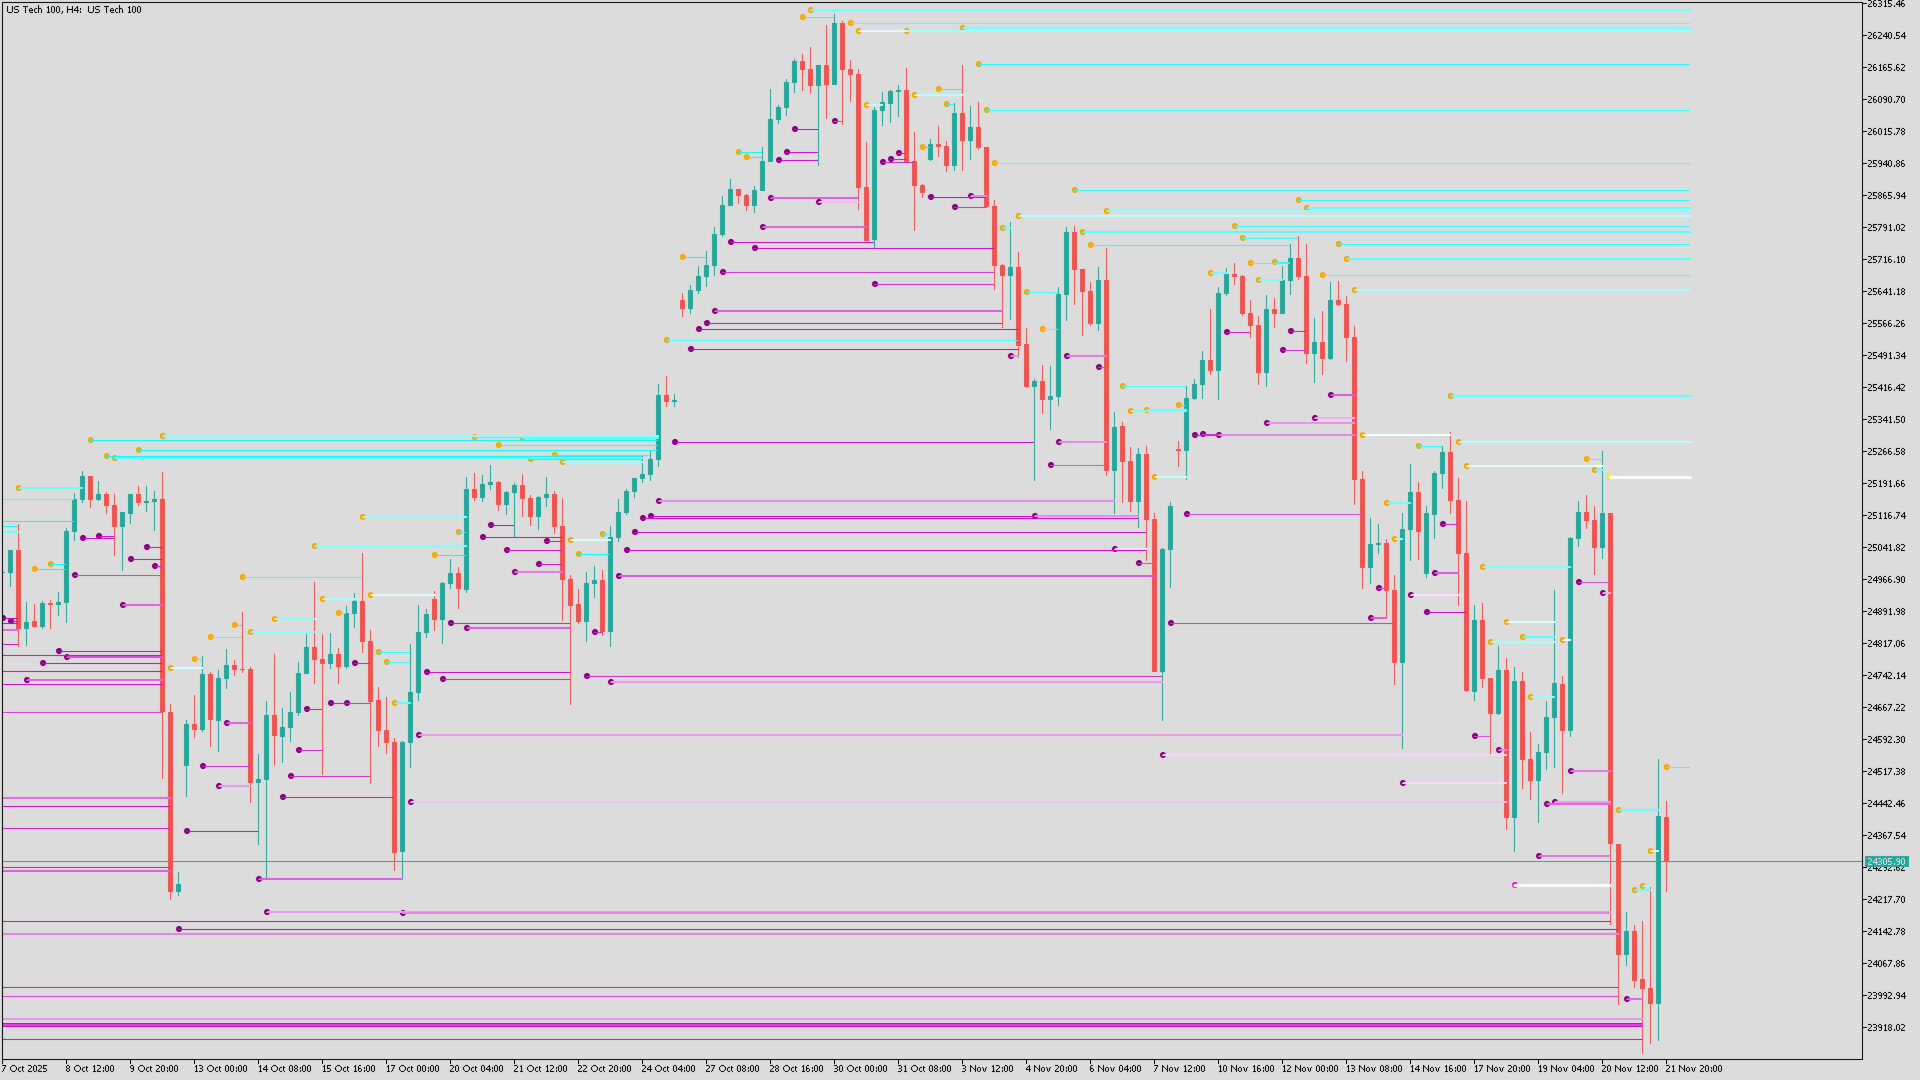
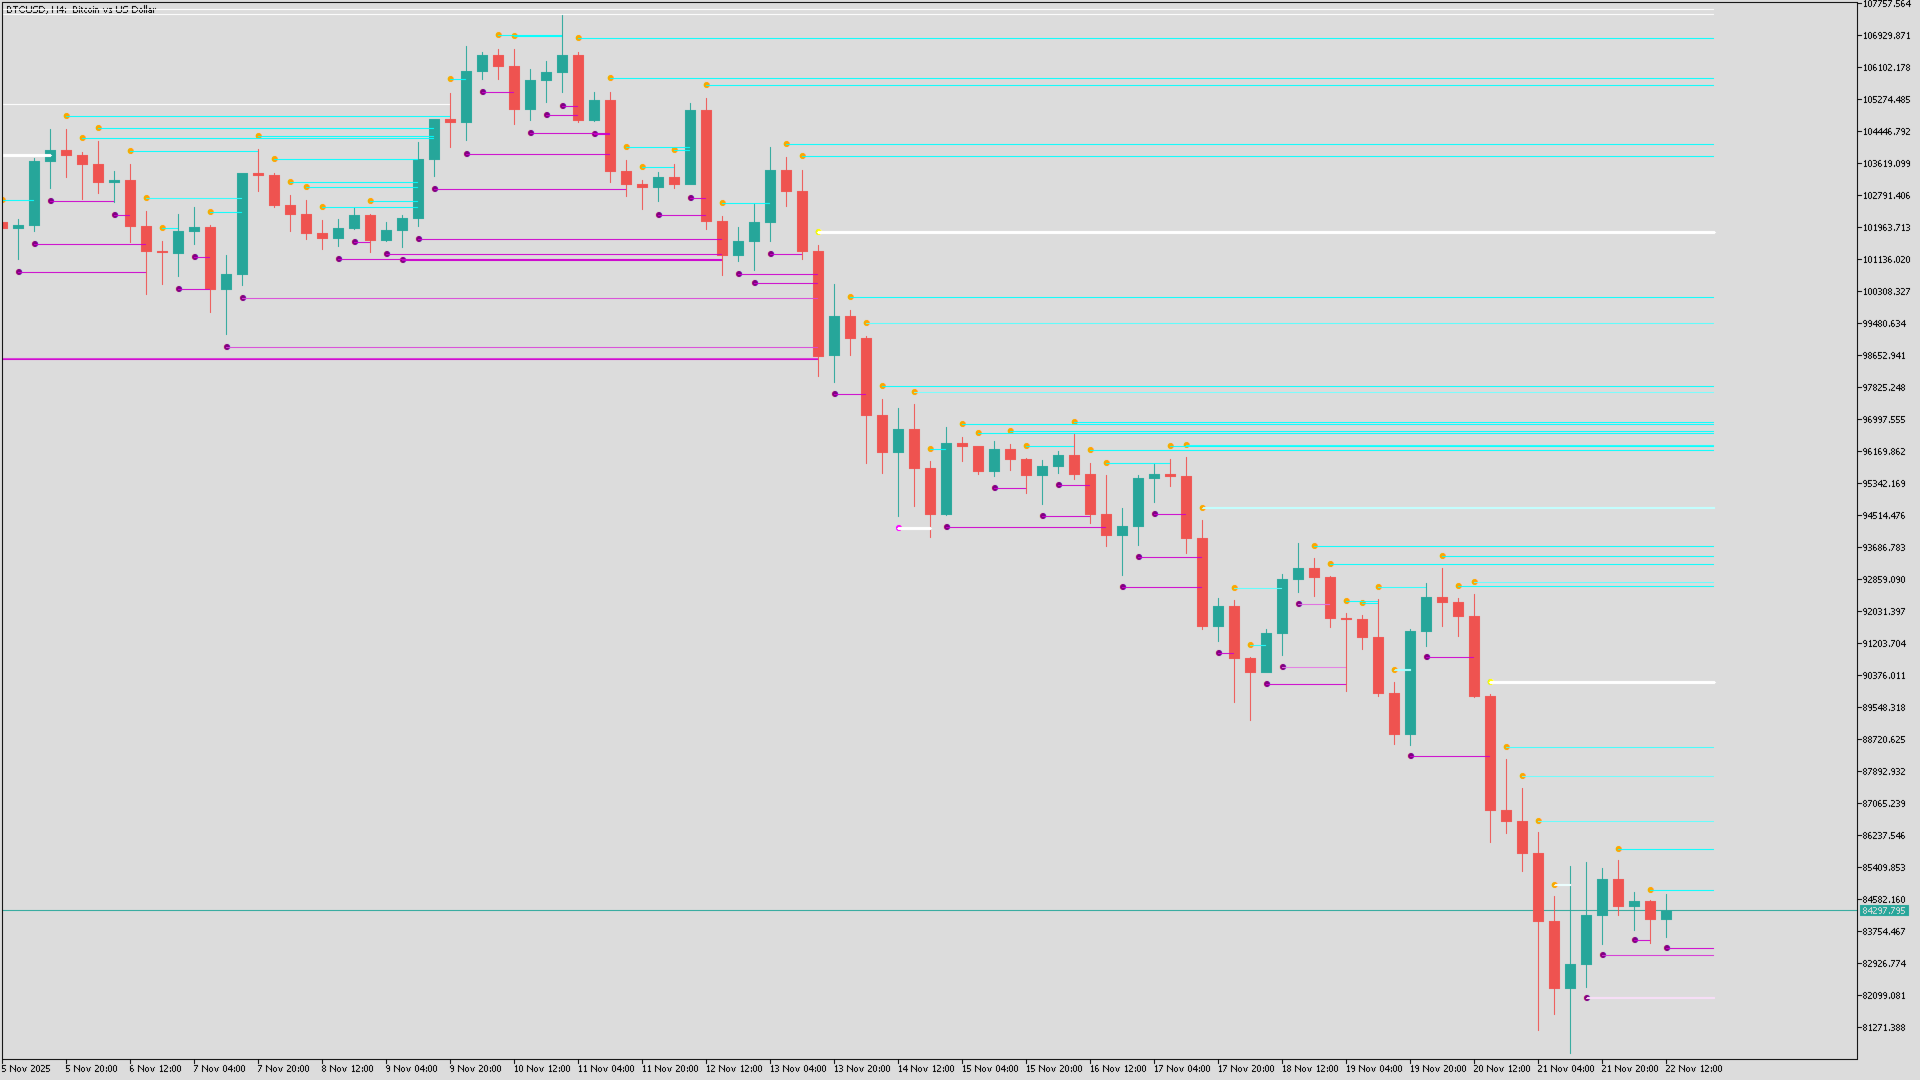
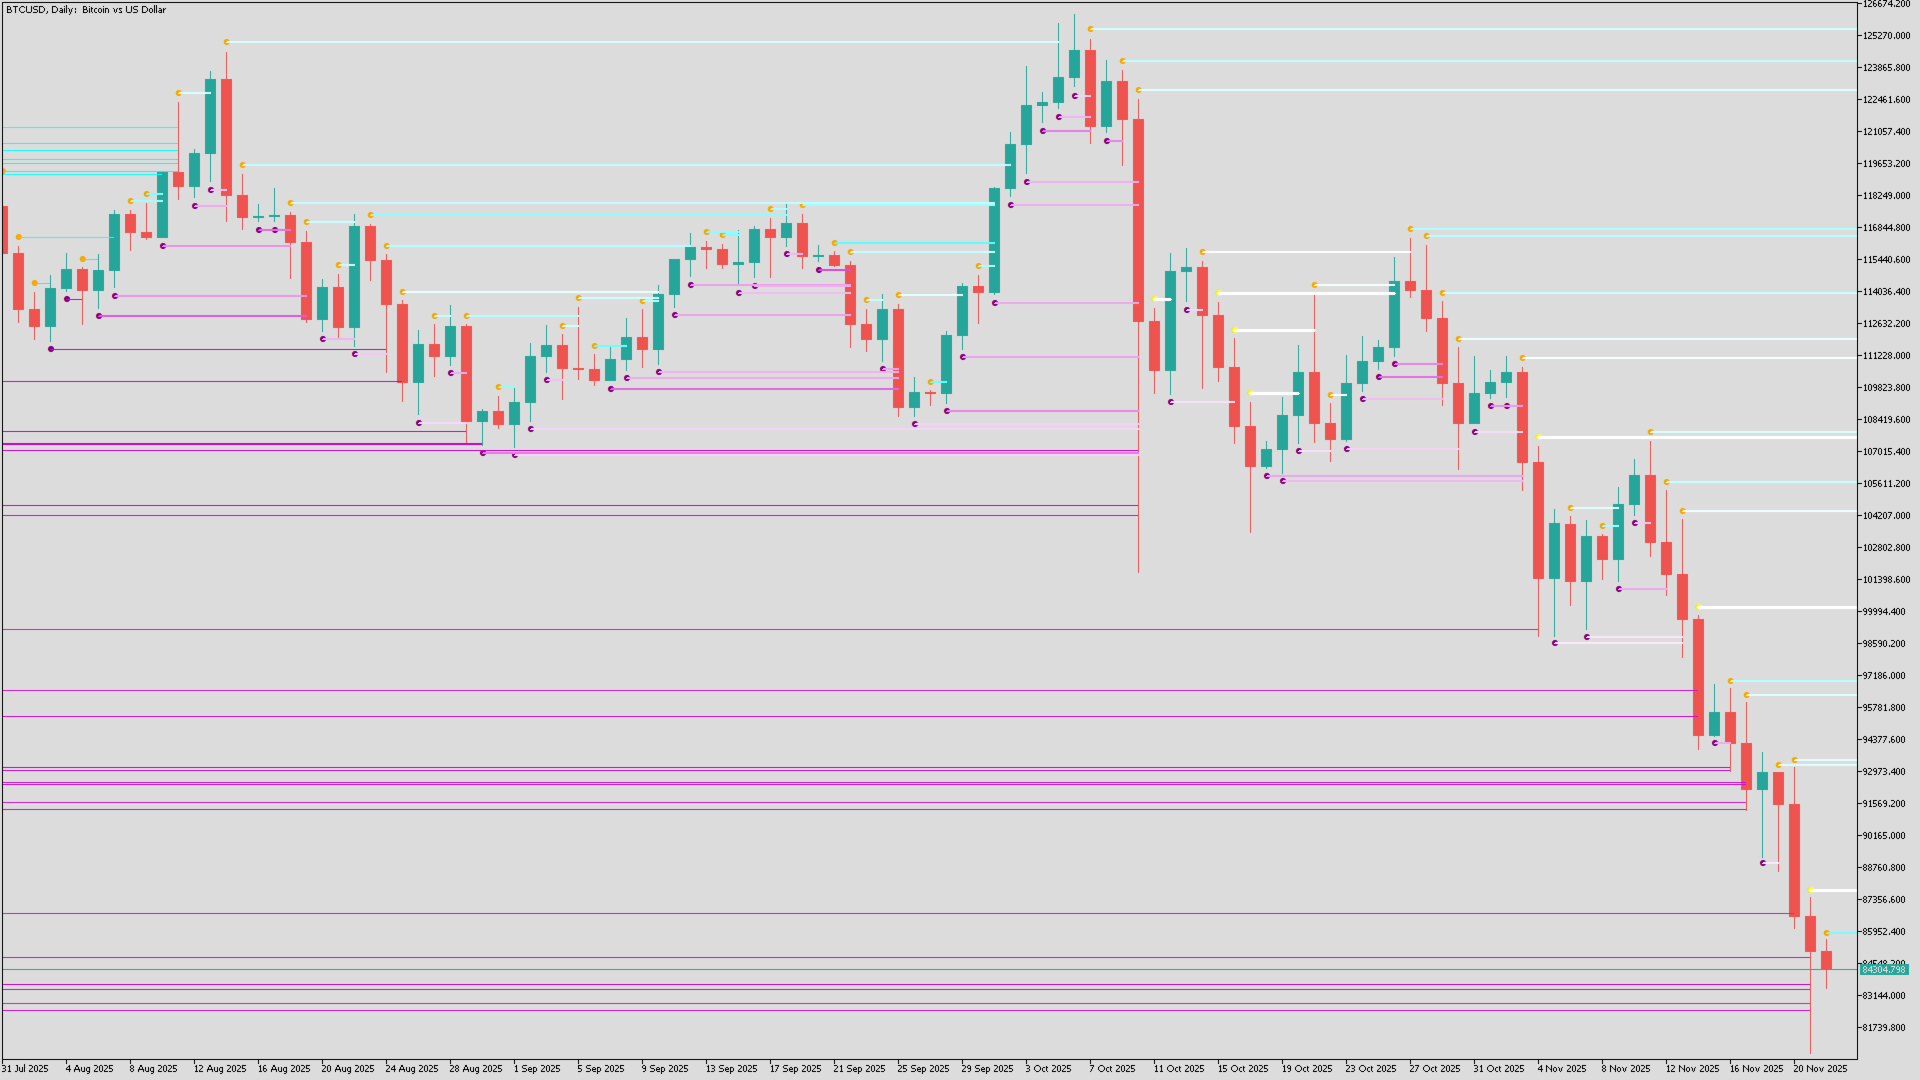
The Liquidity Heatmap is a sophisticated institutional trading tool designed to reveal where over-leveraged traders are trapped. By calculating estimated liquidation levels based on volume spikes and leverage, this indicator draws a dynamic "heatmap" of support and resistance zones that traditional technical analysis misses.
Price is often attracted to these liquidity pools like a magnet. When price hits these lines, positions are forced to close, often causing reversals or fueling strong breakouts.
Key Features
-
Dynamic Liquidation Lines: Automatically plots the estimated stop-loss/liquidation levels of Long and Short traders.
-
Volume-Weighted Heatmap: Uses an intelligent gradient coloring system. The brighter the line (White/Peak), the higher the volume was at that level, indicating a stronger liquidity zone.
-
Smart Extension Logic: Lines automatically extend to the right and vanish only when price successfully "grabs" the liquidity (crosses the line).
-
High-Definition (HD) Mode: Detects subtle volume anomalies to provide more granular data on lower timeframes.
-
Performance Optimized: Includes a "Max History" limiter to ensure the indicator runs smoothly on 1-minute charts without lagging your terminal.
-
Alerts & Visuals: Liquidations are marked with "Bubbles" at the origin, making it easy to spot the start of a new liquidity cluster.
How to Use (Trading Strategies)
This indicator is best used on Lower Timeframes (M1, M5, M15) for scalping and day trading.
1. The "Liquidity Bounce" (Reversal)
-
Scenario: Price approaches a dense cluster of bright/thick liquidity lines.
-
Logic: Market Makers often push price into these zones to force liquidations (stop hunting) before reversing the direction.
-
Action: Place buy orders at Short Liquidation lines (Support) or sell orders at Long Liquidation lines (Resistance). Wait for the line to be "eaten" and price to reject.
2. The "Magnet" Effect
-
Scenario: Price is ranging, but there is a large, untouched block of liquidity lines nearby.
-
Logic: Price tends to gravitate toward areas of high liquidity to facilitate large orders.
-
Action: Use the lines as a Take Profit target. If you are in a trade, aim for the next cluster of un-hit lines.
3. Trend Continuation
-
Scenario: During a strong trend, new bubbles and lines form constantly behind the price action.
-
Action: Use these fresh lines as a trailing stop-loss reference or a safe zone to re-enter the trend on a pullback.
Input Parameters Guide
-
Mode (HD / Normal):
-
HD: Uses raw volume. Best for granular detail.
-
Normal: Uses volume changes (Delta). Good for filtering noise.
-
-
Leverage: (Default: 300). This determines how far away the lines are drawn.
-
Lower Leverage (e.g., 25-50): Lines appear further away (Swing trading).
-
Higher Leverage (e.g., 100-300): Lines appear closer to price (Scalping/Crypto/Forex).
-
-
Max Bars to Calculate: (Default: 1000).
-
Keeps your MT5 fast. It limits how far back in history the lines are drawn. Increase this only if you need deep backtesting.
-
-
Colors:
-
Long Color: Liquidity generated by Longs (Potential Support).
-
Short Color: Liquidity generated by Shorts (Potential Resistance).
-
Peak Color: The color lines turn when Volume is extremely high (Major interest).
-