Spike Blast Pro

🚀 Spike Blaster Pro – The Ultimate Spike Detection Tool

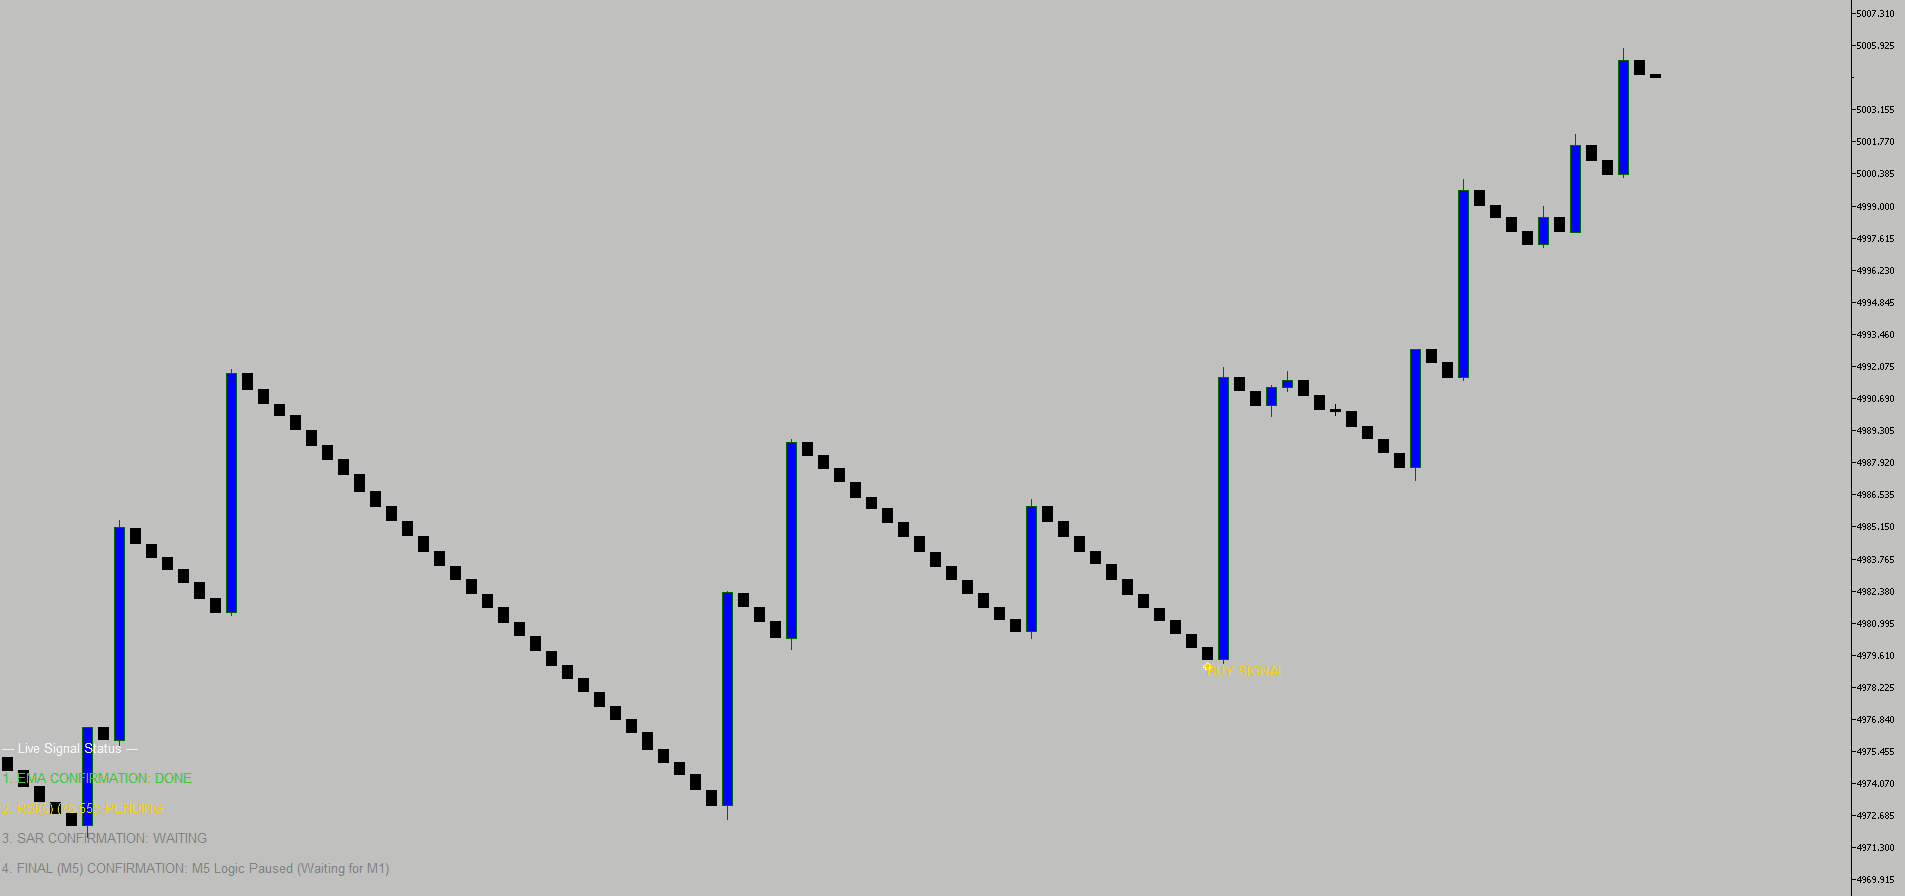
Spike Blaster Pro is a next-generation MT5 indicator designed specifically for synthetic markets. It works seamlessly on Boom Index and Weltrade Index, providing traders with sharp, reliable spike detection signals.

What makes Spike Blaster Pro powerful is its 5 Core Strategies built into one system, giving traders a multi-layer confirmation before signals appear. This ensures high accuracy and reduces false alerts.

🔑 5 Core Strategies Behind Spike Blaster Pro

  1. Volatility Compression Detector – Identifies when price is squeezing and a breakout spike is likely.

  2. Liquidity Zone Mapping – Locates hidden supply/demand levels where spike moves are triggered.

  3. Volume Surge Analysis – Confirms sudden inflow of contracts before a spike.

  4. Market Pattern Recognition – Detects broker-specific repetitive behaviors leading to spikes.

  5. Time & Session Filter – Activates signals only during high-probability market sessions.

🎯 Key Features

  • Works out of the box on Boom & Weltrade indices.

  • Clean chart arrows & alerts for easy spike entry.

  • Optimized for scalpers & spike hunters.

  • High accuracy from multi-layer confirmation.

  • Customizable alerts (pop-up, sound, push notifications).

  • Lightweight coding, no chart lag.

🏆 Why Choose Spike Blaster Pro?

Unlike ordinary spike indicators that rely on a single method, Spike Blaster Pro combines 5 proven strategies to detect only the strongest signals. This gives you confidence, precision, and consistency in your trades.

Whether you’re a beginner or advanced trader, Spike Blaster Pro is built to maximize your edge in synthetic markets.

Best suited for: Boom Index, Weltrade Index
Indicator Type: Spike Detection
💻 Platform: MetaTrader 5 (MT5)


Prodotti consigliati
L'indicateur SMC Venom Model BPR est un outil professionnel pour les traders travaillant dans le concept Smart Money (SMC). Il identifie automatiquement deux modèles clés sur le graphique des prix: FVG   (Fair Value Gap) est une combinaison de trois bougies, dans laquelle il y a un écart entre la première et la troisième bougie. Forme une zone entre les niveaux où il n'y a pas de support de volume, ce qui conduit souvent à une correction des prix. BPR   (Balanced Price Range) est une combinaiso
Volume Profile V6
Andrey Kolesnik
4.67 (3)
The volume profile indicator of the market + a smart oscillator. It works on almost all instruments-currency pairs, stocks, futures, cryptocurrency, on real volumes and on tick ones. You can set both the automatic definition of the profile range, for example, for a week or a month, etc., and set the range manually by moving the boundaries (two vertical lines red and blue). It is shown as a histogram. The width of the histogram at this level means, conditionally, the number of transactions condu
Visual CrossPulse Dynamics Indicator
AL MOOSAWI ABDULLAH JAFFER BAQER
Visual CrossPulse Dynamics: Trade with the Market's True Rhythm Unlock a new level of market insight with Visual CrossPulse Dynamics, a sophisticated trading indicator designed to adapt to ever-changing volatility and reveal the true direction of the trend. Are you tired of indicators that lag in fast-moving markets or give false signals during consolidation? The Visual CrossPulse Dynamics indicator solves this problem by using an advanced, adaptive algorithm that intelligently adjusts to the m
The new update makes this indicator a complete tool for studying, analyzing and operating probabilistic patterns. It includes: On-chart Multi-asset percentage monitor. Configurable martingales. Twenty-one pre-configured patterns, including Mhi patterns and C3. An advanced pattern editor to store up to 5 custom patterns. Backtest mode to test results with loss reports. Trend filter. Hit operational filter. Martingale Cycles option. Various types of strategies and alerts. Confluence between patter
Max Min Delta Indicator - Market Volume Imbalance Analysis Gain Deeper Insights into Market Volume Imbalance with Delta Analysis What is the Max Min Delta Indicator? The Max Min Delta Indicator is a powerful market volume analysis tool that visually represents maximum and minimum delta values using a histogram. It helps traders identify market strength, weakness, absorption, and aggressive buying/selling activity with precision. Key Features Histogram Visualization: Displays Max Delta (Green) an
Crash 1000 Scalping Indicator for the Crash 1000 Deriv Synthetic Index. Introduction The Crash 1000 Scalping Indicator is a specialized tool designed for the Crash 1000 index on the Deriv Synthetic market. This indicator is particularly useful for scalping on the M1 timeframe, helping traders to identify precise entry and exit points for buy positions. It is designed to be non-repainting, providing clear signals with audible alerts and push notifications, and is compatible with mobile devices th
No Demand No Supply MT5
Trade The Volume Waves Single Member P.C.
No Demand No Supply   This indicator identifies   No Demand –No Supply candles to your chart and plots volume bars colored according to the signal. It can be applied to all timeframes or to a specific one only. It can also be used as regular volume indicator  with exceptional future of WEIGHTED VOLUME. Furthermore is has an alert notification, sound and email when a signals occurs. The indicator does not repaint but the alert will come on two candles back due to the definition of No Demand No Su
Was: $249  Now: $99   Market Profile defines a number of day types that can help the trader to determine market behaviour. A key feature is the Value Area, representing the range of price action where 70% of trading took place. Understanding the Value Area can give traders valuable insight into market direction and establish the higher odds trade. It is an excellent addition to any system you may be using. Inspired by Jim Dalton’s book “Mind Over Markets”, this indicator is designed to suit the
Range Directional Force Indicator – Designed for You to Optimize! The Range Directional Force Indicator is a cutting-edge tool designed to empower traders by visualizing market dynamics and directional strength. Built to offer insights into market trends and reversals, this indicator is an invaluable asset for traders seeking precision in their strategies. However, it is important to note that this indicator is not optimized, leaving room for you to tailor it to your unique trading preferences.
Noize Absorption Index - is the manual trading system that measures the difference of pressure between bears forces and bulls forces. Green line - is a noize free index that showing curent situation. Zero value of index shows totally choppy/flat market.Values above zero level shows how powerfull bullish wave is and values below zero measures bearish forces.Up arrow appears on bearish market when it's ready to reverse, dn arrow appears on weak bullish market, as a result of reverse expectation.
PZ Mean Reversion MT5
PZ TRADING SLU
3 (2)
Indicatore unico che implementa un approccio professionale e quantitativo al trading di reversione. Sfrutta il fatto che il prezzo devia e ritorna alla media in modo prevedibile e misurabile, il che consente regole di entrata e uscita chiare che superano di gran lunga le strategie di trading non quantitative. [ Installation Guide | Update Guide | Troubleshooting | FAQ | All Products ] Segnali di trading chiari Incredibilmente facile da scambiare Colori e dimensioni personalizzabili Implementa l
CvdDeltaVolumes
Parasbhai N Patel
Delta + CVD & CVD Candles Order-flow indicator combining Delta (Ask–Bid), Cumulative Volume Delta (CVD), and a unique CVD-based synthetic candle system. Shows buy/sell pressure, volume aggressiveness, and momentum shifts with optional Delta histogram, CVD line, and CVD+Delta combined candles. Useful for scalping, intraday trading, divergence detection, and understanding buyer/seller dominance. Overview The Delta + CVD & CVD Candles Indicator combines multiple order-flow tools into one clean
Fibaction
Abdelkhalek Orabi
Indicator Name: Fibaction – price action candle Detector Description: Fibo Signal Boxes is a powerful Smart Money Concept (SMC)-inspired indicator that auto-detects price action candles. bullish hammers and shooting stars, then draws precise Fibonacci entry zones and multiple take-profit levels directly on the chart. as for the SL personally i use 40 pips rules  Key Features: Detects bullish hammer and shooting star reversal candles. Automatically draws Fibonacci entry and TP boxes. as
MACDivergence MTF MT5
Pavel Zamoshnikov
4 (5)
Advanced ideas of the popular MACD indicator: It detects and displays classic and reverse divergences (two methods of detecting divergences). It uses different color to highlight an uptrend and a downtrend. Two methods of determining a trend: а) MACD crosses the 0 level (classic signal); б) MACD crosses its own average (early signal). This is a multi-timeframe indicator: it can display MACD data from other timeframes. Two methods of drawing: classic histogram and line. It generates sound and vis
Mini Chart Indicators
Flavio Javier Jarabeck
The Metatrader 5 has a hidden jewel called Chart Object, mostly unknown to the common users and hidden in a sub-menu within the platform. Called Mini Chart, this object is a miniature instance of a big/normal chart that could be added/attached to any normal chart, this way the Mini Chart will be bound to the main Chart in a very minimalist way saving a precious amount of real state on your screen. If you don't know the Mini Chart, give it a try - see the video and screenshots below. This is a gr
Wapv Price and volume
Eduardo Da Costa Custodio Santos
L'indicatore di prezzo e volume WAPV per MT5 fa parte del set di strumenti (Wyckoff Academy Wave Market) e (Wyckoff Academy Price and Volume). L'indicatore di prezzo e volume WAPV per MT5 è stato creato per semplificare la visualizzazione del movimento del volume sul grafico in modo intuitivo. Con esso puoi osservare i momenti di picco del volume e i momenti in cui il mercato non ha interesse professionale Identifica i momenti in cui il mercato si muove per inerzia e non per movimento di "denaro
Delta Profile Volume
Teresinha Moraes Correia
Technical Description of the Indicator – Delta Profile for MetaTrader 5 The Delta Profile is an indicator developed for MetaTrader 5 focused on detailed analysis of volume flow within a defined range of candles. It organizes and displays information about the imbalance of positive volumes (associated with upward movements) and negative volumes (associated with downward movements) at different price levels. The result is a clear view of the chart points where the highest concentration of trades o
Trade smarter, not harder: Empower your trading with Harmonacci Patterns This is arguably the most complete harmonic price formation auto-recognition indicator you can find for the MetaTrader Platform. It detects 19 different patterns, takes fibonacci projections as seriously as you do, displays the Potential Reversal Zone (PRZ) and finds suitable stop-loss and take-profit levels. [ Installation Guide | Update Guide | Troubleshooting | FAQ | All Products ] It detects 19 different harmonic pri
**   All Symbols   x   All Timeframes   scan just by pressing scanner button ** Discount: The price is $50$, But now it is just $39, Limited time offer is active. *** Contact me  to send you instruction and add you in "Trend Reversal group" for sharing or seeing experiences with other users. Introduction: Trendlines are the most famous technical analysis in trading . Trendlines continually form on the charts of markets across all the different timeframes providing huge opportunities for traders
Do you use volume in your reading of the market? Certainly many traders use it, and do not imagine operating without it. The Color Histogram Volume Set indicator allows the user to choose the value that he considers interesting to monitor. When you pass this you will have visual confirmation and if you want you will also have the audible alert that is given by the indicator. Of course, there are other ways to try to find a high volume, such as assessing whether the volume is above av
The Trend Duration Forecast MT5 indicator is designed to estimate the probable lifespan of a bullish or bearish trend. Using a Hull Moving Average (HMA) to detect directional shifts, it tracks the duration of each historical trend and calculates an average to forecast how long the current trend is statistically likely to continue. This allows traders to visualize both real-time trend strength and potential exhaustion zones with exceptional clarity. KEY FEATURES Dynamic Trend Detection:   Utiliz
Il livello Premium è un indicatore unico con una precisione superiore all'80% delle previsioni corrette! Questo indicatore è stato testato dai migliori Specialisti di Trading per più di due mesi! L'indicatore dell'autore che non troverai da nessun'altra parte! Dagli screenshot puoi vedere di persona la precisione di questo strumento! 1 è ottimo per il trading di opzioni binarie con un tempo di scadenza di 1 candela. 2 funziona su tutte le coppie di valute, azioni, materie prime, criptovalu
VisualVol
Maxim Kuznetsov
The indicator highlights the points that a professional trader sees in ordinary indicators. VisualVol visually displays different volatility indicators on a single scale and a common align. Highlights the excess of volume indicators in color. At the same time, Tick and Real Volume, Actual range, ATR, candle size and return (open-close difference) can be displayed. Thanks to VisualVol, you will see the market periods and the right time for different trading operations. The indicator displays: T
Matrix Currency
Augusto Martins Lopes
Matrix Currency – Multi-Timeframe Analysis Tool The Matrix Currency is an advanced indicator designed to analyze currency strength in the Forex market. It provides efficient monitoring and strategic support for traders seeking clear and actionable insights. Key Features Multi-Timeframe Analysis : Simultaneously monitors multiple timeframes (from M1 to MN1) with real-time updates, displayed in an intuitive matrix format. Alert System : Customizable notifications via pop-up, email, and mobile devi
FREE
KT Renko Patterns MT5
KEENBASE SOFTWARE SOLUTIONS
KT Renko Patterns analizza il grafico Renko mattone per mattone per individuare i pattern grafici più famosi, frequentemente utilizzati dai trader nei vari mercati finanziari. Rispetto ai grafici basati sul tempo, i grafici Renko rendono il trading basato sui pattern più semplice e visivamente chiaro grazie alla loro struttura pulita. KT Renko Patterns include diversi pattern Renko, molti dei quali sono ampiamente spiegati nel libro “Profitable Trading with Renko Charts” di Prashant Shah. Un E
Multi ZigZag
Jose Freitas Alves Neto
# Indicador MultiZigZag Pro para MetaTrader 5 O MultiZigZag Pro é um poderoso indicador técnico para a plataforma MetaTrader 5 que identifica, de forma inteligente e flexível, os principais pontos de inflexão e tendências nos gráficos de preços. ## Características principais: - Algoritmo avançado que filtra ruídos e movimentos irrelevantes do mercado  - Múltiplos timeframes para análise de tendências de curto a longo prazo - Parâmetros de profundidade e desvio personalizáveis para adaptação a
Overview Heiken Ashi CE Filtered MT5 is a technical indicator for the MetaTrader 5 platform. It integrates smoothed candlestick charting with a dynamic exit strategy and a customizable trend filter to deliver clear buy and sell signals. The indicator is designed to improve trend detection and signal reliability by reducing market noise. If you want to see more high-quality products or order the development/conversion of your own products, visit my partners' website: 4xDev Get 10% OFF on manual
WAPV Weis Wave Chart Forex
Eduardo Da Costa Custodio Santos
Il Weis Wave Chart Forex per MT5 è un indicatore di prezzo e volume. La lettura del prezzo e del volume è stata ampiamente diffusa tramite Richard Demille Wyckoff sulla base delle tre leggi da lui create: offerta e domanda, causa ed effetto e sforzo contro risultato. Già nel 1900 R.Wyckoff utilizzava la carta delle onde nelle sue analisi. Molti anni dopo, intorno al 1990, David Weis ha automatizzato il diagramma delle onde di R. Wyckoff e oggi vi portiamo l'evoluzione del diagramma delle onde di
Owl Smart Levels MT5
Sergey Ermolov
4.03 (32)
Versione MT4  |  FAQ L' indicatore Owl Smart Levels è un sistema di trading completo all'interno dell'unico indicatore che include strumenti di analisi di mercato popolari come i frattali avanzati di Bill Williams , Valable ZigZag che costruisce la corretta struttura a onde del mercato, e i livelli di Fibonacci che segnano i livelli esatti di entrata nel mercato e luoghi per prendere profitti. Descrizione dettagliata della strategia Istruzioni per lavorare con l'indicatore Consulente-assistente
Gli utenti di questo prodotto hanno anche acquistato
Se acquisti questo indicatore, riceverai il mio Trade Manager Professionale + EA  GRATUITAMENTE. Innanzitutto è importante sottolineare che questo sistema di trading è un indicatore Non-Repainting, Non-Redrawing e Non-Lagging, il che lo rende ideale sia per il trading manuale che per quello automatico. Corso online, manuale e download di preset. Il "Sistema di Trading Smart Trend MT5" è una soluzione completa pensata sia per i trader principianti che per quelli esperti. Combina oltre 10 indicat
Divergence Bomber
Ihor Otkydach
4.91 (79)
Ogni acquirente dell’indicatore riceverà inoltre gratuitamente: L’utilità esclusiva “Bomber Utility”, che gestisce automaticamente ogni operazione, imposta i livelli di Stop Loss e Take Profit e chiude le posizioni secondo le regole della strategia I file di configurazione (set file) per adattare l’indicatore a diversi asset I set file per configurare il Bomber Utility in tre modalità: “Rischio Minimo”, “Rischio Bilanciato” e “Strategia di Attesa” Una guida video passo-passo per installare, conf
Azimuth Pro
Ottaviano De Cicco
5 (1)
LAUNCH PROMO Azimuth Pro price is initially set at 299$ for the first 100 buyers. Final price will be 499$ . THE DIFFERENCE BETWEEN RETAIL AND INSTITUTIONAL ENTRIES ISN'T THE INDICATOR — IT'S THE LOCATION. Most traders enter at arbitrary price levels, chasing momentum or reacting to lagging signals. Institutions wait for price to reach structured levels where supply and demand actually shift. Azimuth Pro maps these levels automatically: swing-anchored VWAP, multi-timeframe structure lines, an
Atomic Analyst MT5
Issam Kassas
4.19 (27)
Innanzitutto, vale la pena sottolineare che questo indicatore di trading non è repaint, non è ridisegno e non presenta ritardi, il che lo rende ideale sia per il trading manuale che per quello automatico. Manuale utente: impostazioni, input e strategia. L'Analista Atomico è un indicatore di azione del prezzo PA che utilizza la forza e il momentum del prezzo per trovare un miglior vantaggio sul mercato. Dotato di filtri avanzati che aiutano a rimuovere rumori e segnali falsi, e aumentare il pote
FX Power MT5 NG
Daniel Stein
5 (28)
FX Power: Analizza la Forza delle Valute per Decisioni di Trading Più Intelligenti Panoramica FX Power è lo strumento essenziale per comprendere la reale forza delle principali valute e dell'oro in qualsiasi condizione di mercato. Identificando le valute forti da comprare e quelle deboli da vendere, FX Power semplifica le decisioni di trading e rivela opportunità ad alta probabilità. Che tu segua le tendenze o anticipi inversioni utilizzando valori estremi di Delta, questo strumento si adatta
PZ Swing Trading MT5
PZ TRADING SLU
5 (5)
Protect against whipsaws: revolutionize your swing trading approach Swing Trading is the first indicator designed to detect swings in the direction of the trend and possible reversal swings. It uses the baseline swing trading approach, widely described in trading literature. The indicator studies several price and time vectors to track the aggregate trend direction and detects situations in which the market is oversold or overbought and ready to correct. [ Installation Guide | Update Guide | Tro
ARICoins
Temirlan Kdyrkhan
ARICoin is a powerful trading companion designed to generate high-probability entry signals with dynamic TP/SL/DP levels based on volatility. Built-in performance tracking shows win/loss stats, PP1/PP2 hits, and success rates all updated live. Key Features: Buy/Sell signals with adaptive volatility bands Real-time TP/SL/DP levels based on ATR Built-in MA Filter with optional ATR/StdDev volatility Performance stats panel (Success, Profit/Loss, PP1/PP2) Alerts via popup, sound, push, or email Cust
Gold Sniper Scalper Pro
Ich Khiem Nguyen
3.29 (7)
Gold Sniper Scalper Pro è un indicatore professionale per MetaTrader 5, progettato per supportare i trader nell'identificare punti di ingresso e gestire il rischio in modo efficace. L'indicatore fornisce un set completo di strumenti analitici che include un sistema di rilevamento dei segnali, gestione automatica di Entry/SL/TP, analisi del volume e statistiche delle performance in tempo reale. Guida utente per comprendere il sistema   |   Guida utente per altre lingue CARATTERISTICHE PRINCIPALI
ARIScalping
Temirlan Kdyrkhan
ARIScalp is a powerful trading companion designed to generate high-probability entry signals with dynamic TP/SL/DP levels based on volatility. Built-in performance tracking shows win/loss stats, PP1/PP2 hits, and success rates all updated live. Key Features: Buy/Sell signals with adaptive volatility bands Real-time TP/SL/DP levels based on ATR Built-in MA Filter with optional ATR/StdDev volatility Performance stats panel (Success, Profit/Loss, PP1/PP2) Alerts via popup, sound, push, or email Cus
Rtc ML Ai Predictor
Muhammad Faisal Sagala
Rtc ML Ai | Predictor CORE MACHINE LEARNING ENGINE Adaptive ML Market Predictor – Multi-Bar Trend & Candle Forecast What This Indicator Does This indicator is a  real-time market prediction engine  designed to analyze price behavior and estimate  future market tendencies . Unlike conventional indicators, this system  does not rely on static parameters or historical curve-fitting , but adapts its internal state dynamically during live market operation. Instead of using static rules, the indic
AriX
Temirlan Kdyrkhan
1 (4)
AriX Indicator for MT5 A powerful trend-following and signal-evaluation tool AriX is a custom MT5 indicator that combines Moving Averages and ATR-based risk/reward logic to generate clear buy/sell signals. It visualizes dynamic SL/TP levels, evaluates past trade outcomes, and displays win/loss statistics in a clean on-chart panel. Key features include: Buy/Sell signals based on MA crossovers ATR-based SL/TP1/TP2/TP3 levels with visual lines and labels Signal outcome tracking with real-time stat
Trend indicator AI mt5
Ramil Minniakhmetov
5 (13)
Trend Ai indicator è un ottimo strumento che migliorerà l'analisi di mercato di un trader combinando l'identificazione della tendenza con punti di ingresso utilizzabili e avvisi di inversione. Questo indicatore consente agli utenti di navigare nelle complessità del mercato forex con fiducia e precisione Oltre ai segnali primari, l'indicatore Ai di tendenza identifica i punti di ingresso secondari che si presentano durante i pullback o i ritracciamenti, consentendo ai trader di capitalizzare le
Innanzitutto, vale la pena sottolineare che questo Strumento di Trading è un Indicatore Non-Ridipingente, Non-Ridisegnante e Non-Laggante, il che lo rende ideale per il trading professionale. Corso online, manuale utente e demo. L'Indicatore Smart Price Action Concepts è uno strumento molto potente sia per i nuovi che per i trader esperti. Racchiude più di 20 utili indicatori in uno solo, combinando idee di trading avanzate come l'Analisi del Trader del Circolo Interno e le Strategie di Tradin
PZ Day Trading MT5
PZ TRADING SLU
2.83 (6)
Effortless trading: non-repainting indicator for accurate price reversals This indicator detects price reversals in a zig-zag fashion, using only price action analysis and a donchian channel. It has been specifically designed for short-term trading, without repainting or backpainting at all. It is a fantastic tool for shrewd traders aiming to increase the timing of their operations. [ Installation Guide | Update Guide | Troubleshooting | FAQ | All Products ] Amazingly easy to trade It provides
Super Signal – Skyblade Edition Sistema professionale di segnali di tendenza senza repaint / senza ritardo con tasso di vincita eccezionale | Per MT4 / MT5 Caratteristiche principali: Super Signal – Skyblade Edition è un sistema intelligente di segnali progettato specificamente per il trading di tendenza. Utilizza una logica di filtraggio multilivello per identificare esclusivamente i movimenti direzionali forti, supportati da un reale slancio (momentum). Questo sistema   non tenta di preveder
Advanced Supply Demand MT5
Bernhard Schweigert
4.5 (14)
La migliore soluzione per qualsiasi principiante o trader esperto! Questo indicatore è uno strumento di trading unico, di alta qualità e conveniente perché abbiamo incorporato una serie di funzionalità proprietarie e una nuova formula. Con questo aggiornamento, sarai in grado di mostrare fusi orari doppi. Non solo potrai mostrare una TF più alta, ma anche entrambe, la TF del grafico, PIÙ la TF più alta: SHOWING NESTED ZONES. Tutti i trader di domanda di offerta lo adoreranno. :) Informazioni imp
Weis Wave with Alert MT5
Trade The Volume Waves Single Member P.C.
4.94 (17)
Rental/Lifetime Package Options and Privileges  Rent Monthly Six Months   Yearly/Lifetime Weis Wave with Speed with Alert+Speed Index x x x Manual  x x x Quick Set up Video x x x Blog x x x Lifetime Updates x x x Setup and Training Material x x Discord Access Channel "The SI traders"          x Rectangle Break Alert Tool      x How to trade with it:    http://www.tradethevolumewaves.com   ** If you purchase please contact me to setup your  : Training Room and  complete manual access.  Wei
Berma Bands
Muhammad Elbermawi
5 (7)
L'indicatore Berma Bands (BBs) è uno strumento prezioso per i trader che cercano di identificare e capitalizzare i trend di mercato. Analizzando la relazione tra il prezzo e le BBs, i trader possono discernere se un mercato è in una fase di trend o di range. Visita il [ Berma Home Blog ] per saperne di più. Le Berma Bands sono composte da tre linee distinte: la Upper Berma Band, la Middle Berma Band e la Lower Berma Band. Queste linee sono tracciate attorno al prezzo, creando una rappresentazion
MetaForecast M5
Vahidreza Heidar Gholami
5 (3)
MetaForecast predice e visualizza il futuro di qualsiasi mercato basandosi sull'armonia dei dati dei prezzi. Sebbene il mercato non sia sempre prevedibile, se esiste un modello nei prezzi, MetaForecast può prevedere il futuro con la massima precisione possibile. Rispetto ad altri prodotti simili, MetaForecast può generare risultati più accurati analizzando le tendenze di mercato. Parametri di input Past size (Dimensione passata) Specifica il numero di barre che MetaForecast utilizza per creare
Quantum Trend Sniper
Bogdan Ion Puscasu
4.74 (53)
Presentazione       Quantum Trend Sniper Indicator   , l'innovativo indicatore MQL5 che sta trasformando il modo in cui identifichi e scambi le inversioni di tendenza! Sviluppato da un team di trader esperti con un'esperienza di trading di oltre 13 anni,       Indicatore Quantum Trend Sniper       è progettato per spingere il tuo viaggio di trading verso nuove vette con il suo modo innovativo di identificare le inversioni di tendenza con una precisione estremamente elevata. *** Acquista Quantum
Top indicator for MT5   providing accurate signals to enter a trade without repainting! It can be applied to any financial assets:   forex, cryptocurrencies, metals, stocks, indices .  Watch  the video  (6:22) with an example of processing only one signal that paid off the indicator! MT4 version is here It will provide pretty accurate trading signals and tell you when it's best to open a trade and close it. Most traders improve their trading results during the first trading week with the help of
Grabber System MT5
Ihor Otkydach
4.81 (21)
Ti presento un eccellente indicatore tecnico: Grabber, che funziona come una strategia di trading "tutto incluso", pronta all’uso. In un solo codice sono integrati strumenti potenti per l’analisi tecnica del mercato, segnali di trading (frecce), funzioni di allerta e notifiche push. Ogni acquirente di questo indicatore riceve anche gratuitamente: L’utility Grabber: per la gestione automatica degli ordini aperti Video tutorial passo dopo passo: per imparare a installare, configurare e utilizzare
ARIPoint
Temirlan Kdyrkhan
1 (1)
ARIPoint is a powerful trading companion designed to generate high-probability entry signals with dynamic TP/SL/DP levels based on volatility. Built-in performance tracking shows win/loss stats, PP1/PP2 hits, and success rates all updated live. Key Features: Buy/Sell signals with adaptive volatility bands Real-time TP/SL/DP levels based on ATR Built-in MA Filter with optional ATR/StdDev volatility Performance stats panel (Success, Profit/Loss, PP1/PP2) Alerts via popup, sound, push, or email Cu
Quantum TrendPulse
Bogdan Ion Puscasu
5 (20)
Ecco   Quantum TrendPulse   , lo strumento di trading definitivo che combina la potenza di   SuperTrend   ,   RSI   e   Stocastico   in un unico indicatore completo per massimizzare il tuo potenziale di trading. Progettato per i trader che cercano precisione ed efficienza, questo indicatore ti aiuta a identificare con sicurezza le tendenze di mercato, i cambiamenti di momentum e i punti di entrata e uscita ottimali. Caratteristiche principali: Integrazione SuperTrend:   segui facilmente l'andame
How many times have you bought a trading indicator with great back-tests, live account performance proof with fantastic numbers and stats all over the place but after using it, you end up blowing your account? You shouldn't trust a signal by itself, you need to know why it appeared in the first place, and that's what RelicusRoad Pro does best! User Manual + Strategies + Training Videos + Private Group with VIP Access + Mobile Version Available A New Way To Look At The Market RelicusRoad is the
Elliott Wave Trend was designed for the scientific wave counting. This tool focuses to get rid of the vagueness of the classic Elliott Wave Counting using the guideline from the template and pattern approach. In doing so, firstly Elliott Wave Trend offers the template for your wave counting. Secondly, it offers Wave Structural Score to assist to identify accurate wave formation. It offers both impulse wave Structural Score and corrective wave Structure Score. Structural Score is the rating to sh
Max Ribbon Mt5
Stefano Frisetti
ATTENZIONE: Questo indicatore è distribuito ESCLUSIVAMENTE su MQL5.com Versione MT4:   https://www.mql5.com/it/market/product/160363 Versione MT5:   https://www.mql5.com/it/market/product/160410 ================================================================================ MAX RIBBON ver 1.00 L'indicatore che ti mostra il TREND in modo chiaro e inequivocabile! ================================================================================ DESCRIZIONE MAX RIBBON è un indicatore di trend
TrendLine PRO MT5
Evgenii Aksenov
4.67 (33)
The Trend Line PRO indicator is an independent trading strategy. It shows the trend change, the entry point to the transaction, as well as automatically calculates three levels of Take Profit and Stop Loss protection. Trend Line PRO is perfect for all Meta Trader symbols: currencies, metals, cryptocurrencies, stocks and indices. The indicator is used in trading on real accounts, which confirms the reliability of the strategy. Robots using   Trend Line PRO   and real Signals can be found here: 
FX Volume MT5
Daniel Stein
4.76 (25)
FX Volume: Scopri il Vero Sentimento di Mercato dalla Prospettiva di un Broker Panoramica Rapida Vuoi portare la tua strategia di trading a un livello superiore? FX Volume ti offre informazioni in tempo reale su come i trader retail e i broker sono posizionati—molto prima che compaiano report in ritardo come il COT. Che tu miri a guadagni costanti o desideri semplicemente un vantaggio più solido sui mercati, FX Volume ti aiuta a individuare grandi squilibri, confermare i breakout e perfezionar
PZ Divergence Trading MT5
PZ TRADING SLU
3.71 (7)
Unlock hidden profits: accurate divergence trading for all markets Tricky to find and scarce in frequency, divergences are one of the most reliable trading scenarios. This indicator finds and scans for regular and hidden divergences automatically using your favourite oscillator. [ Installation Guide | Update Guide | Troubleshooting | FAQ | All Products ] Easy to trade Finds regular and hidden divergences Supports many well known oscillators Implements trading signals based on breakouts Displays
Altri dall’autore
Strong Bull V7 B&C  The ultimate M5 indicator for Boom & Crash indices, providing clear, filtered buy/sell signals to eliminate market noise and enhance your trading precision. Benefit-Focused Master the volatile Boom & Crash markets with Strong Bull V7 B&C . This intelligent indicator provides clear visual arrows and text labels for high-probability setups on the M5 timeframe. Its unique symbol-filtering technology automatically hides conflicting signals (no buys on Crash, no sells on Boom), en
Daily & Composite Volume Profile   This is a professional-grade market profile tool designed for MetaTrader 5. It utilizes a   Dual-Profile System   to visualize supply, demand, and liquidity concentrations. Key Features Left Side: Daily Session Profiles Automatically identifies the start and end of every trading day. Generates a unique Volume Profile for each individual day. Allows you to see how value migrated from yesterday to today (e.g., Is today's volume higher or lower than yesterday?).
Trend Duration Forecast It utilizes a Hull Moving Average (HMA) to detect trend direction and statistically forecasts the probable duration of the current move based on historical market behavior. Key Features Smooth Trend Detection:   Uses the Hull Moving Average (HMA) to filter noise while minimizing lag, providing clean Bullish/Bearish signals. Real-Time Duration Counter:   Displays a dynamic label at the start of the current trend showing the   "Real Length"   (number of bars the trend has b
FREE
Buy Sell Range
Israr Hussain Shah
The Range Filter Buy and Sell indicator is a trend-following technical analysis tool designed to identify optimal entry and exit points in the market. It filters out market noise by creating dynamic bands around price movements, generating clear buy and sell signals when price breaks through these bands. Key Features Dynamic Range Filtering : Uses a sophisticated algorithm to calculate adaptive bands that adjust to market volatility Trend Identification : Clearly visualizes the current trend dir
FREE
boom Spike Mitigation Zone Pro A professional spike pattern indicator built for synthetic traders who scalp and swing Boom 500/300/1000/600/900with precision.  This indicator: Detects powerful 3-candle spike formations (Spike → Pullback → Spike) Automatically draws a clean box around the pattern Marks the entry price from the middle candle Extends a horizontal mitigation line to guide perfect sniper entries Automatically deletes & redraws the line once price touches it (mitiga
FREE
Major Swing Fibonacci Indicator - Professional Trading Tool What It Does Automatically detects major swing points not internal noise Generates buy/sell signals at key Fibonacci levels Displays professional GUI panel with real-time analysis Marks major swings with visual indicators Trading Strategy BUY at 38.2%-61.8% Fibonacci support in uptrends SELL  Past performance is not indicative of future results. This indicator is for educational and informational purposes only and does not constitute in
FREE
Auto Analysis
Israr Hussain Shah
5 (1)
FiboPivot TrendLines - Comprehensive Market Analysis Indicator This powerful indicator combines Fibonacci pivot point analysis with automatic trend line detection, providing traders with a complete technical analysis toolkit in a single tool. Key Features : - Fibonacci Pivot Points: Automatically calculates and displays R1-R3, Pivot, and S1-S3 levels using previous day's data - Fractal-Based Trend Lines: Automatically draws channel trend lines based on fractal patterns - Interactive
FREE
Crash Spike Mitigation Zone Pro A professional spike pattern indicator built for synthetic traders who scalp and swing Crash 500/300/1000 with precision.  This indicator: Detects powerful 3-candle spike formations (Spike → Pullback → Spike) Automatically draws a clean box around the pattern Marks the entry price from the middle candle Extends a horizontal mitigation line to guide perfect sniper entries Automatically deletes & redraws the line once price touches it (mitigation)
FREE
Super Trend Live
Israr Hussain Shah
super trend version is to help you to have real time view of market move it will help you to get a live view of current market  buy signal line and arrow to help you understand batter the direction sell signal line and arrow to help you understand batter the direction trade what you see not what you think this is an simple and best trading tool for our traders of any market crypto gold 
FREE
Trade Like Pro
Israr Hussain Shah
A Smart Price Imbalance Tool with Arrows, Labels, and FVG Zones The Fair Value Gap (FVG) Indicator is designed to automatically detect price imbalance zones on the chart – a widely used concept in Smart Money Concepts (SMC) and Institutional Trading Models (ICT) . These gaps, also known as imbalances or inefficiencies , often highlight areas where price may return to "rebalance" liquidity. Many professional traders consider these levels as high-probability zones for potential reversals, retrace
Big Bull Scalper
Israr Hussain Shah
Big bull scalper Short Description Master market structure with the precision of the popular Big bull scalper  This tool automatically identifies key pivot highs and lows, plotting unique "angling" trend lines that dynamically define market context. It visually confirms Breaks of Structure (BOS) and Changes of Character (CHoCH), removing all guesswork from your analysis. Key Features:    Automatic Pivot Detection Instantly spots significant swing highs and lows.    Dynamic Angling Lines Visual
FREE
2025 Spike Killer Dashboard - Advanced Trading Signals & Market Analytics Transform Your Trading with Intelligent Market Insights! The 2025 Spike Killer Dashboard is a powerful MQL5 indicator that combines cutting-edge signal generation with an intuitive crystal dashboard for real-time market analysis. Designed for traders who demand precision and clarity, this all-in-one tool delivers actionable signals and comprehensive market metrics at a glance. Key Features: Dual Signal System Shved S
Smart trend pro
Israr Hussain Shah
Smart Trend pro New - Advanced Trend Indicator with Interactive GUI Professional trend-following indicator with comprehensive visualization and control panel Key Features: Advanced Trend Detection Reliable Half Trend algorithm for precise trend identification Color-coded trend lines (Blue for bullish, Orange for bearish) Customizable amplitude parameter for different trading styles Interactive GUI Panel Real-time market strength visualization (Bulls vs Bears) Current signal display (Buy/Se
FREE
Analysis Professor
Israr Hussain Shah
FiboPivot Dashboard - Professional Pivot Point Indicator What It Does FiboPivot Dashboard is a powerful technical analysis tool that automatically calculates and displays Fibonacci-based pivot points on your chart. It identifies key support and resistance levels based on the previous day's price action, helping traders anticipate potential price reversal points and breakout levels.   How to Use 1. **Install & Apply**: Simply attach the indicator to any chart (time frames below D1) 2. **
FREE
Trading Guide MT5 Indicator - Ultimate Trading Psychology Assistant Description The Trading Guide MT5 Indicator is a powerful psychological trading assistant designed to keep traders disciplined, focused, and emotionally balanced. This innovative indicator displays real-time motivational messages, trading rules, and analysis guidelines directly on your chart, with vibrant blinking colors to capture your attention and reinforce proper trading habits.  Key Features Real-Time Trading Psychology
FREE
Market Profile with Dashboard Indicator - Complete User Guide indicator Overview The Market Profile with Dashboard is a comprehensive trading analysis tool for MetaTrader 4 that displays market profile data, volume analysis, and key market structure information directly on your chart. This indicator helps traders identify significant price levels, market balance areas, and potential trading opportunities based on market profile theory. Core Components and Features Market Profile Display - Sh
Liquidity Channels Pro  MT5 VERSION HERE   Liquidity Channels  is a sophisticated Smart Money Concepts (SMC) tool designed to automate the identification of     Buy Side Liquidity (BSL)   and     Sell Side Liquidity (SSL) . Unlike standard support and resistance indicators, this tool doesn't just draw lines; it projects     dynamic expanding channels   based on volatility (ATR) from key pivot points. Crucially, it follows the "Mitigation" logic used by institutional traders:     once liquidity i
Risk Control Tool
Israr Hussain Shah
Smart Risk Manager – Risk/Reward Ratio & Position Sizing Tool for MT5 Overview (Short Description) A professional risk management indicator that helps traders calculate lot size, risk percentage, and reward ratio in real time. Perfect for Forex, Indices, Gold, and Synthetic Indices traders who want precise control over their capital. Full Description Trading without proper risk management is like driving without brakes. The Smart Risk Manager for MT5 gives you full control over your position siz
Bollinger Fibo Pro: The Ultimate Fusion of Volatility, Fibonacci, and Trend Analysis Short Description: Stop overloading your charts with dozens of indicators.   Bollinger Fibo  Pro   is a sophisticated, all-in-one trading system for MetaTrader 5 that merges two legendary concepts into a single, powerful tool. It enhances standard Bollinger Bands with precise Fibonacci extension levels and couples them with a non-repainting ZigZag to accurately identify trends, reversals, and key market structu
11 Modules Description & Final Analyzer Trading Guide 1. Reaction Engine 2.0 Purpose : Measures market pressure by analyzing tick movements, volume, and speed within a time window.   How it works : Calculates weighted price changes, considers tick velocity and volatility, and applies EMA smoothing.   Trading use : Strong positive values indicate buying pressure Strong negative values indicate selling pressure Use as confirmation for entry/exit signals 2. Flow Pattern Detector Purpose : Identifie
Color schemes
Israr Hussain Shah
Colors schemes powerful MetaTrader 5 script designed for traders who value speed and a personalized trading environment. With a single click, you can instantly transform your chart's appearance using one of several professional, pre-designed color schemes, including popular styles like ICT/SMC. How to Use: In your MetaTrader 5 terminal, open the Navigator window (Ctrl+N). Find the Colors schemes script under the "Scripts" section. Drag and drop the script onto the chart you want to customize. A
Binary Rise Fall
Israr Hussain Shah
Fractals_Price Indicator Description The Fractals_Price indicator is a technical analysis tool that identifies fractal patterns on price charts. Fractals are recurring patterns that signal potential trend reversals or continuation points. This indicator marks both upward and downward fractals with colored arrows and can display price labels at these points. Key Features  Identifies upward fractals (magenta arrows) marking potential resistance levels Identifies downward fractals (blue arrows)
The   Trend Analysis Dashboard   is a powerful, all-in-one technical analysis tool designed for traders who need a clear, consolidated view of market momentum across multiple timeframes. Instead of cluttering your chart with numerous separate indicators, this tool aggregates signals from four key oscillators (Stochastic, RSI, and dual CCI) into a single, easy-to-read panel. It calculates the directional bias (Buy, Sell, or Neutral) for each enabled timeframe and provides a visual summary of over
Trade Manger
Israr Hussain Shah
You Give an Instruction: When you run the script, a window pops up with a dropdown menu. You choose exactly what you want it to do from the list (e.g., "Close Profit Only" or "Delete Pending Orders"). It Scans Your Positions: The script then reads your instruction and systematically goes through your open trades and/or pending orders on the current chart. It Applies Your Rule: For each trade it finds, it checks if it matches the rule you selected. If you chose "Close Buy Only," it will only clo
Easy Chart Cleaner
Israr Hussain Shah
How the Chart Cleaner Script Works The Chart Cleaner is a one-click tool designed to instantly wipe your chart clean. When you drag and drop the script onto a chart, it scans for and removes all visual objects—including trend lines, horizontal lines, text labels, shapes, and any other drawings you have placed. The result is a completely clean, uncluttered chart, giving you a fresh workspace for your analysis. It's the fastest way to reset your chart to its default state.
Comprehensive Trading Analysis Tool This tool has four main parts that help traders understand the market and manage risk in a simple way 1 Risk and Reward Visual Tool It shows two boxes on the chart a pink box for risk and a navy blue box for reward It shows the risk to reward ratio You can move and resize the boxes It shows pips and possible money for risk and reward It gives a clear picture of possible profit and loss It helps plan trades before entering It keeps risk levels consistent It hel
What It Does Finds Order Blocks (ANN + SMC) on big and small timeframes. Marks them with clean bullish/bearish zones. Drops arrows (blue = BUY, red = SELL) right inside each block. Shows an info panel on the right with the exact high/low of the newest blocks. Lets you change chart colors (background, bull candle, bear candle) instantly. How To Use It Drop the indicator into MQL5/Indicators → restart MT5. Add it to your chart. In the settings: Pick your background , bull candle , and bear candle
FVG with Volume
Israr Hussain Shah
FVG Volume Profile (Institutional Price Action) Unlock the hidden liquidity inside Market Imbalances. The   FVG Volume Profile   is an advanced Price Action indicator that goes beyond standard Fair Value Gap detection. It looks inside the gap using lower timeframe data to construct a   Volume Profile   specifically for that imbalance. This helps you identify exactly where the "Smart Money" is defending positions. Key Features:   Internal Volume Profile:   Automatically scans lower timeframes
Breakout Boxes with Volume Pressure This indicator automates the identification of key consolidation zones (Supply and Demand) based on Market Pivots and Volatility (ATR). Unlike standard support/resistance tools, this indicator provides a unique   Volume Pressure Analysis   inside every box, giving you insight into the battle between Buyers and Sellers before a breakout occurs. Key Features Automated Supply & Demand Zones:   Automatically detects significant Pivot Highs and Lows to draw dyna
1. Tool Description The   Dynamic Liquidity HeatMap Profile   is an advanced technical indicator originally designed by BigBeluga (Pine Script) and ported to MQL5. Unlike a standard Volume Profile which shows where volume   has   occurred, this tool attempts to visualize where liquidity (limit orders and stop losses) is   likely waiting   (resting liquidity). It works by identifying pivots (local highs and lows) weighted by volume and ATR.   Crucially, if price moves through a level, that liquid
Filtro:
Nessuna recensione
Rispondi alla recensione