Indicador Fimathe
- Indicatori
- Versione: 3.0
- Aggiornato: 14 luglio 2026
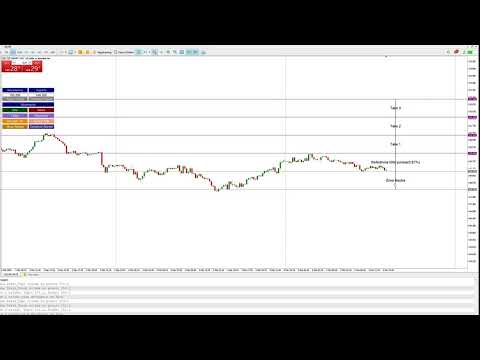
Fimathe Indicator
The Fimathe Indicator is a tool for MetaTrader 5 designed to help traders identify support, resistance, neutral zones, and price channels. It features an interactive interface for drawing and managing support and resistance levels, generating take-profit channels and neutral zones, and providing visual and sound alerts for breakouts.
Key Features
-
Support and Resistance Lines:
-
Dynamic and draggable lines to identify key levels.
-
-
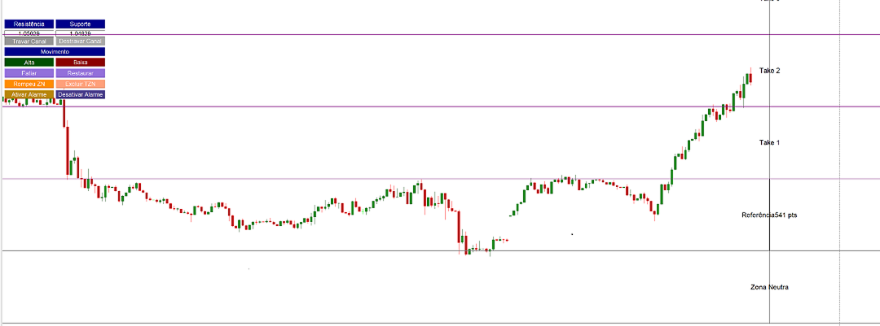
Reference Channel:
-
Creates a channel between support and resistance, displaying the distance in pips.
-
-
Neutral Zone and Take-Profit Channels:
-
Generates a neutral zone and multiple take-profit channels based on market direction (uptrend or downtrend).
-
-
Channel Slicing:
-
Divides the channel into quartiles (25%, 50%, 75%) to identify areas of interest.
-
-
Interactive Buttons:
-
Lock/Unlock: Prevents or allows adjustment of the lines.
-
Uptrend/Downtrend: Sets the market direction to generate zones and channels.
-
Slice/Restore: Activates or deactivates slicing lines.
-
Breakout NZ: Generates take-profit channels after a neutral zone breakout.
-
Delete RZN: Removes generated take-profit channels.
-
-
Alerts:
-
Visual and sound alerts for breakouts of support, resistance, or neutral zones.
-
Benefits
-
Ease of Use: Intuitive interface with interactive buttons.
-
Accuracy: Calculations based on current prices.
-
Customization: Adjust colors, line thickness, and number of take-profit levels.
-
Alerts: Notifications for breakouts
Applications
-
Technical Analysis: Identify key levels and areas of interest.
-
Risk Management: Set profit targets and stop-loss levels based on take-profit channels.
-
Breakout Strategies: Monitor breakouts and project new channels.


muito bom