Guarda i video tutorial del Market su YouTube
Come acquistare un Robot di Trading o un indicatore
Esegui il tuo EA
hosting virtuale
hosting virtuale
Prova un indicatore/robot di trading prima di acquistarlo
Vuoi guadagnare nel Market?
Come presentare un prodotto per venderlo con successo
Nuovi indicatori tecnici per MetaTrader 4 - 48
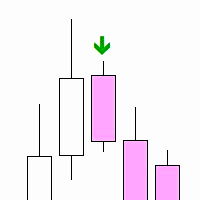
"Inside Bar PA" is a technical indicator designed to determine the inner bars on the chart. An internal bar is a bar or candle, the maximum and minimum of which are completely contained in the previous bar. This may signal a potential reversal or continuation of the trend, depending on the context.
Features: Automatic detection of internal bars. Visual marking of internal bars with arrows on the chart. The ability to adjust the distance of the mark from the bar. How to use: Attach the indicato
FREE

Let us introduce you to a new era of neural indicators for financial markets! Intelligent Moving is a unique indicator that trains its neural network in real time! You no longer need to look for the optimal indicator parameters for each specific situation. No more late signals. The artificial intelligence is able to adapt itself and predict any market movements.
Visually, the indicator is drawn as a main solid moving average line, two dotted lines of standard deviations and signal arrows. For

Smart Liquidity Levels is a valuable tool for identifying optimal liquidity levels, enabling retail traders like us to strategically set our stop-loss orders. T he essential tool for traders seeking to maximize their trading success. The liquidity level is a critical component of inner circle trading (ICT). It assists us in determining when and how we should enter the market. Watch the video for detailed instructions. Here's why understanding liquidity levels is crucial in trading and how our
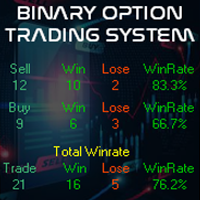
Buy And Sell Binary Option on the MetaTrader 4 (MT4) platform is a specialized technical analysis tool designed to assist traders in identifying binary option trading opportunities using the latest market algorithms. This indicator has been enhanced with an algorithm that incorporates the most up-to-date market information and processes it into a histogram. Additionally, the indicator comes with alert features, including pop-up alerts and email notifications. Latest Market Algorithm : Our indica

Candles Size ( Points ) Please leave a review about this product to help other users benefit from it. This simple tool provides crucial insights into current and historical market conditions, helping traders make informed decisions. Identify the longest candlestick over a customizable historical period. This information helps you spot significant price movements. See on YOUTUBE for key features This indicator is compatible with MetaTrader 4 The indicator is easy to install and use, making it
FREE

Discover the power of precision and efficiency in your trading with the " Super Auto Fibonacci " MT4 indicator. This cutting-edge tool is meticulously designed to enhance your technical analysis, providing you with invaluable insights to make informed trading decisions. Key Features: Automated Fibonacci Analysis: Say goodbye to the hassle of manual Fibonacci retracement and extension drawing. "Super Auto Fibonacci" instantly identifies and plots Fibonacci levels on your MT4 chart, saving you tim
FREE
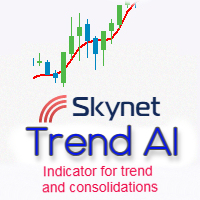
Skynet Trend AI shows trend on the price chart with a colored line. Usually, all traders are looking for a clue where to buy and where to sell using classic or downloaded indicators. But often it gets more and more confusing and every time you find it difficult and confusing to create a hint for yourself where to open a position. Self-reliance does not always justify the result. Therefore, it is better to use a simple and intuitive tool to solve your problem! Skynet Trend AI gives visual
This is a custom indicator based on the Exponential Moving Average (EMA) angle, typically used to measure the trend angle of EMA lines. Here are the main parameters and functions of this indicator: Main Parameters: md1: Fast period for EMA, default value is 12. md2: Slow period for EMA, default value is 26. md3: Period for the MACD signal line, default value is 9. Functions: The indicator calculates the MACD indicator and categorizes data into different buffers based on the direction and angle o
FREE
"Maxi Super Signal" - Your Ultimate MT4 Signal Indicator! Are you tired of missing out on profitable trading opportunities? Look no further! Introducing "Maxi Super Signal," the must-have MT4 signal indicator that will revolutionize your trading experience. Key Features: Accurate Signals: Maxi Super Signal employs cutting-edge algorithms to provide you with highly accurate buy and sell signals. Say goodbye to guesswork and hello to informed trading decisions. User-Friendly Interface: Our intuiti

The Fantastic Price Entry Signal Indicator is a powerful tool designed to assist traders in making informed decisions in the financial markets. This advanced indicator leverages cutting-edge algorithms and technical analysis to identify potential entry points with high accuracy.
Features: 1. Precision Entry Points: The indicator generates precise arrow signals on the chart, highlighting potential entry points for various trading strategies.
2. Trend Identification: By analyzing price mov

This indicator is based on the MACD indicator
Also, some candlestick patterns are used in it to identify better signals
Can be used in all symbols
Can be used in all time frames
Easy to use method
Adequate settings
Settings: period: The number of candles used to calculate signals. pFast: Like the MACD indicator settings pSlow: Like the MACD indicator settings
alarmShow: If you want to receive an alert in Metatrader after receiving the signal, enable this setting alarmShowNoti: If you want to
FREE

The SuperTrend indicator is a popular technical analysis tool used by traders and investors to identify trends in the price of a financial instrument, such as a stock, currency pair, or commodity. It is primarily used in chart analysis to help traders make decisions about entering or exiting positions in the market. this version of super trend indicator is exactly converted from trading view to be used in MT4

An indicator based on candlestick patterns
To catch short-term and long-term trends
If it gives a signal in the direction of the trend, it is long term
And if it gives a signal in the opposite direction of the trend, it is short term
Too many signals
Can be used in all symbols
Can be used in all time frames
Attributes: Too many signals Can be used in all symbols Can be used in all time frames Simple settings Simple and fast usage With author lifetime support
Settings: Candle back: The number

OVERVIEW
A Lorentzian Distance Classifier (LDC) is a Machine Learning classification algorithm capable of categorizing historical data from a multi-dimensional feature space. This indicator demonstrates how Lorentzian Classification can also be used to predict the direction of future price movements when used as the distance metric for a novel implementation of an Approximate Nearest Neighbors (ANN) algorithm. This indicator provide signal as buffer, so very easy for create EA from this indi

This indicator is based on the RSI indicator
Also, some candlestick patterns are used in it to identify better signals
Can be used in all symbols
Can be used in all time frames
Easy to use method
Adequate settings
Settings: period: The number of candles used to calculate signals. alarmShow: If you want to receive an alert in Metatrader after receiving the signal, enable this setting alarmShowNoti: If you want to receive an alert on your mobile after receiving a signal, enable this setting Ala

If you are good at trading at levels This indicator is all you need levels to manage your trades Market is usually follow current trend when break out some levels or reverse
Trade at the Institutional traders level with the best supply and demand zone indicator available in MT4 and MT5 The Secret Profit Levels Signals indicator for MT4 is a complete trading system that provides traders with the entry price and 2 take profit levels. Technical analysts use support and resistance levels to identi
Questo indicatore personalizzato per MetaTrader 4 (MT4) genera segnali di acquisto e vendita basati sulla variazione percentuale dell'RSI (Relative Strength Index) rispetto a un periodo specifico. Ecco come funziona in breve:
1. L'indicatore calcola l'RSI per il periodo specificato (`RSI_Period`) e confronta il valore RSI corrente con quello di un numero di barre precedenti (`Bars_Back`).
2. Calcola la variazione percentuale dell'RSI tra i due periodi.
3. Se la variazione percentuale supera
FREE
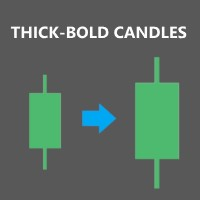
Description: Expand the width of your candles horizontally in MT4 to improve visibility when zooming in or out of the chart. Once attached to the chart, the indicator will automatically double the size of the candles compared to their normal value. Main indicator inputs: Body: size of the candle body Wick: size of the candle wick Additionally, you have the option to change the color of the candle body. We hope you find this free and useful indicator enjoyable!
FREE

The strategy is based on Order-Block concept with MVB(Most Volatile Bar) concept. To determine a good zone of concern to focus for users, the zone are painted in blue and target levels are in thin redline. The mindset behind this indicator was to help users grow naturally while also making money trading. This strategy works so well on XAUUSD, the win rate is over 85%. To Buy! > Trader MUST see a Bullish Engulfing Candlestick pattern (HIGHER High, HIGHER Close Candle), at the Bank Zone (The Blu

Forex Breath System è un sistema di trading basato sui trend che può essere utilizzato con qualsiasi mercato. Puoi utilizzare questo sistema con valute, metalli, materie prime, indici, criptovalute e persino azioni. Può essere utilizzato anche con qualsiasi intervallo di tempo. Il sistema è universale. Mostra la tendenza e fornisce segnali di freccia con la tendenza. L'indicatore può anche fornirti un tipo speciale di avvisi quando i segnali appaiono nella direzione del trend, il che rende il tr

Ecco la traduzione del testo "Unveiling the Non-Repainting XY Trend Indicator: Your Ultimate Guide to Forex and Binary Options Success" in italiano: Titolo: Svelare l'indicatore di tendenza XY non riverniciato: la tua guida definitiva al successo nel Forex e nelle opzioni binarie Nel mondo dinamico del trading Forex e delle opzioni binarie, è fondamentale rimanere all'avanguardia. I trader sono costantemente alla ricerca di strumenti che possano offrire loro un vantaggio competitivo, e uno di qu

Scopo principale: "Pin Bars" è progettato per rilevare automaticamente le barre dei pin sui grafici dei mercati finanziari. Una barra pin è una candela con un corpo caratteristico e una lunga coda, che può segnalare un'inversione di tendenza o una correzione.
Come funziona: L'indicatore analizza ogni candela sul grafico, determinando la dimensione del corpo, della coda e del naso della candela. Quando viene rilevata una barra pin corrispondente a parametri predefiniti, l'indicatore la segna su
FREE

Il software di interfaccia Scalper Terminal è un indicatore, non effettua transazioni automatiche di acquisto-vendita. Questo indicatore mostra l'attuale zona di trading in cui è possibile inserire transazioni quando si verifica un'opportunità commerciale di scalping. Quando c'è un segnale di scalping, sul lato destro della relativa coppia di trading, la luce turchese si accende e sopra di essa è scritta l'esatta direzione del trading. Successivamente, fai clic sul pulsante Turchese per inserir
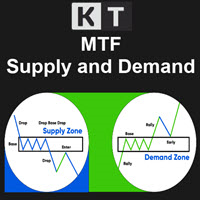
L’indicatore KT Supply and Demand individua e disegna le principali zone di offerta e domanda. Lo fa analizzando i punti di swing e utilizzando un’analisi multi-timeframe, così da evidenziare solo le aree davvero cruciali. Questo metodo avanzato mette in risalto le zone da cui il prezzo può invertire, nate dai recenti squilibri tra compratori e venditori.
Funzionalità
Analisi precisa: L’algoritmo raffinato individua con esattezza le zone chiave, spesso preludio a forti movimenti di prezzo. Vis

PTS - Divergence Buy Finder di Precision Trading Systems
Il Precision Divergence Finder è stato progettato per individuare i minimi di mercato con estrema precisione e lo fa frequentemente.
Nell'analisi tecnica, l'arte di individuare i minimi di mercato è generalmente molto più semplice rispetto a individuare i massimi, e questo strumento è progettato appositamente per questa finalità. Dopo aver identificato una divergenza rialzista, è saggio attendere che la tendenza si inverta prima di acqu

L'indicatore di vendita PTS Divergence Finder di Roger Medcalf - Precision Trading Systems. Questo indicatore fornisce solo segnali ribassisti - di vendita. In primo luogo, mi è stato chiesto molte volte perché non avessi fornito un indicatore di divergenza di vendita mentre fornivo volentieri un indicatore di ricerca di divergenza di segnali di acquisto da molti anni. Ho risposto che le divergenze di vendita sono meno affidabili delle divergenze di acquisto, cosa che è ancora vera. Alcune soluz
Advanced Trend System è un indicatore innovativo che utilizza un algoritmo proprietario che consente di trovare potenziali punti di inversione di tendenza con un'alta probabilità e ricevere segnali per entrare nel mercato all'inizio di una formazione di tendenza. L'indicatore seguirà le attuali condizioni di mercato e solo quando tutte le strategie interne saranno concordate e saranno in confluenza al 100% l'una con l'altra, l'indicatore fornirà un segnale di acquisto o vendita. L'indicatore è

Codice PTS Demand Index di Precision Trading Systems
Il Demand Index è stato creato da James Sibbet e utilizza un codice complesso per semplificare l'interpretazione del volume e del prezzo come combinazione.
Comprendere i volumi non è mai un compito facile, ma questo bellissimo pezzo di programmazione certamente rende tutto più facile.
Ci sono diversi modi in cui questo indicatore può essere vantaggioso per trader e investitori.
Divergenze (Come indicatore principale) Dopo aver studiato
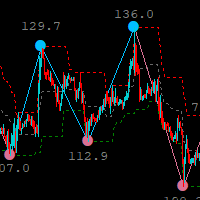
basato sull'indicatore a zigzag, l'indicatore del canale alto basso a zigzag è uno strumento per avvisare il trader di un cambiamento di tendenza, è di grande utilità
poiché avvisa tempestivamente di un cambiamento nella tendenza attuale, l'indicatore ha un'opzione su più intervalli di tempo per scambiare intervalli di tempo più alti o più bassi
canale sull'intervallo di tempo corrente, questo indicatore è un'aggiunta al tuo sistema/strategia e può essere utilizzato come strumento autonomo per f
FREE

Based on the trend-following principle of CCI, it has been improved to become an indicator that can identify the reversal of the trend and its development direction, that is, it can identify the top and bottom attenuation of the oscillating trend in the trend market. feature The red and green columns represent the trend of bullish or bearish development under the current cycle. The blue line shows the position and attenuation of the current price trend in the current cycle. The upper and lower r
FREE

BB & RSI Candle Color: Technical Analysis Indicator on MetaTrader 4 The "BB & RSI Candle Color" indicator is a powerful technical analysis tool designed for MetaTrader 4 traders looking for an effective visual representation of market conditions. Created by 13 Crow Trading Club, this indicator combines the popular Bollinger Bands and the Relative Strength Indicator (RSI) to provide clear and accurate visual signals. This indicator offers three key aspects: Candle Color: Normal candles are displa
FREE

EZZ Elite Zig Zag is an indicator for the MetaTrader 4 terminal. This indicator traces the peak of the trend based on the market reversal, thus showing various opportunities in the financial market. EZZ Elite Zig Zag is a visual tool, intuitive, and easy to understand and use.
Test it Yourself by Downloading it for Free.
Author Paulo Rocha all rights reserved

Unlock the power of precision in your forex trading with the Precise Magic Arrow signal indicator. This versatile indicator is designed to provide you with weekly average signals for all major currency pairs, revolutionizing your trading strategy and enhancing your decision-making process. Key Features: Universal Applicability: "Precise Magic Arrow" is compatible with all currency pairs, ensuring that you have access to valuable signals across the forex market. Weekly Averages: Receive weekly

Super Trend Channels MT4 Indicator Looking for a versatile and powerful channel indicator for your MetaTrader 4 trading platform? Look no further than the "Super Trend Channels" indicator! This advanced tool is designed to help traders identify trend channels accurately, enabling you to make informed trading decisions with confidence. Key Features: Multi-Channel Support: The "Super Trend Channels" indicator supports multiple channels simultaneously. You can visualize various channel types, inclu

Enhance your trading strategies with the " MA Trend Filter " indicator for MetaTrader 4. This powerful tool is designed to help you make more informed trading decisions by effectively filtering market trends using Moving Averages (MA). Key Features: Efficient Trend Filtering: The "MA Trend Filter" uses Moving Averages to filter out noise and highlight significant market trends. It simplifies complex price data, making it easier to identify potential entry and exit points. Customizable Settings:

Discount: It will be $39 for a week or for 2 purchases! Contact me to send you instruction and add you in group.
QM (Quasimodo) Pattern is based on Read The Market(RTM) concepts. The purpose of this model is to face the big players of the market (financial institutions and banks), As you know in financial markets, big traders try to fool small traders, but RTM prevent traders from getting trapped. This style is formed in terms of price candles and presented according to market supply and dem

Unlock the full potential of your trading strategy with the Large Strong Signal MT4 Signal Indicator. Designed with precision and reliability in mind, this powerful tool empowers traders with invaluable insights to make informed trading decisions. Here's why "Large Strong Signal" stands out in the crowded landscape of trading indicators: Enhanced Market Awareness : Gain a deeper understanding of market dynamics through our meticulously crafted indicator. It offers a comprehensive view of price

A combined indicator of two famous indicators: RSI , Bollinger Bands Can be used in all currency pairs Can be used in all time frames with many signals Very simple and fast to use
Description:
This indicator is made from the combination of RSI and Bollinger Bands indicators
As you can see, it shows good signals and is worth using and testing
We hope you are satisfied with this indicator
Settings: show past show candle: Displays the number of candles that the indicator calculates.
For example
FREE
Introduction to the Candle Time Indicator The Candle Time Indicator for MetaTrader 4 (MT4), helps users know how much time on a candlestick is remaining. This is a simple but incredibly powerful and useful tool. To download the Dagangduit CandleTime.mq4 indicator, check the bottom of this post. It’s one of the best forex time indicators in its category. The function of the indicator will not change, even if you change the name of the indicator. The candlestick countdown timer will tell you how m

The QQE indicator is a momentum-based indicator used to identify trends and sideways. The Qualitative Quantitative Estimate (QQE) indicator works like a smoothed version of the popular Relative Strength Index (RSI) indicator. QQE extends the RSI by adding two volatility-based trailing stops. This indicator is converted from Trading View QQE MOD by Mihkel00 to be used in MT4 Version.
CHRISTMAS SALE — LIMITED TIME!
Get Trend Reader Indicator with a huge –65% discount AND receive Trend Matrix EA as a FREE BONUS ! Special Christmas Price: $107
(Regular Price: $297 — You Save $190!) FREE BONUS: Trend Matrix EA
A powerful multi-symbol strategy packed with advanced features, supporting 10 trading pairs — real value: $447! After completing your purchase, simply contact me and I will send you your BONUS EA immediately. Don’t miss this once-a-year opportunity! Trend Reader Indica

Are you in search of a reliable tool to enhance your trading experience on MetaTrader 4? Look no further! "Great Safe Signal" is here to elevate your trading strategy and provide you with invaluable insights for making informed decisions. Key Features: Precision Analysis: "Great Safe Signal" employs advanced algorithms to analyze market trends and price movements with pinpoint accuracy. This ensures that you have the most precise information at your fingertips. User-Friendly Interface: We unders
Daily Monitoring : The indicator automatically calculates and displays the daily drawdown on your trading chart, allowing you to see how well you're performing on a daily basis. Risk Management : By monitoring daily drawdown, traders can better manage their risk. It helps to keep daily losses within acceptable limits. Real-Time Information : Daily drawdown is updated in real-time, providing accurate and up-to-date information about your trading performance. How to Use: Activate the "Daily Drawd
The "Dagangduit Spread Indicator" is a versatile tool designed to provide traders with essential information about the current spread in the chart window. This indicator offers customizable features, including font parameters, display location on the chart, spread normalization, and alerts to enhance your trading experience. Key Features: Real-time Spread Display : The indicator displays the current spread in real-time on your trading chart, allowing you to stay informed about the cost of execut

Swing trading is a method in which traders attempt to take advantage of market fluctuations. They buy a security when they believe the market will rise and sell if they feel the market will fall, which, as you can imagine, is common in most trading strategies, irrespective of trading style.
The four most frequently occurring patterns in the swing trading domain are reversal, retracement (or pullback), breakouts, and breakdowns.
it work all currency pair, and work all timeframe
100% non repaint

Innanzitutto, vale la pena sottolineare che questo Strumento di Trading è un Indicatore Non-Ridipingente, Non-Ridisegnante e Non-Laggante, il che lo rende ideale per il trading professionale. Corso online, manuale utente e demo. L'Indicatore Smart Price Action Concepts è uno strumento molto potente sia per i nuovi che per i trader esperti. Racchiude più di 20 utili indicatori in uno solo, combinando idee di trading avanzate come l'Analisi del Trader del Circolo Interno e le Strategie di Trading

Strumento di Canale di Regressione". Utilizzando questo strumento, i trader possono ottenere un controllo eccezionale sul canale di regressione del proprio grafico, consentendo loro di prendere decisioni di trading più informate. Lo Strumento di Canale di Regressione è uno strumento potente nella cassetta degli attrezzi di un trader. È progettato per fornire preziose informazioni sulle tendenze dei prezzi e sui potenziali livelli di supporto e resistenza. Lo strumento è particolarmente efficace

Line Breakouts - Sistema per il trading di trend.
Contiene un identificatore di tendenza che può essere adattato a qualsiasi grafico e strumento di trading utilizzando la funzione periodo e livellamento.
E un determinante dei livelli di supporto e resistenza. Quando il prezzo è al di sotto della linea di resistenza, apri le operazioni di vendita e quando il prezzo è al di sopra della linea di supporto, apri le operazioni di acquisto. Lo stop loss dovrebbe essere posizionato a pochi punti dalle l

The Levels indicator has been created to simplify the process of plotting support and resistance levels and zones on selected timeframes. The indicator plots the nearest levels of the selected timeframes, which are highlighted in different colors. It significantly reduces the time needed to plot them on the chart and simplifies the market analysis process. Horizontal support and resistance levels are used to identify price zones where the market movement can slow down or a price reversal is lik

Introducing Auto Trendline Pro : Your Ultimate Trading Companion Are you tired of manually drawing trendlines on your forex charts? Do you wish for a tool that can simplify your trading while providing timely alerts? Look no further, because Auto Trendline Pro is here to revolutionize your trading experience. In the fast-paced world of forex trading, staying ahead of the curve is essential. Identifying trends, both upward and downward, can be a game-changer. This is where Auto Trendline Pro s

This is the Full Version, to get the free version please contact me. The free version works on “GBPCHF” charts. All symbols and time frames scanner. Harmonic Pattern
Harmonic patterns are used in technical analysis that traders use to find trend reversals. They are considered one of the most accurate technical analysis tools, as they allow traders to predict the future price movement direction and the potential trend targets. Also, unlike many other technical tools, the number of false signals

The indicator is specially designed for the trading utility Trade Shell (included Trade Shell SMC ) to get it working on visual strategy tester.
Backtest your trading ideas and indicators. Run Trade Shell on visual tester and then put this indicator on the chart. After that you will be able to control all functions of the Trade Shell as well as with live using! It does not work live! Use it with visual tester only. It does not require to set any setting on input parameters.
Have a good luck
FREE

Tester Periods is the useful indicator for visual strategy tester which extend chart periods. Its designed for the trading utility Trade Shell (included Trade Shell SMC ).
Run the Trade Shell on the visual tester. Then put the Tester Periods indicator on the chart. If you wanna see timeframes M1, M5, M10, M15 , for example, then you have to run visual tester on M1 and to define multipliers like that: TimeFrame_Periods_Multiplier = 1,5,10,15 If you wanna see timeframes M5, M20, M30, H1, for
FREE

This is the Full Version, to get the free version please contact me. The free version works on “USDJPY” charts. All symbols and time frames scanner. Contact me after payment to send you the User-Manual PDF File. OVER and UNDER
Over & Under pattern is an advanced price action trading concept in the trading industry. The Over & Under pattern is more than a confluence pattern or entry technique than a trading strategy. It is a reversal pattern that is created after a significant obvious trend. It
Here is another version of famous Super Trend indicators which is modified by Kivanc Ozbilgic. I have get the code from Trading View and converted it to MT4 language. this is great opportunity for Trading View users who want to migrate to MT4 so can test this indicator and also make their custom EAs based on it. there are much more inputs than standard super trend also there are up/down arrows with alarms as well.
Drawdown Alerts Free ! Meta Trader 4 Indicator. Please leave a review about this product to help other users benefit from it. This Drawdown Alerts indicator shows the drawdown percentage in real time and alerts you when the limit you specify is reached. Calculation of drawdown depends on the amount of the trade balance. You can customize Drawdown Alerts for Corner - Left , Right , Up , Down X Y Color Number of decimal digits Popup messages and sound - Turn on / off notifications Notification
FREE
The Nice Pro Signal Signal Indicator is a powerful tool designed to assist traders in making informed decisions in the financial markets. This advanced indicator leverages cutting-edge algorithms and technical analysis to identify potential entry points with high accuracy.
Features: 1. Precision Entry Points: The indicator generates precise arrow signals on the chart, highlighting potential entry points for various trading strategies.
2. Trend Identification: By analyzing price movements

" Valiant Strong Trend " - Your Ultimate MT4 Signal Indicator Are you ready to elevate your trading game to new heights? Look no further than the "Valiant Strong Trend" MT4 signal indicator, your indispensable tool for navigating the complex world of financial markets. Key Features: Precise Trend Identification : "Valiant Strong Trend" employs advanced algorithms to accurately identify market trends, whether they are bullish or bearish. Say goodbye to guesswork and hello to informed trading deci
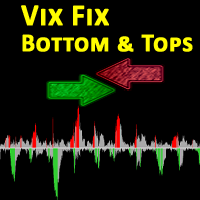
The VIX Fix is a volatility indicator developed by renowned trader Larry Williams. It's designed to measure volatility in assets that don't have options or futures, such as individual stocks and forex markets. Essentially, it acts as a synthetic VIX (Volatility Index) for any asset , providing a gauge of market uncertainty. This modified version of William's indicator helps you to find market bottoms and market tops. It comes with 2 styles: Stochastic and histogram style. Please see screenshot

The Awesome Cross Trend Signal Indicator is a powerful tool designed to assist traders in making informed decisions in the financial markets. This advanced indicator leverages cutting-edge algorithms and technical analysis to identify potential entry points with high accuracy.
Features: 1. Precision Entry Points: The indicator generates precise arrow signals on the chart, highlighting potential entry points for various trading strategies.
2. Trend Identification: By analyzing price movem
The Real Strong Signal Signal Indicator is a powerful tool designed to assist traders in making informed decisions in the financial markets. This advanced indicator leverages cutting-edge algorithms and technical analysis to identify potential entry points with high accuracy.
Features 1. Precision Entry Points: The indicator generates precise arrow signals on the chart, highlighting potential entry points for various trading strategies.
2. Trend Identification: By analyzing price movemen

Recommended on M15 and higher timeframes
Sends alerts and notifications when the zone is create
Sends alerts and notifications if zones are retested
You will see the trading zones and identify the most profitable points to open positions. The indicator marks the supply and demand zones.
With this show you will now make profitable trades that will set the trends.
Shows all support and resistance zones.
Can work in all time zones.
No need to mess with complicated settings, all settings are
FREE

The Multi-Timeframe High Low Points (MTF High Low Points) indicator is a powerful tool for traders using MetaTrader 4 (MT4) to analyze price movements across different timeframes. This versatile indicator helps traders identify significant support and resistance levels by displaying the highest and lowest price points within a specified number of bars on multiple timeframes simultaneously. Key Features: Multi-Timeframe Analysis: MTF High Low Points allows traders to monitor high and low price le
FREE

Nombre del Indicador: Two Lines Color II Descripción: El indicador "Two Lines Color II", desarrollado por 13 Crow Trading Club, es una versión más rápida de su predecesor, el "Two Lines Color 1". Este indicador ha sido diseñado para brindar señales aún más tempranas sobre posibles cambios de tendencia en el mercado financiero. Características Principales: Mayor Velocidad de Señales: Two Lines Color II ofrece señales más rápidas en comparación con su versión anterior. La rápida velocidad de las s
FREE

Title : UT_Bot - ATR-Based Trading Indicator Introduction : Discover the power of "UT_Bot," the ultimate trading indicator that leverages the Average True Range (ATR) to provide unparalleled accuracy in your trading decisions. If you're seeking a more reliable alternative to the Super Trend indicator, look no further. UT_Bot is your key to precision trading. Key Features : ATR-Powered Precision: UT_Bot uses the ATR to deliver accurate signals that adapt to market volatility. Enhanced Trend Detec

Title : Market Bias Indicator - Oscillator-Based Trading Tool Introduction : Discover the potential of the "Market Bias Indicator," a revolutionary oscillator-based trading tool designed for precise market analysis. If you're in search of a robust alternative to traditional bias indicators, your quest ends here. Market Bias Indicator offers unparalleled accuracy in identifying market sentiment and is your gateway to confident trading decisions. Recommended Trading Pairs : Market Bias Indicator i
ATR Stops is an indicator which shows Dynamic support and resistance lines by considering ATR value and also a multiplier. its highly effective to find out the trend direction and also is useful for using as stop loss levels. it could be used in different ways one usual way is to buy when line becomes green and sell when it becomes red. when its combined with money management rules and risk reward considerations there is good results.

Pivot Point Super Trend is another type of famous super trend indicator which is equipped with pivot points in different way. this indicator used to be available in the Trading view and this is converted from there to the MT4 language. MT5 version of the indicator is also available and you can find in my products. there are also buy/sell signals shown on the screen.

Pure Safe Trend indicator is designed for signal trading. This indicator generates trend signals.
It uses many algorithms and indicators to generate this signal. It tries to generate a signal from the points with the highest trend potential.
This indicator is a complete trading product. This indicator does not need any additional indicators.
The indicator certainly does not repaint. The point at which the signal is given does not change.
Features and Suggestions Time Frame: H1 Work

Indicador: Engulfing Candle Strategy El indicador "Engulfing Candle Strategy"! Este indicador personalizado para MetaTrader 4 identifica y resalta automáticamente las formaciones de velas "Engulfing", una poderosa señal técnica utilizada por traders de todo el mundo. ¿Qué es una vela "Engulfing"? Una vela "Engulfing" es una formación de dos velas consecutivas en un gráfico de precios. La primera vela es más pequeña y está completamente contenida dentro del rango de la segunda vela, que es sign
Il MetaTrader Market è un sito semplice e pratico dove gli sviluppatori possono vendere le loro applicazioni di trading.
Ti aiuteremo a pubblicare il tuo prodotto e ti spiegheremo come prepararne la descrizione per il Market. Tutte le applicazioni sul Market sono protette da crittografia e possono essere eseguite solo sul computer dell'acquirente. La copia illegale è impossibile.
Ti stai perdendo delle opportunità di trading:
- App di trading gratuite
- Oltre 8.000 segnali per il copy trading
- Notizie economiche per esplorare i mercati finanziari
Registrazione
Accedi
Se non hai un account, registrati
Consenti l'uso dei cookie per accedere al sito MQL5.com.
Abilita le impostazioni necessarie nel browser, altrimenti non sarà possibile accedere.