Fair Value Gaps with Order Block Detector
- Indicatori
-
Cao Minh Quang
 Welcome to my profile. I am a developer MQL4 and MQL5.
Telegram: https://t.me/storevan
Thanks and regards! - Versione: 2.2
- Aggiornato: 5 dicembre 2025
- Attivazioni: 10
The latest version of Indicator is fully integrated into an all-in-one package, including:
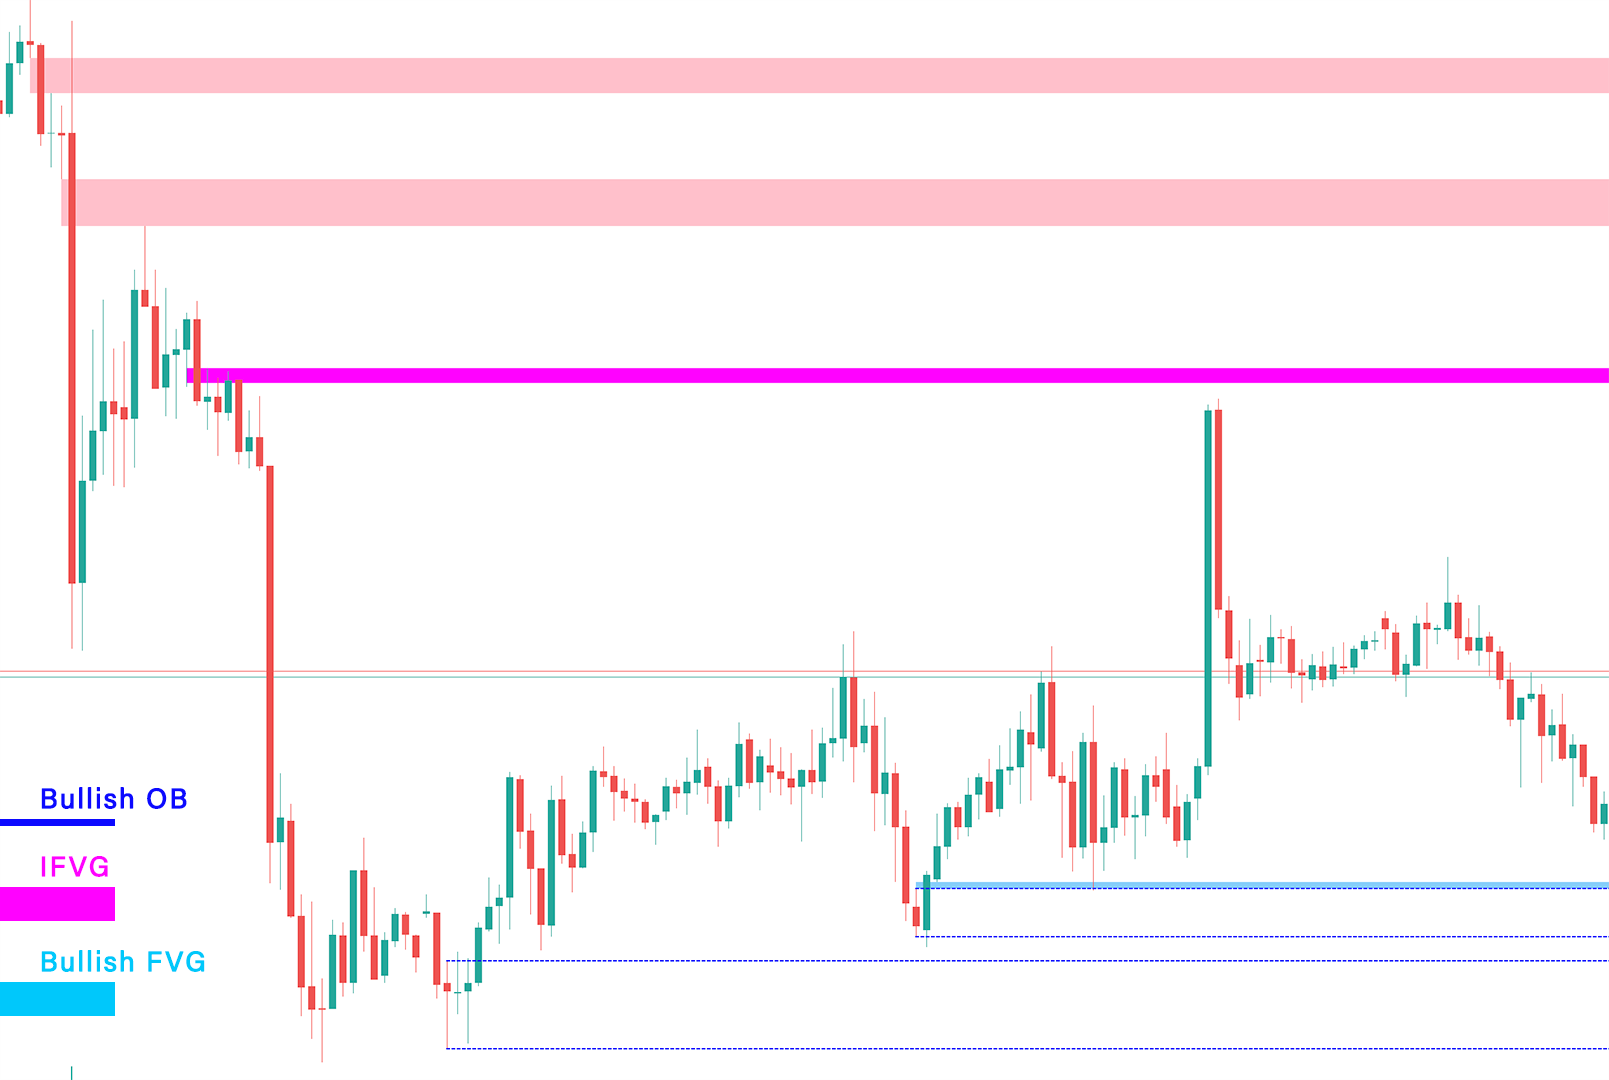
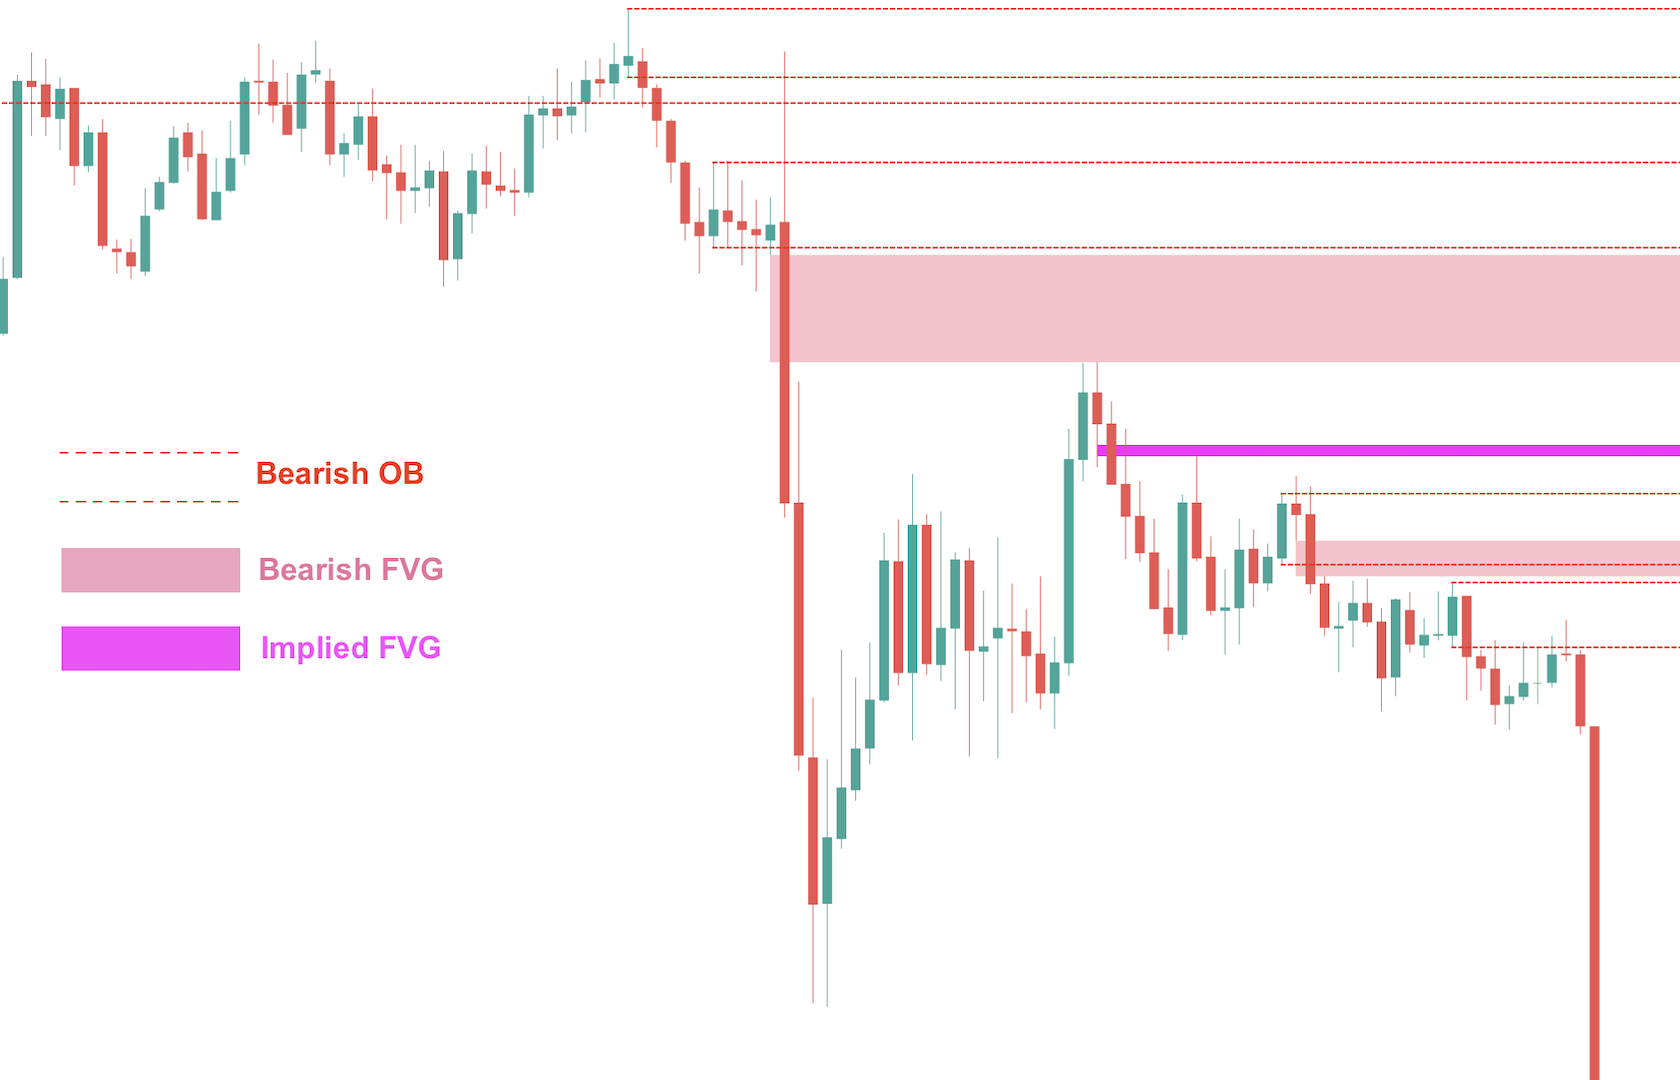
- Fair Value Gaps (FVG).
- Implied Fair Value Gap (IFVG).
- OrderBlock (OB).
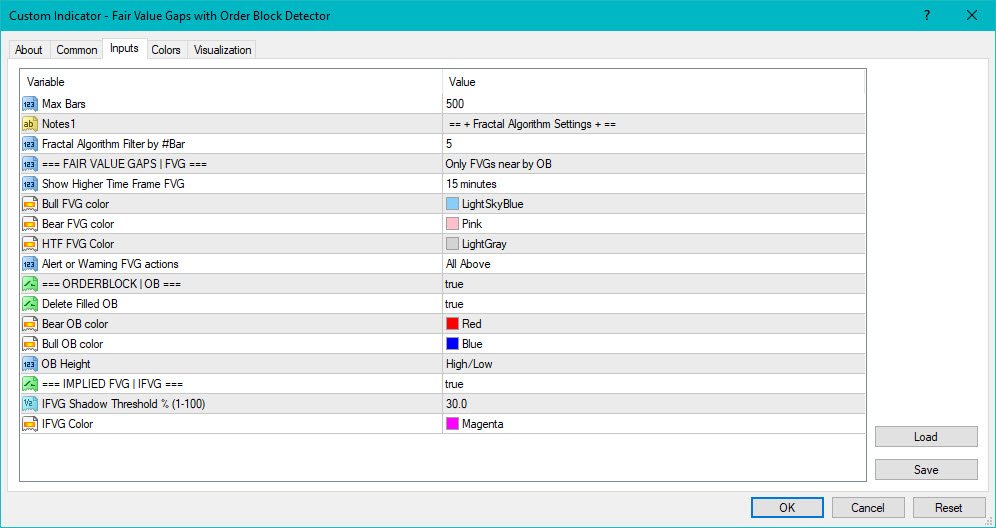
The options in the settings section are relatively easy to navigate, and you can even use them right away upon activation without encountering difficulties when using the default configuration.
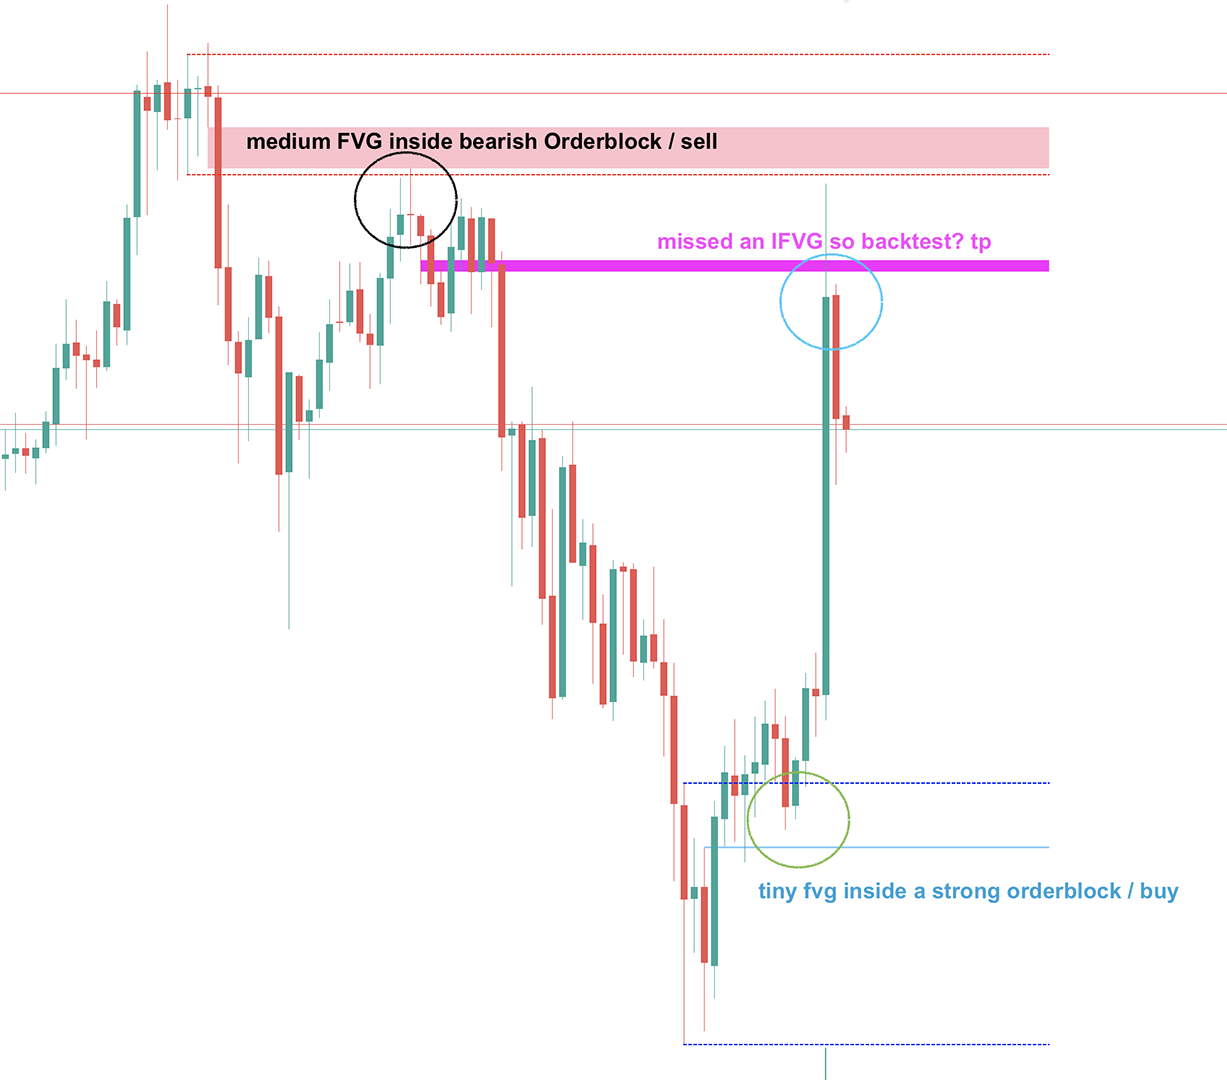
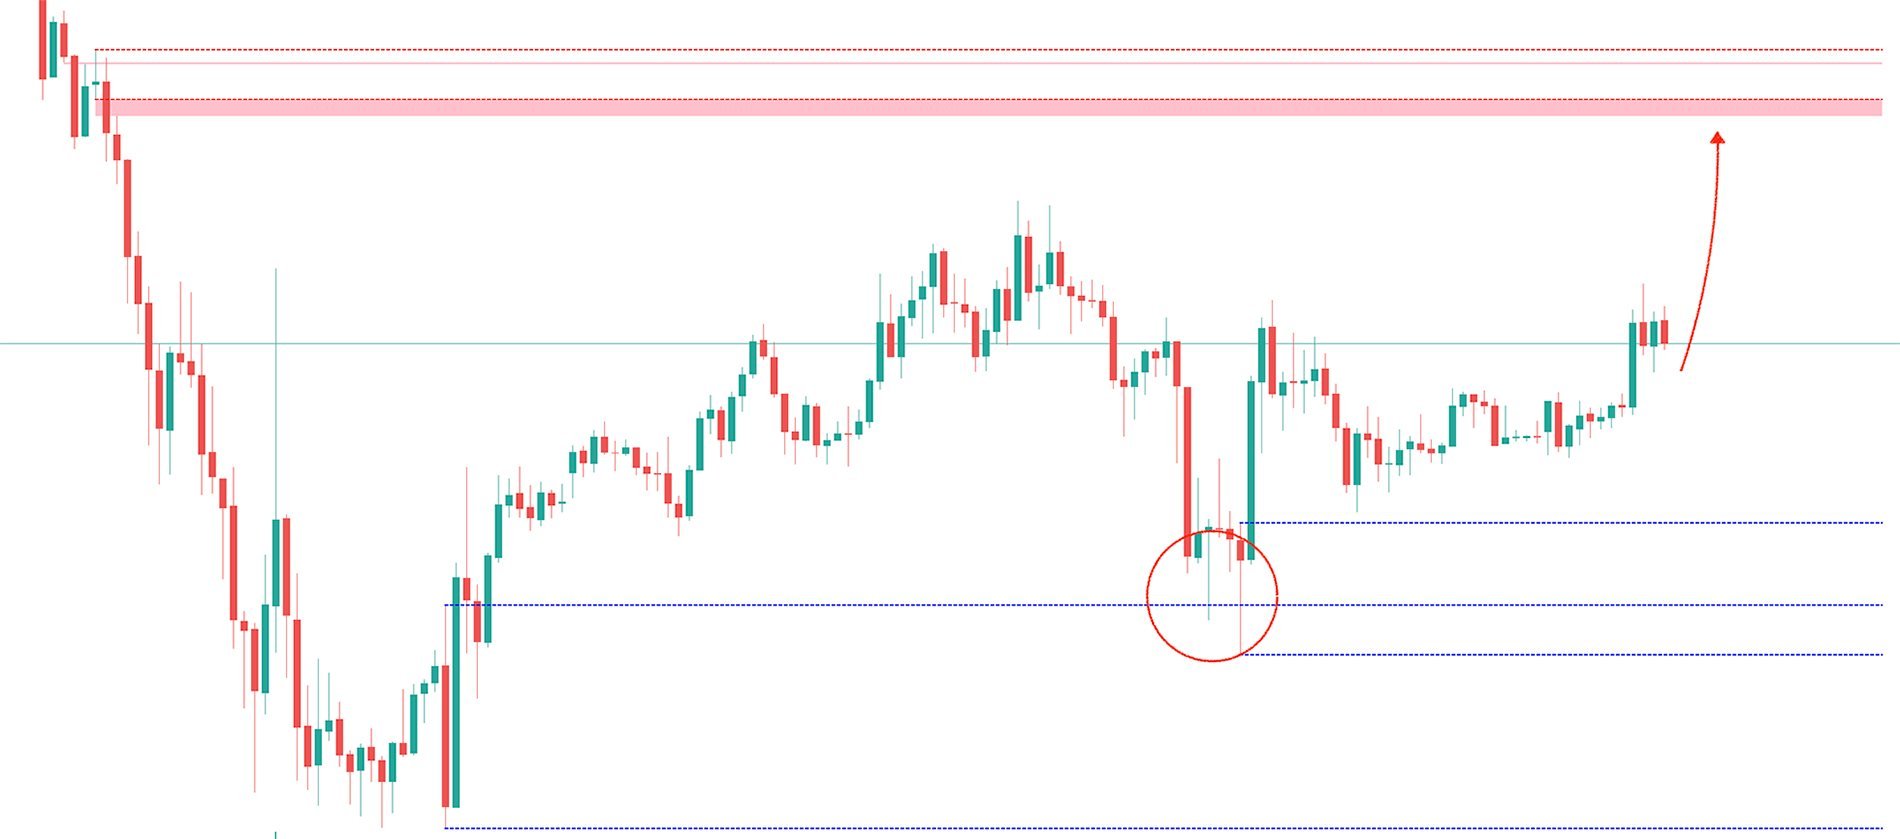
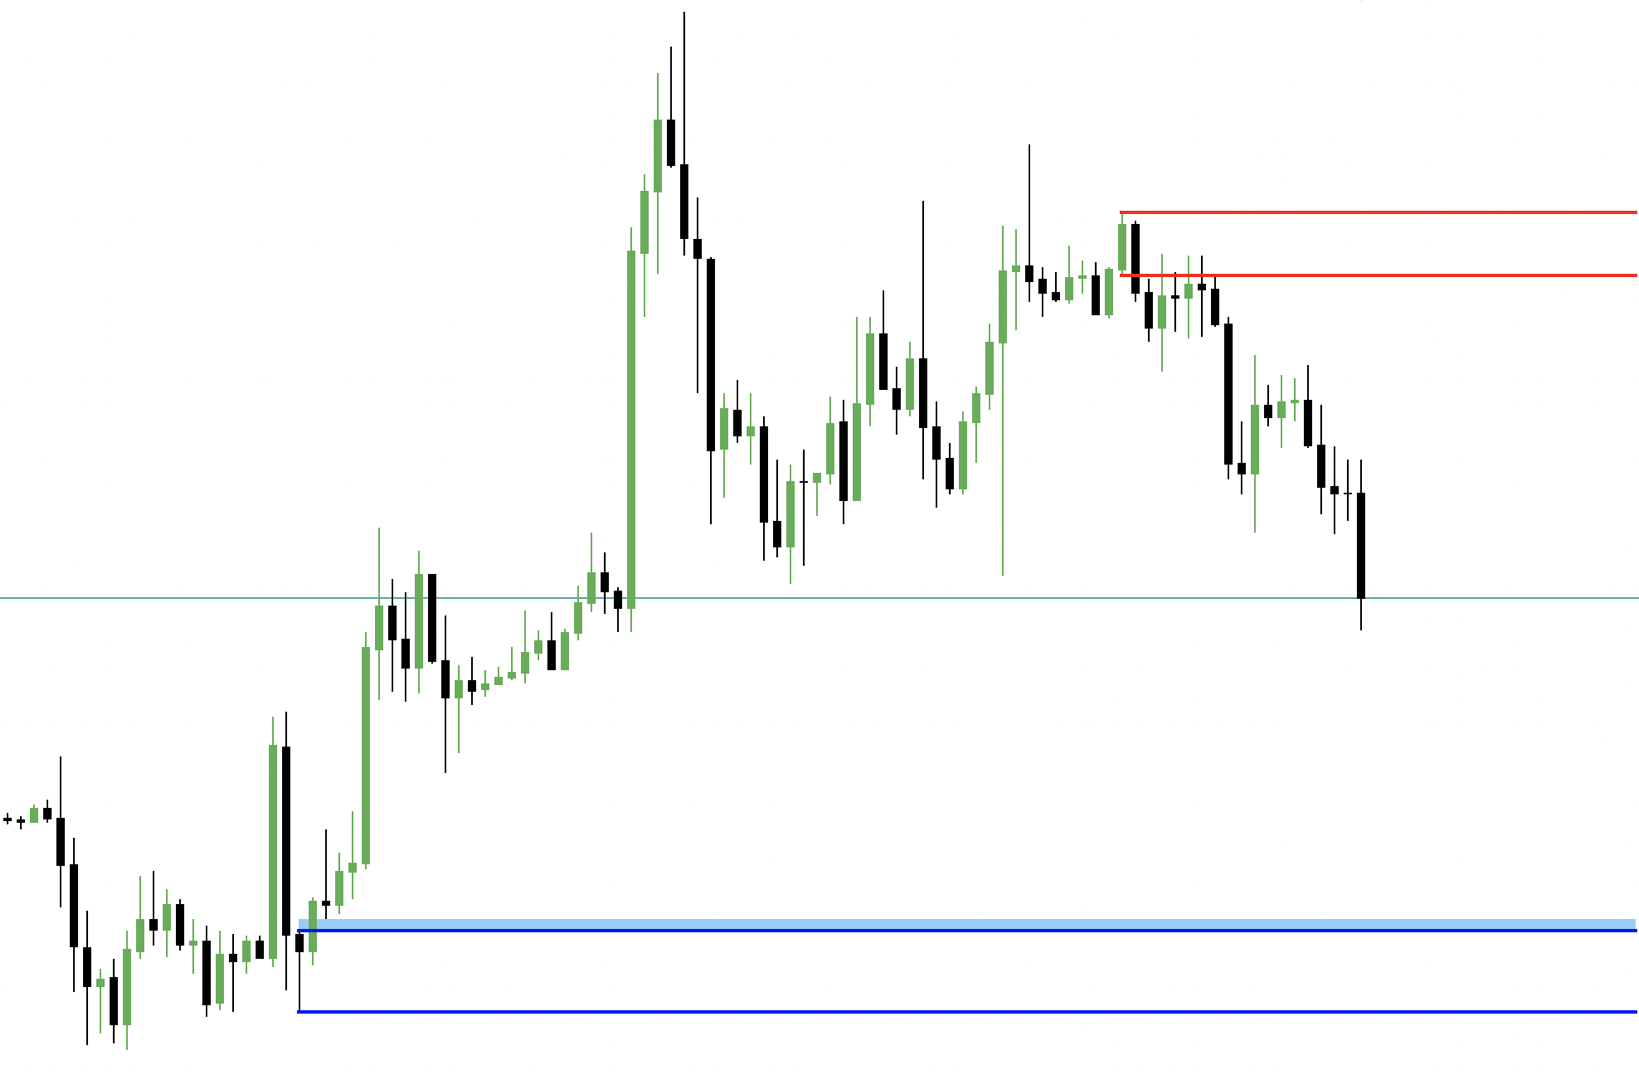
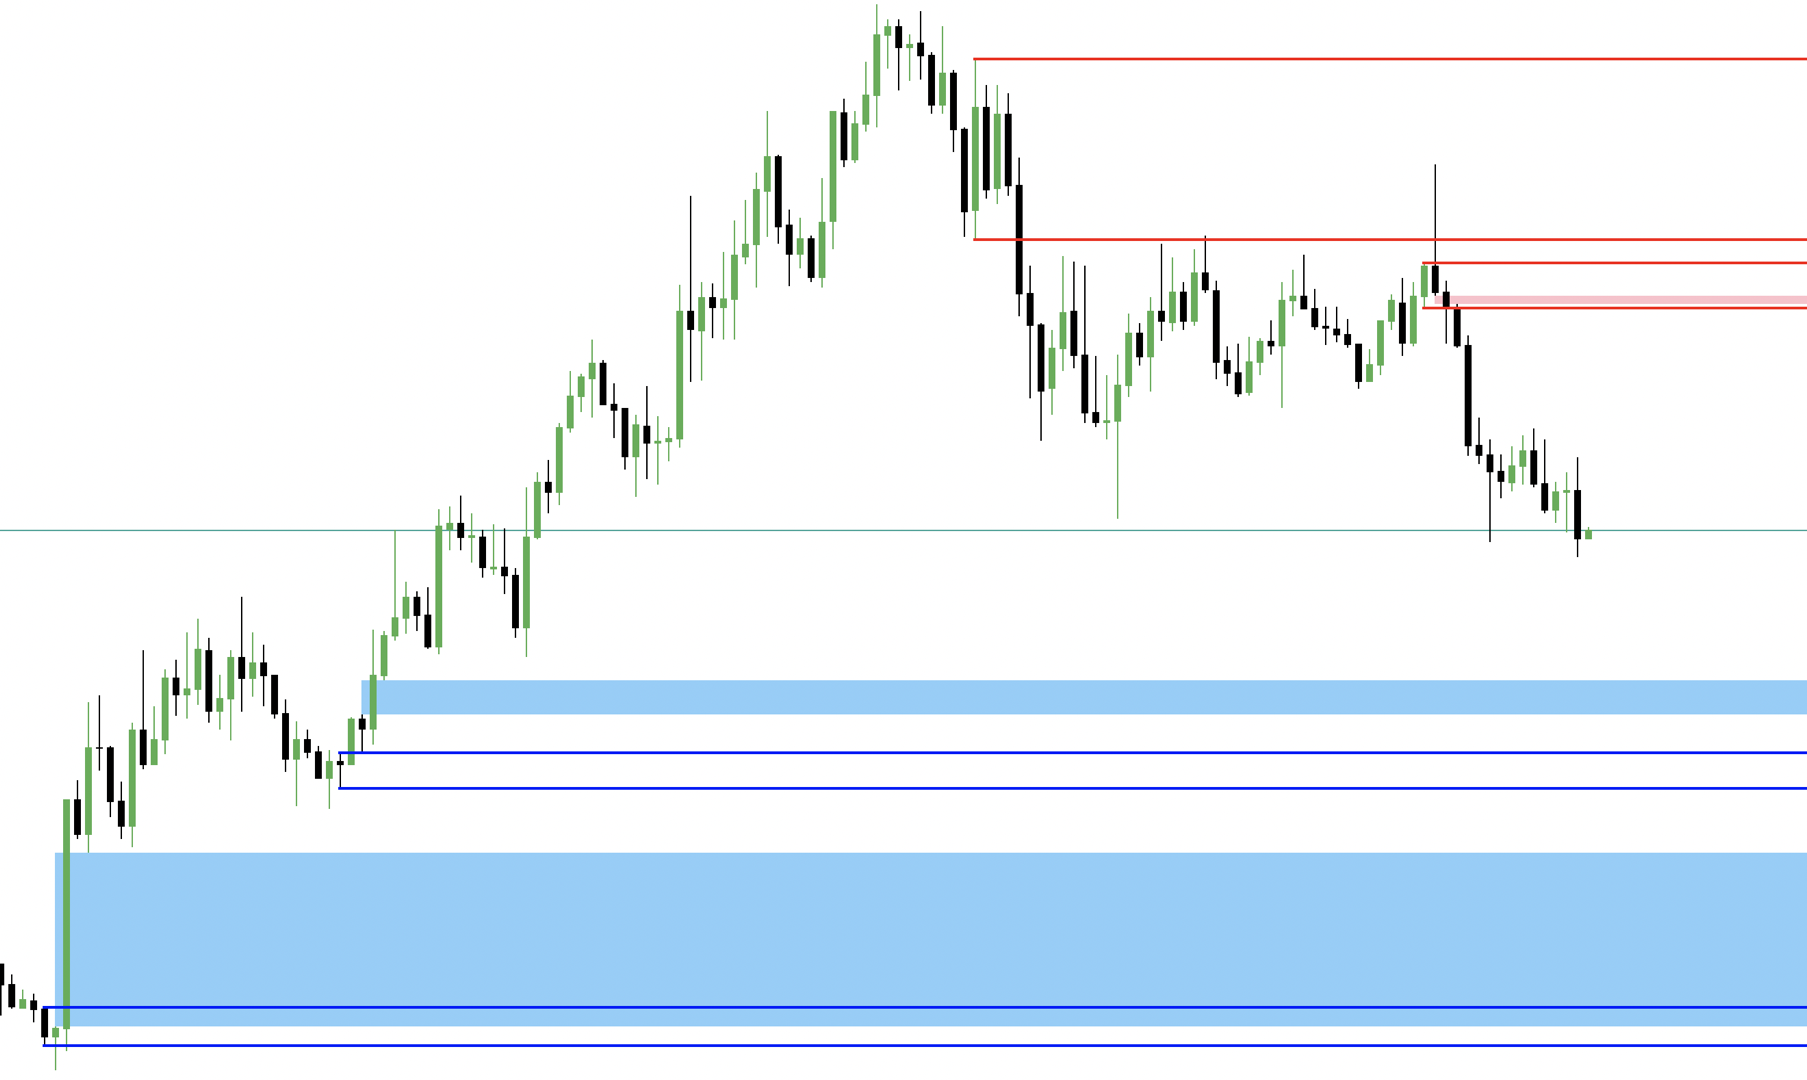
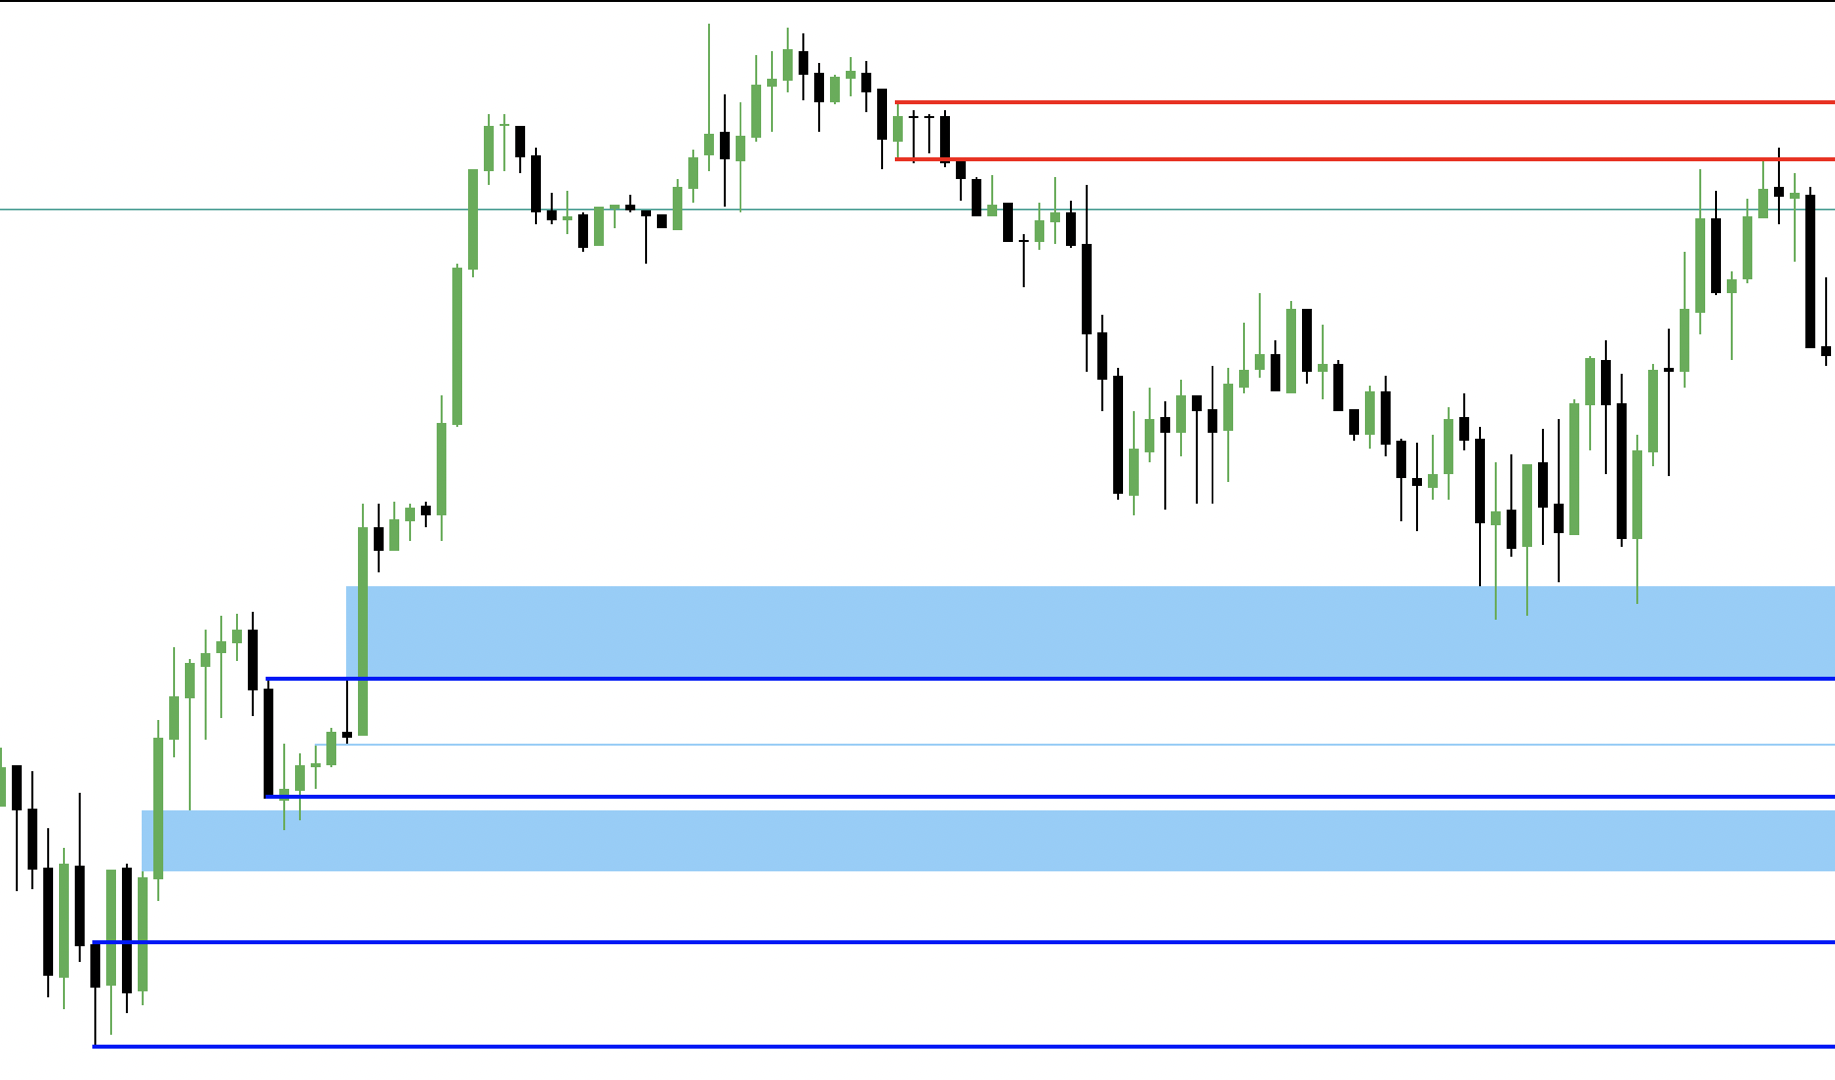
The indicator utilizes an algorithm to automatically draw and identify Order Blocks (OB), Fair Value Gaps (FVGs), and Implied Fair Value Gaps (IFVGs), along with providing updates on alerts when necessary.
So, when you combine FVG, IFVG, OB in the same screen, you will observe the most visually distinct support/resistance zones.
Meanwhile, you can use this as a basis to set the most accurate entry points, stoploss, and target prices.
The combination of these three elements assists traders in seeking entry points, setting stop-loss levels, and taking profit according to the SmartMoneyConcept or Michael's Inner Circle Trader (ICT) trading strategy.
------------------
You must be proficient in the ICT or SmartMoneyConcept (SMC) trading strategies to use this indicator.
Thanks!
L'utente non ha lasciato alcun commento sulla valutazione.