
Price velocity measurement methods

Contents
Introduction
There are multiple different approaches to market research and analysis. The main ones are technical and fundamental. In technical analysis, traders collect, process and analyze numerical data and parameters related to the market, including prices, volumes, etc. In fundamental analysis, traders analyze events and news affecting the markets directly or indirectly. When analyzing fundamental data, the main issue is interpretation of an event regarding its impact on the market. Such an interpretation may be influenced by trader's opinions and expectations. On the contrary, technical data usually gives no rise to various interpretations. However, the human factor is present in evaluating technical analysis results as well.
Perception issue
Speaking about technical analysis of markets, we mean the use of any evaluation systems from various scientific fields, be it math or physics. The necessity of math in technical analysis is pretty clear, while applying various physical phenomena to markets is more interesting. Therefore, in this article, we will consider such a well-known physical phenomenon as velocity which is a measure of movement per unit of time. When we look at Forex and other charts, we can clearly see not only the current price direction but also its velocity, especially during high volatility periods. Anyone is able to visually analyze the chart and determine whether the current price changes are quick or slow. However, such visual estimations remain highly subjective due to the difference in people's perceptions.
A simple example from real life is a visual trick, in which a small vehicle seemingly moves at a slower speed, while a large truck seems to move at a greater speed. This issue is solved by speed meters showing everything in numbers, which are absolutely the same for any person.
Price velocity measurement methods
Before considering various approaches to measuring the price velocity, let's recall what velocity actually is.
According to Wikipedia:
The velocity of an object is the rate of change of its position with respect to a frame of reference, and is a function of time... Velocity is a physical vector quantity; both magnitude and direction are needed to define it.
How can we apply this definition to Forex? The simplest way is to replace an object with a price and set the time, within which a bar or a candle is formed, as a frame of reference. From the price chart perspective, this looks as follows:
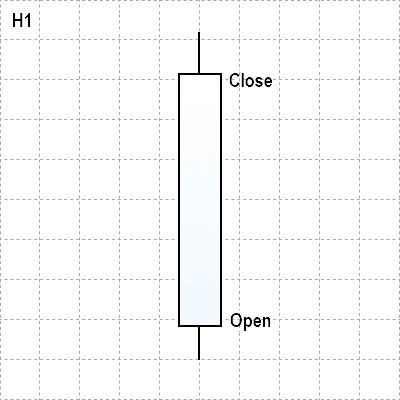
Fig. 1. Displaying a price as a Japanese candlestick on H1 timeframe
In this case, a simple velocity measurement looks as shown below:
Average velocity = (Close price — Open price) / Hour
The exact observations and conclusions regarding price movement over time are as follows:
- We defined the average number of points the price passes per hour. However, the measurement takes place within the framework of only one candle, and we cannot get the overall trend picture on this timeframe.
- However, if we convert the velocity from points per hour into points per minute, 5 minutes, etc, we obtain more valuable data on price movement inside this H1 hour.
- Therefore, the following two conclusions are obvious: determining the velocity on lower timeframes is more convenient to do on higher ones. When measuring the average velocity on the current timeframe by measuring the price movement, we should use several candles.
For clarity, let me provide an example perfectly illustrating the above conclusions. Fig. 2 shows the H1 candle with its average velocity per minute calculated using the Average Speed indicator. Here it is equal to 2.53 points per minute.
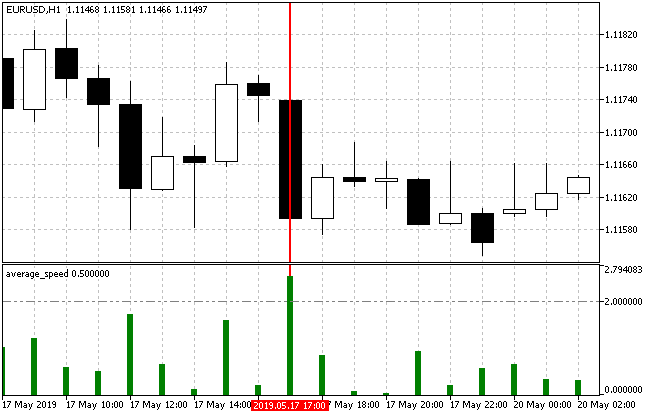
Fig. 2. Calculating the average velocity on EURUSD H1
Now let's have a look at the same candle on M15.
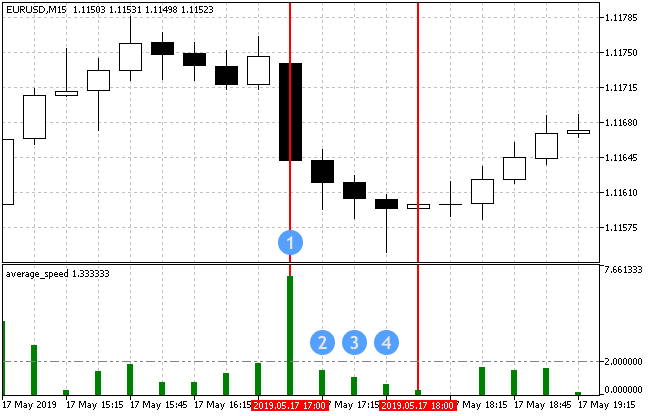
Fig. 3. Calculating the average velocity on EURUSD H15
Fig. 3 shows that the movement was very strong in the first 15 minutes of the selected hour (Average speed was 6.93) slowing down significantly afterwards. Of course, if we sum up all four values of the average velocity, we get the same 2.53 points per minute. Thus, breaking a candle down into components allows us to uncover much data on its dynamics.
Breaking an H1 candle into M1 intervals yields even more data.
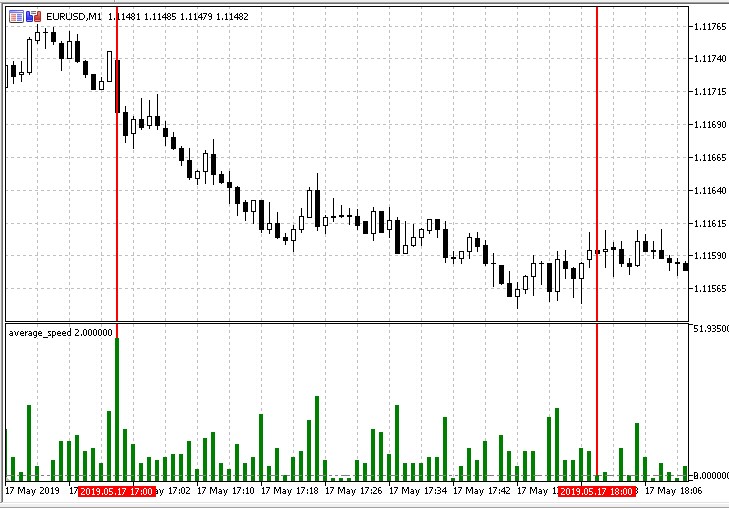
Fig. 4. Calculating the average velocity on EURUSD M1
There is yet another method of measurement when considering options for calculating the movement velocity in points for M1 timeframe.
It involves the instantaneous (current) price velocity. On the one hand, its values are always as relevant as possible. On the other hand, a sample indicator that works with tick price changes looks like this:
Fig. 5. Instantaneous price velocity indicator
Apparently, evaluation of such a chaotic (although relevant) data for its subsequent use in Forex trading is quite a challenging task.
As we know, the overwhelming majority of indicators are derivatives of the price or its analyzers. These are some well-known indicators working with the price velocity:
- Momentum measures the amount of price change over a certain period of time. Extremely high or low Momentum values suggest the continuation of the current trend. This means that large deviations from the indicator represent the current high price velocity in a given direction.
- ADX trend indicator. Average Directional Movement Index shows the strength of the current trend. In fact, it displays the current average velocity.
Developing trading strategies based on measurement methods
Therefore, the objectives of testing various price velocity measurements are to be divided into three main groups:
- Direct standard measurement of an average velocity as a ratio of points passed per unit of time.
- Measuring velocity using ticks as a ratio of the number of points passed to the number of ticks.
- Indirect velocity measurement using trend-following and other indicators.
Trading strategy 1
To test the first method based on measuring velocity as a number of passed points per unit of time using Average Speed indicator, the filter showing a trend direction should be added to the tested strategy since the indicator displays the number of points per unit of time regardless of the trend direction.
I decided to use Coordinated ADX and MACD (CAM) indicator as such a filter. The trading strategy will look like this:
| Parameter | Description |
|---|---|
| Applied indicator | Average Speed |
| Applied indicator | Coordinated ADX and MACD (CAM) |
| Timeframe | Any |
| Buy conditions | A candle is colored green, while the Average Speed value is above the threshold (pre-set in the parameters) |
| Sell conditions | A candle is colored red, while the Average Speed value is above the threshold (pre-set in the parameters) |
| Exit conditions | Take Profit/Stop Loss |
Fig. 6 visualizes opening long and short:
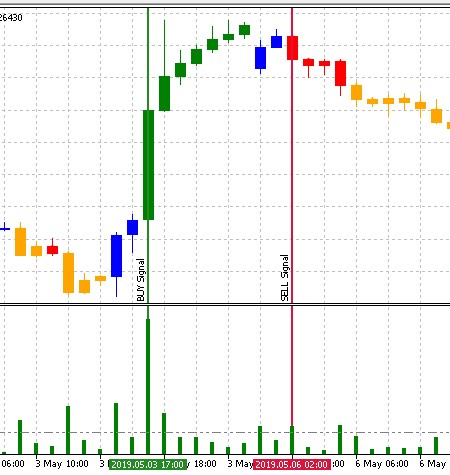
Fig. 6. The trading strategy's entry conditions
The strategy is implemented the following way:
//+------------------------------------------------------------------+
//| EA inputs                                                        |
//+------------------------------------------------------------------+
input string               InpEaComment         =  "Strategy #1"; // EA Comment
input int                  InpMagicNum          =  1111;          // Magic number
input double               InpLot               =  0.1;           // Lots
input uint                 InpStopLoss          =  400;           // StopLoss in points
input uint                 InpTakeProfit        =  500;           // TakeProfit in points
input uint                 InpSlippage          =  0;             // Slippage in points
input ENUM_TIMEFRAMES      InpInd_Timeframe     =  PERIOD_H1;     // Timeframe for the calculation
//--- Average Speed indicator parameters
input int                  InpBars              =  1;             // Days
input ENUM_APPLIED_PRICE   InpPrice             =  PRICE_CLOSE;   // Applied price
input double               InpTrendLev          =  2;             // Trend Level
//--- CAM indicator parameters
input uint                 InpPeriodADX         =  10;            // ADX period
input uint                 InpPeriodFast        =  12;            // MACD Fast EMA period
input uint                 InpPeriodSlow        =  26;            // MACD Slow EMA period
//---
CEngine        engine;
CTrade         trade;
//--- Declare the indicator variables and handles
double         lot;
ulong          magic_number;
uint           stoploss;
uint           takeprofit;
uint           slippage;
int            InpInd_Handle1,InpInd_Handle2;
double         avr_speed[],cam_up[],cam_dn[];
//+------------------------------------------------------------------+
//| Expert initialization function                                   |
//+------------------------------------------------------------------+
int OnInit()
  {
//--- Initial checks
   if(!TerminalInfoInteger(TERMINAL_TRADE_ALLOWED))
     {
      Print(InpEaComment,": Trade is not allowed!");
      return(INIT_FAILED);
     }
   if(!TerminalInfoInteger(TERMINAL_CONNECTED))
     {
      Print(InpEaComment,": No Connection!");
      return(INIT_FAILED);
     }
//--- Get the Average Speed indicator handle
   InpInd_Handle1=iCustom(Symbol(),InpInd_Timeframe,"Speed Price\\average_speed",
                          InpBars,
                          InpPrice
                          );
   if(InpInd_Handle1==INVALID_HANDLE)
     {
      Print(InpEaComment,": Failed to get average_speed handle");
      Print("Handle = ",InpInd_Handle1,"  error = ",GetLastError());
      return(INIT_FAILED);
     }
//--- Get the CAM indicator handle
   InpInd_Handle2=iCustom(Symbol(),InpInd_Timeframe,"Speed Price\\CAM",
                          InpPeriodADX,
                          InpPeriodFast,
                          InpPeriodSlow
                          );
   if(InpInd_Handle2==INVALID_HANDLE)
     {
      Print(InpEaComment,": Failed to get average_speed handle");
      Print("Handle = ",InpInd_Handle2,"  error = ",GetLastError());
      return(INIT_FAILED);
     }
//---
   ArrayInitialize(avr_speed,0.0);
   ArrayInitialize(cam_up,0.0);
   ArrayInitialize(cam_dn,0.0);
   ArraySetAsSeries(avr_speed,true);
   ArraySetAsSeries(cam_up,true);
   ArraySetAsSeries(cam_dn,true);
//--- setting trade parameters
   lot=NormalizeLot(Symbol(),fmax(InpLot,MinimumLots(Symbol())));
   magic_number=InpMagicNum;
   stoploss=InpStopLoss;
   takeprofit=InpTakeProfit;
   slippage=InpSlippage;
//---
   trade.SetDeviationInPoints(slippage);
   trade.SetExpertMagicNumber(magic_number);
   trade.SetTypeFillingBySymbol(Symbol());
   trade.SetMarginMode();
   trade.LogLevel(LOG_LEVEL_NO);
//---
   return(INIT_SUCCEEDED);
  }
//+------------------------------------------------------------------+
//| Timer function                                                   |
//+------------------------------------------------------------------+
void OnTimer()
  {
   if(!MQLInfoInteger(MQL_TESTER))
      engine.OnTimer();
  }
//+------------------------------------------------------------------+
//| Expert tick function                                             |
//+------------------------------------------------------------------+
void OnTick()
  {
//--- If working in the tester
   if(MQLInfoInteger(MQL_TESTER))
      engine.OnTimer();

   if(!IsOpenedByMagic(InpMagicNum))
     {
      //--- Get data for calculation
      if(!GetIndValue())
         return;
      //---
      if(BuySignal())
        {
         //--- Get correct StopLoss and TakeProfit prices relative to StopLevel
         double sl=CorrectStopLoss(Symbol(),ORDER_TYPE_BUY,0,stoploss);
         double tp=CorrectTakeProfit(Symbol(),ORDER_TYPE_BUY,0,takeprofit);
         //--- Open Buy position
         trade.Buy(lot,Symbol(),0,sl,tp);
        }
      else if(SellSignal())
        {
         //--- Get correct StopLoss and TakeProfit prices relative to StopLevel
         double sl=CorrectStopLoss(Symbol(),ORDER_TYPE_SELL,0,stoploss);
         double tp=CorrectTakeProfit(Symbol(),ORDER_TYPE_SELL,0,takeprofit);
         //--- Open Sell position
         trade.Sell(lot,Symbol(),0,sl,tp);
        }
     }
  }
//+------------------------------------------------------------------+
//|                                                                  |
//+------------------------------------------------------------------+
bool BuySignal()
  {
   return(avr_speed[0]>=InpTrendLev && cam_up[0]!=EMPTY_VALUE)?true:false;
  }
//+------------------------------------------------------------------+
bool SellSignal()
  {
   return(avr_speed[0]>=InpTrendLev && cam_dn[0]!=EMPTY_VALUE)?true:false;
  }
//+------------------------------------------------------------------+
//| Get the current indicator values                                 |
//+------------------------------------------------------------------+
bool GetIndValue()
  {
   return(CopyBuffer(InpInd_Handle2,0,0,1,cam_up)<1 ||
          CopyBuffer(InpInd_Handle2,1,0,1,cam_dn)<1 ||
          CopyBuffer(InpInd_Handle1,0,0,1,avr_speed)<1
          )?false:true;
  }
//+------------------------------------------------------------------+
//| Check for open positions with a magic number                     |
//+------------------------------------------------------------------+
bool IsOpenedByMagic(int MagicNumber)
  {
   int pos=0;
   uint total=PositionsTotal();
//---
   for(uint i=0; i<total; i++)
     {
      if(SelectByIndex(i))
         if(PositionGetInteger(POSITION_MAGIC)==MagicNumber)
            pos++;
     }
   return((pos>0)?true:false);
  }
//+------------------------------------------------------------------+
//| Select a position on the index                                   |
//+------------------------------------------------------------------+
bool SelectByIndex(const int index)
  {
   ENUM_ACCOUNT_MARGIN_MODE margin_mode=(ENUM_ACCOUNT_MARGIN_MODE)AccountInfoInteger(ACCOUNT_MARGIN_MODE);
//---
   if(margin_mode==ACCOUNT_MARGIN_MODE_RETAIL_HEDGING)
     {
      ulong ticket=PositionGetTicket(index);
      if(ticket==0)
         return(false);
     }
   else
     {
      string name=PositionGetSymbol(index);
      if(name=="")
         return(false);
     }
//---
   return(true);
  }
//+------------------------------------------------------------------+
Trading strategy 2
The idea of the Price Impulse EA is used to implement a trading strategy based on the second way of measuring price velocity. Its main point is opening trading positions when the price moves for a certain number of points considering the number of ticks spent for that.
| Parameter | Description |
|---|---|
| Timeframe | Any |
| Buy conditions | Number of price points passed for a certain number of ticks. |
| Sell conditions | Number of price points passed for a certain number of ticks. |
| Exit conditions | Take Profit/Stop Loss |
Implementation of the strategy is provided in the listing below. As we can see, the settings have two parameters responsible for price velocity estimation:
//+------------------------------------------------------------------+
//| EA inputs                                                        |
//+------------------------------------------------------------------+
input string               InpEaComment         =  "Strategy #2"; // EA Comment
input int                  InpMagicNum          =  1111;          // Magic number
input double               InpLots              =  0.1;           // Lots
input uint                 InpStopLoss          =  400;           // StopLoss in points
input uint                 InpTakeProfit        =  500;           // TakeProfit in points
input ENUM_COPY_TICKS      tick_flags           =  TICKS_INFO;    // Ticks resulting from Bid and/or Ask changes
input int                  InpPoints            =  15;            // The price should move NNN points
input uchar                InpTicks             =  15;            // For XXX ticks

//--- arrays for accepting ticks
MqlTick        tick_array_curr[];            // ticks array obtained on the current tick
MqlTick        tick_array_prev[];            // ticks array obtained on the previous tick
ulong          tick_from=0;                  // if tick_from=0, the last tick_count ticks are given
uint           tick_count=15;                // number of ticks that should be obtained
//---
double         ExtStopLoss=0.0;
double         ExtTakeProfit=0.0;
double         ExtPoints=0.0;
bool           first_start=false;
long           last_trade_time=0;
//+------------------------------------------------------------------+
//| Expert initialization function                                   |
//+------------------------------------------------------------------+
int OnInit()
  {
   if(!m_symbol.Name(Symbol()))              // sets symbol name
      return(INIT_FAILED);

   tick_count+=InpTicks;                     // request "tick_count" + "for XXX ticks"
   ExtStopLoss=InpStopLoss*Point();
   ExtTakeProfit=InpTakeProfit*Point();
   ExtPoints=InpPoints*Point();
   first_start=false;
//--- request ticks (first filling)
   int copied=CopyTicks(Symbol(),tick_array_curr,tick_flags,tick_from,tick_count);
   if(copied!=tick_count)
      first_start=false;
   else
     {
      first_start=true;
      ArrayCopy(tick_array_prev,tick_array_curr);
     }
   m_trade.SetExpertMagicNumber(InpMagicNum);
   m_trade.SetTypeFillingBySymbol(Symbol());
   m_trade.SetMarginMode();
   m_trade.LogLevel(LOG_LEVEL_NO);
//---
   return(INIT_SUCCEEDED);
  }
//+------------------------------------------------------------------+
//| Expert tick function                                             |
//+------------------------------------------------------------------+
void OnTick()
  {
//--- check for the first start
   int copied=-1;
   if(!first_start)
     {
      copied=CopyTicks(Symbol(),tick_array_curr,tick_flags,tick_from,tick_count);
      if(copied!=tick_count)
         first_start=false;
      else
        {
         first_start=true;
         ArrayCopy(tick_array_prev,tick_array_curr);
        }
     }
//--- request ticks
   copied=CopyTicks(Symbol(),tick_array_curr,tick_flags,tick_from,tick_count);
   if(copied!=tick_count)
      return;
   int index_new=-1;
   long last_time_msc=tick_array_prev[tick_count-1].time_msc;
   for(int i=(int)tick_count-1;i>=0;i--)
     {
      if(last_time_msc==tick_array_curr[i].time_msc)
        {
         index_new=i;
         break;
        }
     }
//---
   if(index_new!=-1 && !IsOpenedByMagic(InpMagicNum))
     {
      int shift=(int)tick_count-1-index_new-InpTicks;   // shift in the current ticks array
      shift=(shift<0)?0:shift;
      if(tick_array_curr[tick_count-1].ask-tick_array_curr[shift].ask>ExtPoints)
        {
         //--- open BUY
         double sl=(InpStopLoss==0)?0.0:tick_array_curr[tick_count-1].ask-ExtStopLoss;
         double tp=(InpTakeProfit==0)?0.0:tick_array_curr[tick_count-1].ask+ExtTakeProfit;
         m_trade.Buy(InpLots,m_symbol.Name(),tick_array_curr[tick_count-1].ask,
                     m_symbol.NormalizePrice(sl),
                     m_symbol.NormalizePrice(tp));
         last_trade_time=tick_array_curr[tick_count-1].time_msc;
        }
      else if(tick_array_curr[shift].bid-tick_array_curr[tick_count-1].bid>ExtPoints)
        {
         //--- open SELL
         double sl=(InpStopLoss==0)?0.0:tick_array_curr[tick_count-1].bid-ExtStopLoss;
         double tp=(InpTakeProfit==0)?0.0:tick_array_curr[tick_count-1].bid+ExtTakeProfit;
         m_trade.Sell(InpLots,m_symbol.Name(),tick_array_curr[tick_count-1].bid,
                      m_symbol.NormalizePrice(sl),
                      m_symbol.NormalizePrice(tp));
         last_trade_time=tick_array_curr[tick_count-1].time_msc;
        }
     }
   ArrayCopy(tick_array_prev,tick_array_curr);
//---
  }
//+------------------------------------------------------------------+
//| Check for open positions with the magic number                   |
//+------------------------------------------------------------------+
bool IsOpenedByMagic(int MagicNumber)
  {
   int pos=0;
   uint total=PositionsTotal();
//---
   for(uint i=0; i<total; i++)
     {
      if(SelectByIndex(i))
         if(PositionGetInteger(POSITION_MAGIC)==MagicNumber)
            pos++;
     }
   return((pos>0)?true:false);
  }
//+------------------------------------------------------------------+
//| Select a position on the index                                   |
//+------------------------------------------------------------------+
bool SelectByIndex(const int index)
  {
   ENUM_ACCOUNT_MARGIN_MODE margin_mode=(ENUM_ACCOUNT_MARGIN_MODE)AccountInfoInteger(ACCOUNT_MARGIN_MODE);
//---
   if(margin_mode==ACCOUNT_MARGIN_MODE_RETAIL_HEDGING)
     {
      ulong ticket=PositionGetTicket(index);
      if(ticket==0)
         return(false);
     }
   else
     {
      string name=PositionGetSymbol(index);
      if(name=="")
         return(false);
     }
//---
   return(true);
  }
//+------------------------------------------------------------------+
Trading strategy 3
To create a trading strategy that indirectly measures the price velocity, we should select a trend indicator and a filter that confirms its possible signals. Considering the objectives, I selected Trend direction and force for a trend indicator and HMA Color as a filter. Fig. 7 displays buy and sell entry signals.
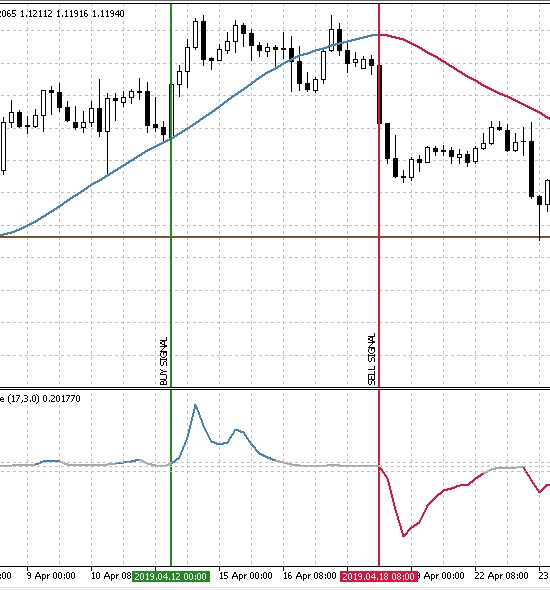
Fig. 7. The trading strategy's entry conditions
| Parameter | Description |
|---|---|
| Applied indicator | Trend direction and force |
| Applied indicator | HMA Color |
| Timeframe | M30 and higher |
| Buy conditions | 'Trend direction and fast' value is higher than the threshold one (the line is blue), while HMA moves upwards and turns blue. |
| Sell conditions | 'Trend direction and fast' value is lower than the threshold one (the line is red), while HMA moves downwards and turns red. |
| Exit conditions | Take Profit/Stop Loss |
Testing price velocity measurement methods
To test the selected three strategies, we need to define the conditions they are to be tested in.
- Interval: Last year. (At the time of this writing, this is 01.01.2019 — 26.05.2019)
- Symbol: EURUSD.
- Trading mode: No delay (These are not high-frequency trading strategies, so the effect of delays would be very small).
- Testing: М1 OHLC (Pre-testing on real ticks shows nearly the same results).
- Initial deposit: 1000 USD.
- Leverage: 1:500.
- Server: MetaQuotes-Demo.
- Quotes: 5-digit.
Rather than fitting the strategy on history, the objective of the test is to clarify the overall trend and efficiency of various approaches to calculating and handling the price velocity. Therefore, the best optimization results and their estimation using the report parameters will be provided for each of the trading strategies.
Trading strategy 1.
After testing the first strategy based on standard price velocity change, I have received certain results. The top 20 of them are provided below:
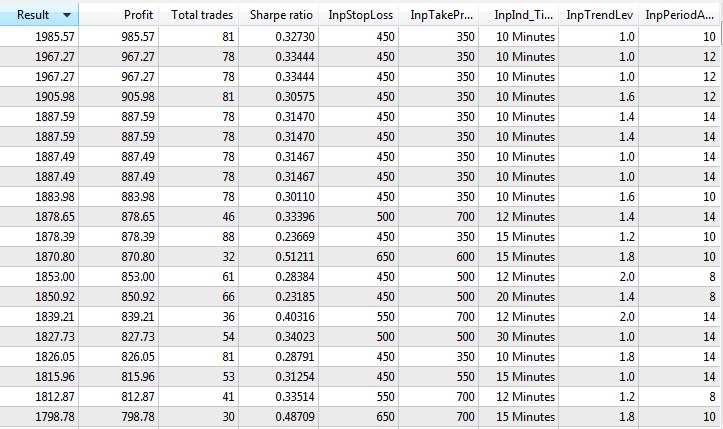
Fig. 8. Trading strategy 1 twenty best optimization results
From these results, we can conclude that under these test conditions, the trading strategy shows the best results on low timeframes with small take profit and stop loss values. In other words, the movement potential of a detected signal is small. At the same time, the Sharpe ratio (find more about it and other parameters in the article Mathematics in Trading. How to estimate trade results) is low, which is not a promising sign. Next, I launched the best result in the tester and received the following report.
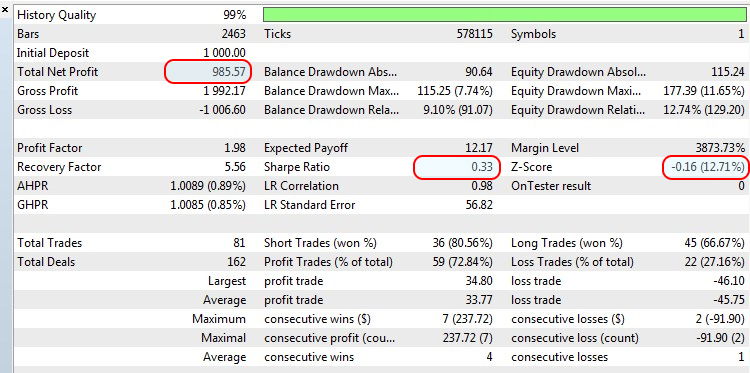
Fig. 9. The outcome of testing the trading strategy 1 best optimization result
When using a constant lot of 0.1, we can see the growth is almost 100%, however the Sharpe ratio is only 0.33, while Z-Score is -0.16, which indicates the lack of consistency in trading and the influence of the random factor.
Trading strategy 2.
To test the following strategy, we need to change one test condition due to the strategy features:
- Testing: replace M1 OHLC (pre-testing on real ticks shows nearly the same results) with "Every ticks based on real ticks".
The top 20 optimization options for the strategy look as follows:
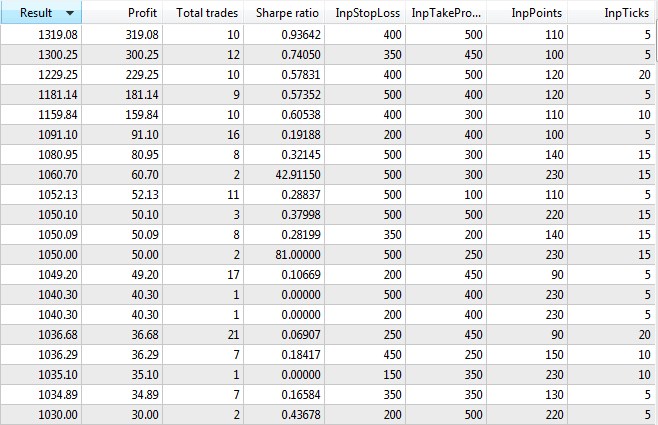
Fig.10. Trading strategy 2 twenty best optimization results
On average, the Sharpe ratio is higher here as compared to the first strategy, and the best results are obtained with a moderate number of points within the minimum number of ticks. The system also turned out to be quite selective as indicated by a very small number of trades. Let's test the best optimization result and see the report.
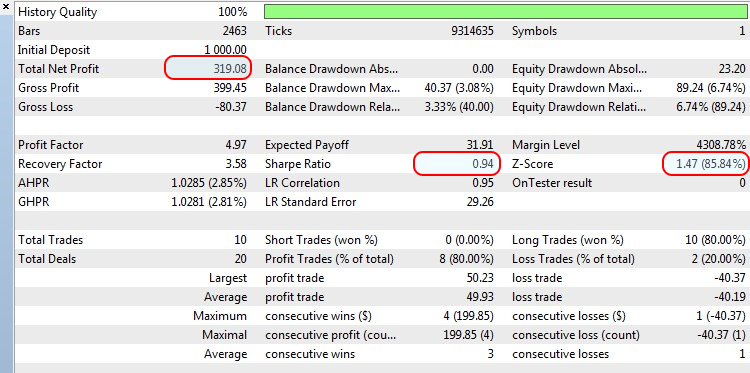
Fig. 11. The outcome of testing the trading strategy 2 best optimization result
The Sharpe ratio looks better here, since the profit exceeding 30% was reached only within 10 trades.
Trading strategy 3.
In this strategy, we get back to the initial testing conditions. Here we will check trading using indicators that indirectly determine the price movement and its speed.
Also see the best options for optimizing the current strategy:
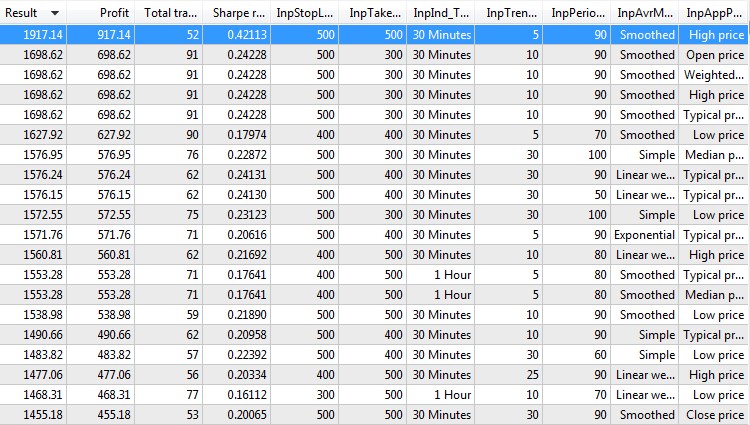
Fig. 12. Trading strategy 3 twenty best optimization results
Most of the results are very similar. This suggests that the last two optimization parameters do not exert much impact on the final result. At the same time, the average Sharpe ratio is about 0.2, which is not too impressive. The best optimization result is out of the general order, of course, but we are going to conduct backtest on it like in previous trading strategies.
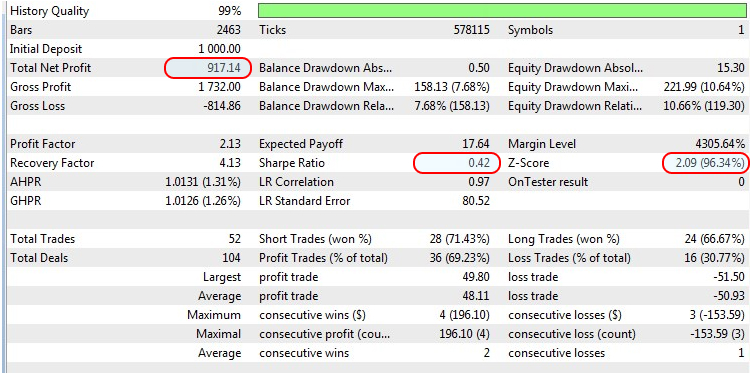
Fig.13. The outcome of testing the trading strategy 3 best optimization result
Despite the almost 100% growth of the deposit and the outstanding Sharpe ratio (which is notable by the fact that it took 52 trades to reach the current profit level, while the nearest results are almost two times less), Z-Score shows a negative correlation between trades. This means a profitable trade will most likely be followed by a loss-making one and vice versa.
Summary
After testing the three approaches to measuring the price velocity and examining the results of the best backtests and other optimizations, it was revealed that the best optimization result of the first method lacks consistency. The remaining two methods showed better results with the higher Sharpe ratio and the negative correlation between trades. Of course, the test strategies do not cover the whole variety of price velocity measuring methods, but this article has described some of the most obvious and easiest to understand trading methods.
Conclusion
The archive attached below contains all described files arranged into appropriate folders. For a correct operation, you should save the MQL5 folder to the terminal's root directory. To open the terminal root directory, in which the MQL5 folder is located, press the Ctrl+Shift+D key combination in the MetaTrader 5 terminal or use the context menu as shown in Fig 14 below.
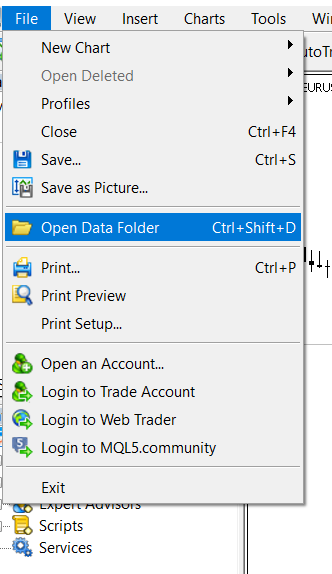
Fig. 14. Opening the MQL5 folder in the MetaTrader 5 terminal root
Programs used in the article:
| # | Name | Type | Description |
|---|---|---|---|
| 1 | Strategy_1.mq5 | EA | The EA based on the trading strategy 1 |
| 2 | Strategy_2.mq5 | EA | The EA based on the trading strategy 2 |
| 3 | Strategy_3.mq5 | EA | The EA based on the trading strategy 3 |
| 4 | Engine.mqh | Library | The library of trading functions |
| 5 | Average Speed | Indicator | Used in the trading strategy 1 |
| 6 | CAM | Indicator | Used in the trading strategy 1 |
| 7 | Trend direction and force | Indicator | Used in the trading strategy 3 |
| 8 | HMA_color | Indicator | Used in the trading strategy 3 |
Translated from Russian by MetaQuotes Ltd.
Original article: https://www.mql5.com/ru/articles/6947
Warning: All rights to these materials are reserved by MetaQuotes Ltd. Copying or reprinting of these materials in whole or in part is prohibited.
This article was written by a user of the site and reflects their personal views. MetaQuotes Ltd is not responsible for the accuracy of the information presented, nor for any consequences resulting from the use of the solutions, strategies or recommendations described.

 Grokking market "memory" through differentiation and entropy analysis
 Evaluating the ability of Fractal index and Hurst exponent to predict financial time series
- Free trading apps
- Over 8,000 signals for copying
- Economic news for exploring financial markets
You agree to website policy and terms of use
"Respect and Respect =)
I just finished a bot that uses almost the same strategy in its trading!
Very useful article for people who want to earn and not "drain" on the Forex market!
Thank you.
Very useful article for people who want to earn money, ..... on the Forex market!
Is it possible?