
How to quickly develop and debug a trading strategy in MetaTrader 5

"No one can be trusted, but me" (с) Debugger
Scalping automatic systems are rightfully regarded the pinnacle of algorithmic trading, but at the same time their code is the most difficult to write. In this article we will show how to build strategies based on analysis of incoming ticks using the built-in debugging tools and visual testing. Developing rules for entry and exit often require years of manual trading. But with the help of MetaTrader 5, you can quickly test any such strategy on real history.
Idea of trading on ticks
First of all, it is necessary to create an indicator that will plot tick charts, i.e. charts where every change in price can be seen. One of the first of these indicators can be found in the CodeBase — https://www.mql5.com/en/code/89. Unlike the conventional ones, it is necessary to shift the entire tick charts backwards when new ticks arrive.
The tested idea will be based on the series of price changes between two consecutive ticks. The approximate sequence in points will be the following:
+1, 0, +2, -1, 0, +1, -2, -1, +1, -5, -1, +1, 0, -1, +1, 0, +2, -1, +1, +6, -1, +1,...
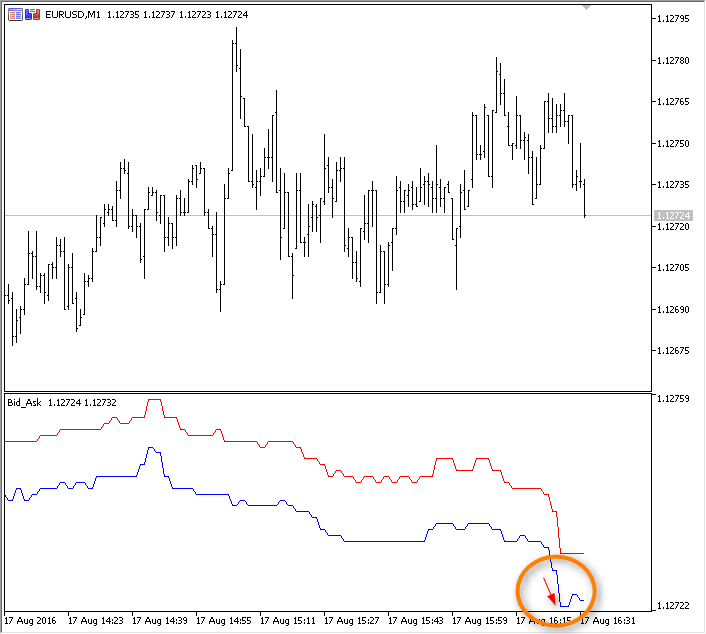
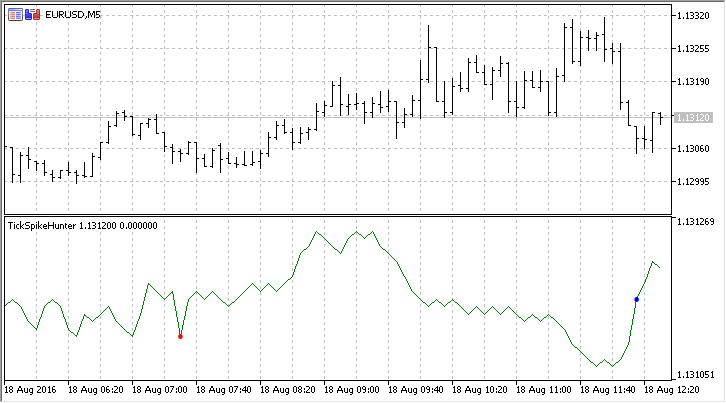
The law of normal distribution states that 99% of changes in price between two ticks lie within 3 sigmas. We will attempt to calculate the standard deviation on every tick in real time and mark the price spikes with red and blue icons. Thus, it will be possible to visually select a strategy to take advantage of such sharp emissions — trade in the direction of the change or use the "mean reversion". As you can see, the idea is very simple, and most mathematics lovers certainly had gone down that path.
Creating a tick indicator
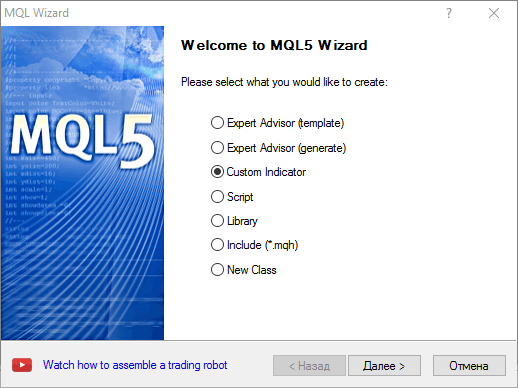
Run the MQL Wizard in the MetaEditor, set the name and two input parameters:
- ticks — the number of ticks to be used in calculation of the standard deviation
- gap — the coefficient to get the interval in sigmas.
Next, tick the "Indicator in a separate window" and specify 2 graphic plots, which will display the information in the subwindow: a line for ticks and color arrows for signals about the appearance of price spikes.
Make the changes marked in yellow to the resulting draft
//+------------------------------------------------------------------+
//|                                              TickSpikeHunter.mq5 |
//|                        Copyright 2016, MetaQuotes Software Corp. |
//|                                             https://www.mql5.com |
//+------------------------------------------------------------------+
#property copyright "Copyright 2016, MetaQuotes Software Corp."
#property link      "https://www.mql5.com"
#property version   "1.00"
#property indicator_separate_window
#property indicator_buffers 3
#property indicator_plots   2
//--- plot TickPrice
#property indicator_label1  "TickPrice"
#property indicator_type1   DRAW_LINE
#property indicator_color1  clrGreen
#property indicator_style1  STYLE_SOLID
#property indicator_width1  1
//--- plot Signal
#property indicator_label2  "Signal"
#property indicator_type2   DRAW_COLOR_ARROW
#property indicator_color2  clrRed,clrBlue,C'0,0,0',C'0,0,0',C'0,0,0',C'0,0,0',C'0,0,0',C'0,0,0'
#property indicator_style2  STYLE_SOLID
#property indicator_width2  1
//--- input parameters
input int      ticks=50;         // the number of ticks in the calculations
input double   gap=3.0;          // width of the channel in sigmas
//--- indicator buffers
double         TickPriceBuffer[];
double         SignalBuffer[];
double         SignalColors[];
//--- counter of price changes
int ticks_counter;
//--- the first indicator call
bool first;
//+------------------------------------------------------------------+
//| Custom indicator initialization function                         |
//+------------------------------------------------------------------+
int OnInit()
  {
//--- indicator buffers mapping
   SetIndexBuffer(0,TickPriceBuffer,INDICATOR_DATA);
   SetIndexBuffer(1,SignalBuffer,INDICATOR_DATA);
   SetIndexBuffer(2,SignalColors,INDICATOR_COLOR_INDEX);
//--- set empty values, which should be ignored when plotting
   PlotIndexSetDouble(0,PLOT_EMPTY_VALUE,0);
   PlotIndexSetDouble(1,PLOT_EMPTY_VALUE,0);
//--- the signals will output as this icon
   PlotIndexSetInteger(1,PLOT_ARROW,159);
//--- initialization of global variables
   ticks_counter=0;
   first=true;
//--- program initialization succeeded
   return(INIT_SUCCEEDED);
  }
//+------------------------------------------------------------------+
//| Custom indicator iteration function                              |
//+------------------------------------------------------------------+
int OnCalculate(const int rates_total,
                const int prev_calculated,
                const datetime &time[],
                const double &open[],
                const double &high[],
                const double &low[],
                const double &close[],
                const long &tick_volume[],
                const long &volume[],
                const int &spread[])
  {
//---

//--- return value of prev_calculated for next call
   return(rates_total);
  }
//+------------------------------------------------------------------+
Now, it is left to add the code to the OnCalculate() predefined handler of incoming ticks. Explicitly zero the values in the indicator buffers during the first call of the function, and also, for convenience, flag them as series — thus, they will be indexed from right to left. This will allow to call the most recent value of the indicator buffer using the index zero, i.e. the value of the latest tick will be stored in TickPriceBuffer[0].
In addition, the main handling of ticks will be moved to a separate ApplyTick() function:
//+------------------------------------------------------------------+
//| Custom indicator iteration function                              |
//+------------------------------------------------------------------+
int OnCalculate(const int rates_total,
                const int prev_calculated,
                const datetime &time[],
                const double &open[],
                const double &high[],
                const double &low[],
                const double &close[],
                const long &tick_volume[],
                const long &volume[],
                const int &spread[])
  {
//--- zero the indicator buffers and set the series flag during the first call
   if(first)
     {
      ZeroMemory(TickPriceBuffer);
      ZeroMemory(SignalBuffer);
      ZeroMemory(SignalColors);
      //--- series arrays are directed backwards, it is more convenient in this case
      ArraySetAsSeries(SignalBuffer,true);
      ArraySetAsSeries(TickPriceBuffer,true);
      ArraySetAsSeries(SignalColors,true);
      first=false;
     }
//--- use the current Close value as the price
   double lastprice=close[rates_total-1];
//--- Count ticks
   ticks_counter++;
   ApplyTick(lastprice); // perform calculations and shift in the buffers
//--- return value of prev_calculated for next call
   return(rates_total);
  }
//+------------------------------------------------------------------+
//| applies tick for calculations                                    |
//+------------------------------------------------------------------+
void ApplyTick(double price)
  {
   int size=ArraySize(TickPriceBuffer);
   ArrayCopy(TickPriceBuffer,TickPriceBuffer,1,0,size-1);
   ArrayCopy(SignalBuffer,SignalBuffer,1,0,size-1);
   ArrayCopy(SignalColors,SignalColors,1,0,size-1);
//--- store the latest price value
   TickPriceBuffer[0]=price;
//---
  }
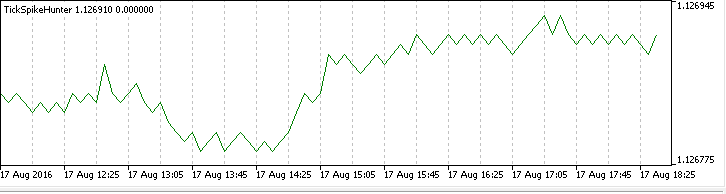
Currently, the ApplyTick() performs the simplest operations — shifts all buffer values by one position back in history and writes the latest tick to the TickPriceBuffer[0]. Run indicator in debugging mode and observe for some time.
As it can be seen, the Bid price used as the basis of the Close for the current candle is often left unchanged, and therefore the chart is drawn with "plateau" pieces. Slightly adjust the code, in order to get only the "saw" - it is more intuitive.
//--- calculate only if the price changed
   if(lastprice!=TickPriceBuffer[0])
     {
      ticks_counter++;      // count ticks
      ApplyTick(lastprice); // perform calculations and shift in the buffers
     }
So, the first version of the indicator has been created, now there are no zero increments of price.
Adding an auxiliary buffer and calculation of the standard deviation
An additional array is required to calculate the deviation. This array will store the price increments on every tick. As such an array, add another indicator buffer and corresponding code in the required places:
#property indicator_separate_window
#property indicator_buffers 4
#property indicator_plots   2
...
//--- indicator buffers
double         TickPriceBuffer[];
double         SignalBuffer[];
double         DeltaTickBuffer[];
double         ColorsBuffers[];
...
//+------------------------------------------------------------------+
//| Custom indicator initialization function                         |
//+------------------------------------------------------------------+
int OnInit()
  {
//--- indicator buffers mapping
   SetIndexBuffer(0,TickPriceBuffer,INDICATOR_DATA);
   SetIndexBuffer(1,SignalBuffer,INDICATOR_DATA);
   SetIndexBuffer(2,SignalColors,INDICATOR_COLOR_INDEX);
   SetIndexBuffer(3,DeltaTickBuffer,INDICATOR_CALCULATIONS);
...
  }
//+------------------------------------------------------------------+
//| Custom indicator iteration function                              |
//+------------------------------------------------------------------+
int OnCalculate(const ...)

//--- zero the indicator buffers and set the series flag during the first call
   if(first)
     {
      ZeroMemory(TickPriceBuffer);
      ZeroMemory(SignalBuffer);
      ZeroMemory(SignalColors);
      ZeroMemory(DeltaTickBuffer);
      //--- series arrays are directed backwards, it is more convenient in this case
      ArraySetAsSeries(TickPriceBuffer,true);
      ArraySetAsSeries(SignalBuffer,true);
      ArraySetAsSeries(SignalColors,true);
      ArraySetAsSeries(DeltaTickBuffer,true);
      first=false;
     }
...
   return(rates_total);
  }
//+------------------------------------------------------------------+
//| applies tick for calculations                                    |
//+------------------------------------------------------------------+
void ApplyTick(double price)
  {
   int size=ArraySize(TickPriceBuffer);
   ArrayCopy(TickPriceBuffer,TickPriceBuffer,1,0,size-1);
   ArrayCopy(SignalBuffer,SignalBuffer,1,0,size-1);
   ArrayCopy(SignalColors,SignalColors,1,0,size-1);
   ArrayCopy(DeltaTickBuffer,DeltaTickBuffer,1,0,size-1);
//--- store the latest price value
   TickPriceBuffer[0]=price;
//--- calculate the difference with the previous value
   DeltaTickBuffer[0]=TickPriceBuffer[0]-TickPriceBuffer[1];
//--- get the standard deviation
   double stddev=getStdDev(ticks);
Now everything is ready for the calculation of the standard deviation. First, write the getStdDev() function to perform all calculations with "brute force", iterating over all elements of the array using as many cycles as needed.
//+------------------------------------------------------------------+
//| calculates the standard deviation with "brute-force"             |
//+------------------------------------------------------------------+
double getStdDev(int number)
  {
   double summ=0,sum2=0,average,stddev;
//--- count the sum of changes and calculate the expected payoff
   for(int i=0;i<ticks;i++)
      summ+=DeltaTickBuffer[i];
   average=summ/ticks;
//--- now calculate the standard deviation
   sum2=0;
   for(int i=0;i<ticks;i++)
      sum2+=(DeltaTickBuffer[i]-average)*(DeltaTickBuffer[i]-average);
   stddev=MathSqrt(sum2/(number-1));
   return (stddev);
  }
After that, add the block responsible for placing signals on the tick chart — red and blue circles
//+------------------------------------------------------------------+
//| applies tick for calculations                                    |
//+------------------------------------------------------------------+
void ApplyTick(double price)
  {
   int size=ArraySize(TickPriceBuffer);
   ArrayCopy(TickPriceBuffer,TickPriceBuffer,1,0,size-1);
   ArrayCopy(SignalBuffer,SignalBuffer,1,0,size-1);
   ArrayCopy(SignalColors,SignalColors,1,0,size-1);
   ArrayCopy(DeltaTickBuffer,DeltaTickBuffer,1,0,size-1);
//--- store the latest price value
   TickPriceBuffer[0]=price;
//--- calculate the difference with the previous value
   DeltaTickBuffer[0]=TickPriceBuffer[0]-TickPriceBuffer[1];
//--- get the standard deviation
   double stddev=getStdDev(ticks);
//--- if the price change exceeded the specified threshold
   if(MathAbs(DeltaTickBuffer[0])>gap*stddev) // a signal will be displayed on the first tick, leave it as a "feature"
     {
      SignalBuffer[0]=price;     // place a dot
      string col="Red";          // the dot is red by default
      if(DeltaTickBuffer[0]>0)   // price rose sharply
        {
         SignalColors[0]=1;      // then the dot is blue
         col="Blue";             // store for logging
        }
      else                       // price fell sharply
      SignalColors[0]=0;         // the dot is red
      //--- output the message to the Experts journal
      PrintFormat("tick=%G change=%.1f pts, trigger=%.3f pts,  stddev=%.3f pts %s",
                  TickPriceBuffer[0],DeltaTickBuffer[0]/_Point,gap*stddev/_Point,stddev/_Point,col);
     }
   else SignalBuffer[0]=0;       // no signal
//---
  }
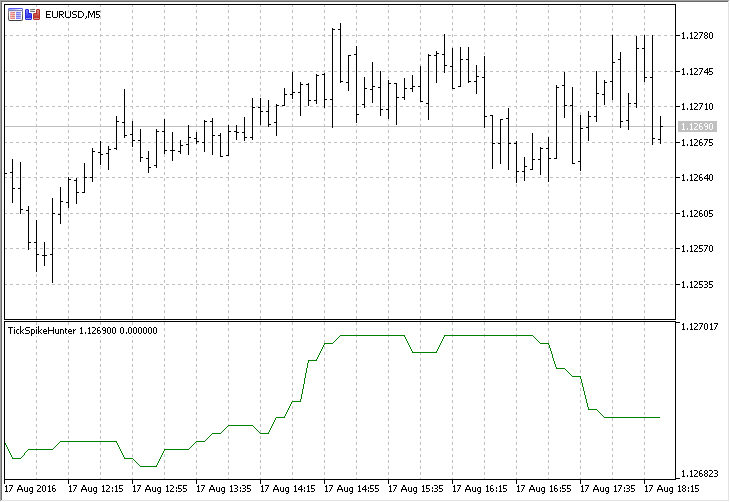
Press the F5 button (Start/Resume debugging) and watch the indicator work in the MetaTrader 5 terminal.
Now it is for code debugging, which allows to identify errors and improve the program operation speed.
Code Profiling to speed up the operation
The execution speed is crucial for programs working in real time. The MetaEditor development framework allows to easily and quickly evaluate the time consumption of any part of the code. To do that, it is necessary to run the code profiler and let the program work for a while. A minute would be enough for profiling this indicator.
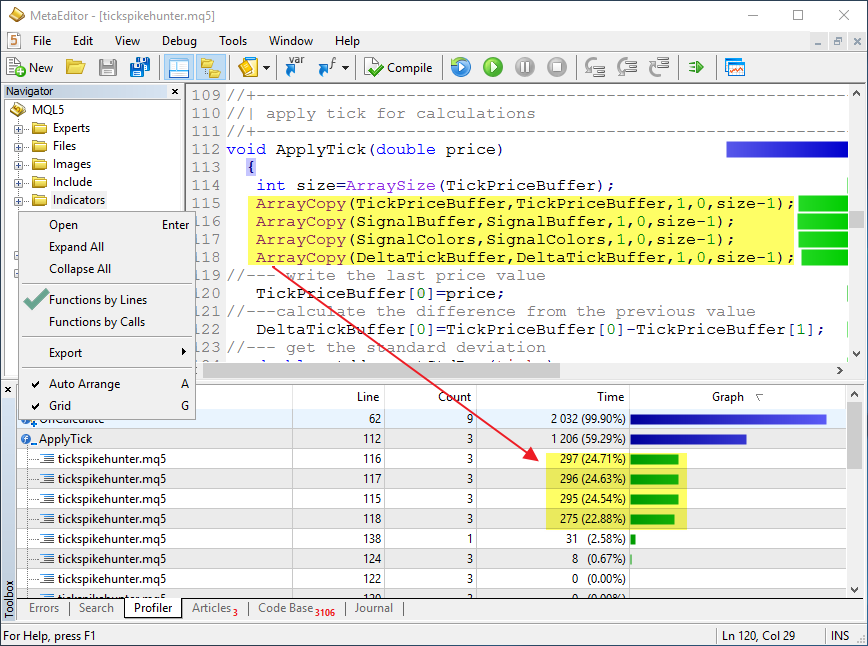
As you can see, most of the time (59.29%) was spent on processing the ApplyTick() function, which was called 41 times from the OnCalculate() function. The OnCalculate() itself was called 143 times, but the price of the incoming tick was different from the previous only in 41 cases. At the same time, in the ApplyTick() function itself the most time was consumed by the calls to the ArrayCopy() functions, which perform only auxiliary actions and does not perform calculations the indicator was intended for. The calculation of the standard deviation on line 138 took merely 2.58% of the total program execution time.
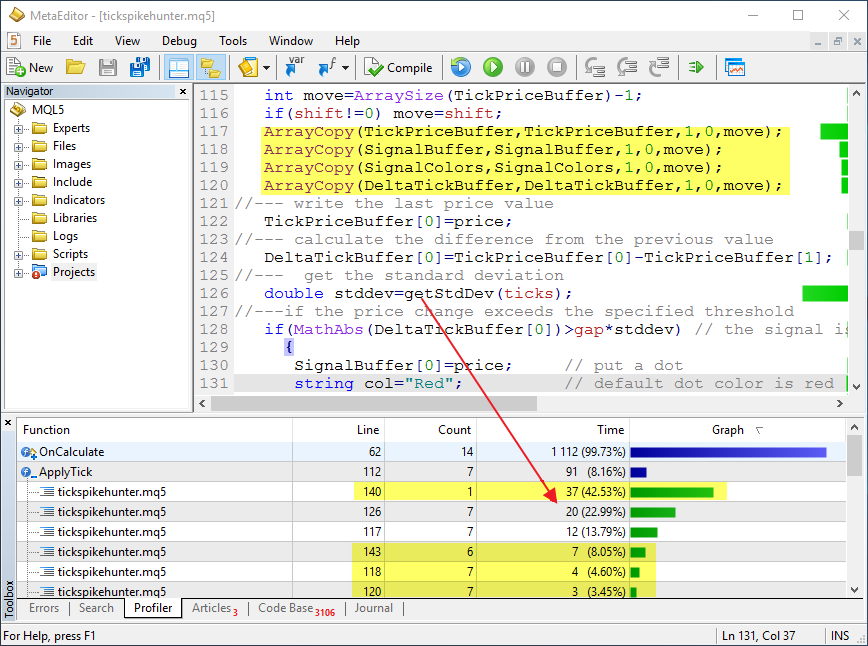
Let us try to reduce the non-productive costs. To do that, attempt to copy not every element of the arrays (TickPriceBuffer, etc.) but only the latest 200. After all, 200 latest values are sufficient, besides, the number of ticks in a single trade session may reach tens or hundreds of thousands. There is no need to view them all. Therefore, introduce an input parameter - shift=200, which defines the number of values to be shifted. Add the lines marked in yellow to the code:
//--- input parameters
input int      ticks=50;         // the number of ticks in calculation
input int      shift=200;        // the number of shifted values
input double   gap=3.0;          // width of the channel in sigmas
...
void ApplyTick(double price)
  {
//--- the number of elements to be shifted in the indicator buffers on each tick
   int move=ArraySize(TickPriceBuffer)-1;
   if(shift!=0) move=shift;
   ArrayCopy(TickPriceBuffer,TickPriceBuffer,1,0,move);
   ArrayCopy(SignalBuffer,SignalBuffer,1,0,move);
   ArrayCopy(SignalColors,SignalColors,1,0,move);
   ArrayCopy(DeltaTickBuffer,DeltaTickBuffer,1,0,move);
Run the profiling again and see the new result — time required for copying arrays has dropped by hundred or thousand times, now the most time is used by the call to StdDev(), which is responsible for calculation of the standard deviation.
Thus, operation speed of the ApplyTick() has been improved by several orders of magnitude, which allows to significantly save time during strategy optimization and when working in real time. After all, there can never be too many computational resources.
Analytical code optimization
Sometimes even optimally written code can be made to work even faster. In this case, calculation of the standard deviation can be accelerated if the formula is slightly modified.
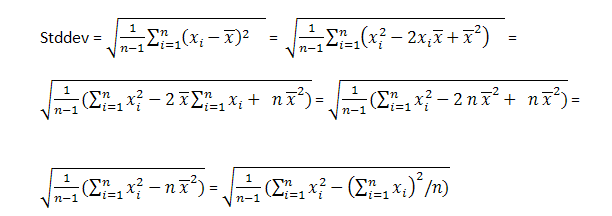
Thus, it becomes possible to simply calculate the square of sum and sum of squares of the price increments. This allows to perform less mathematical operations on each tick. On each tick it simply subtracts the dropping element of the array and adds the incoming array element to the variables that contain the sums.
Create a new getStdDevOptimized() function that applies the familiar method of shifting the values of an array within itself.
//+------------------------------------------------------------------+
//| calculates the standard deviation based on formulas              |
//+------------------------------------------------------------------+
double getStdDevOptimized(int number)
  {
//---
   static double X2[],X[],X2sum=0,Xsum=0;
   static bool firstcall=true;
//--- the first call
   if(firstcall)
     {
      //--- set the sizes of dynamic arrays as greater than the number of ticks by 1
      ArrayResize(X2,ticks+1);
      ArrayResize(X,ticks+1);
      //--- guarantees non-zero values at the beginning of calculations
      ZeroMemory(X2);
      ZeroMemory(X);

      firstcall=false;
     }
//--- shift arrays
   ArrayCopy(X,X,1,0,ticks);
   ArrayCopy(X2,X2,1,0,ticks);
//--- calculates the new incoming values of sums
   X[0]=DeltaTickBuffer[0];
   X2[0]=DeltaTickBuffer[0]*DeltaTickBuffer[0];
//--- calculate the new sums
   Xsum=Xsum+X[0]-X[ticks];
   X2sum=X2sum+X2[0]-X2[ticks];
//--- squared standard deviation
   double S2=(1.0/(ticks-1))*(X2sum-Xsum*Xsum/ticks);
//--- count the sum of ticks and calculate the expected payoff
   double stddev=MathSqrt(S2);
//---
   return (stddev);
  }
Let us add the calculation of the standard deviation using the second method via the getStdDevOptimized() function to ApplyTick() and run the code profiling again.
//--- calculate the difference with the previous value
   DeltaTickBuffer[0]=TickPriceBuffer[0]-TickPriceBuffer[1];
//--- get the standard deviation
   double stddev=getStdDev(ticks);
   double std_opt=getStdDevOptimized(ticks);
Execution result:
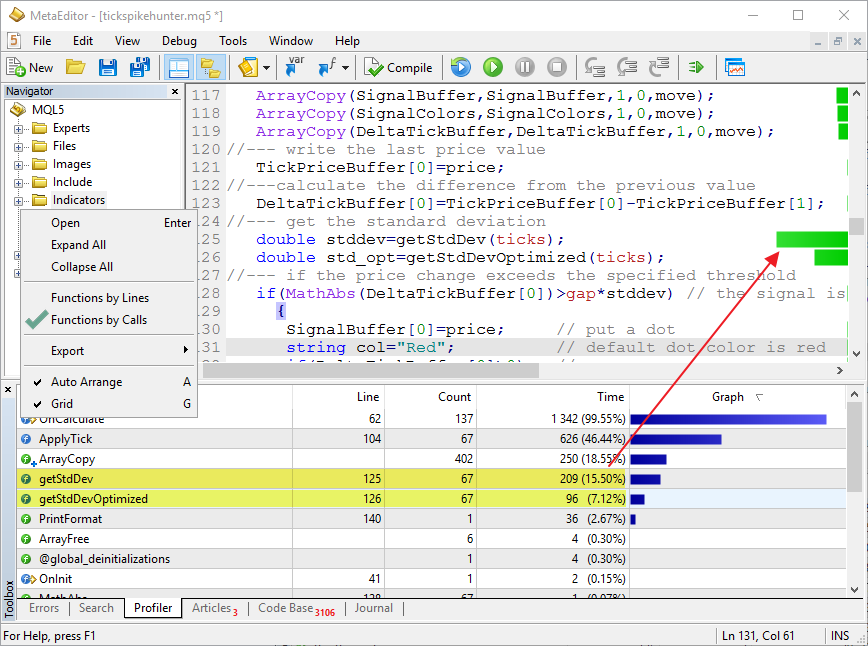
It is evident that the new getStdDevOptimized() function requires half the time — 7.12%, unlike the brute-force in the getStdDev() — 15.50%. Thus, using the optimal calculation method grants even greater gain in the program operation speed. For more details please read the article 3 Methods of Indicators Acceleration by the Example of the Linear Regression.
By the way, about calling the standard functions - in this indicator the price is obtained from the close[] timeseries, which is based on the Bid prices. There are two more ways to obtain this price — using the SymbolInfoDouble() and SymbolInfoTick() functions. Let us add these calls into the code and run the profiling again.
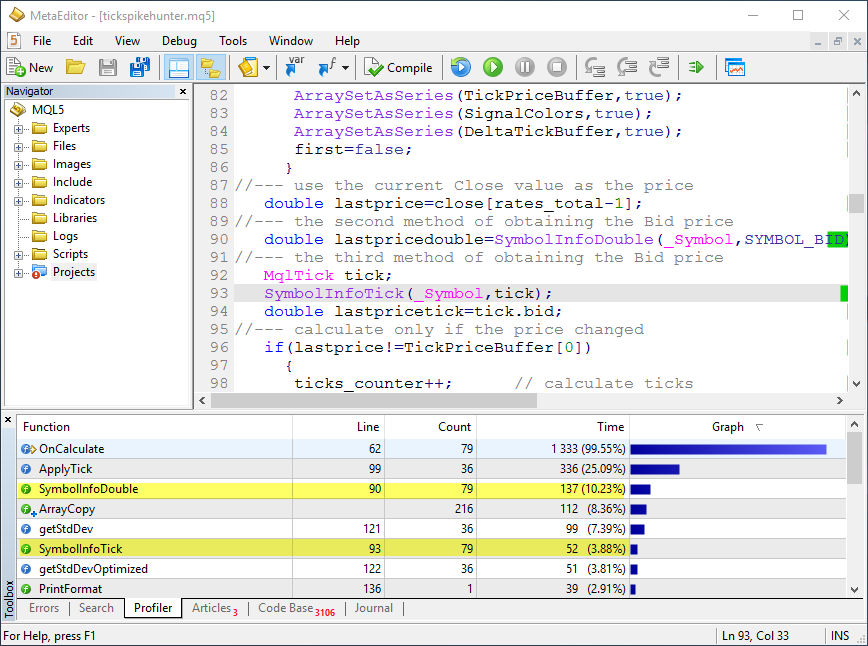
As you can see, there is a difference in operation speed here as well. This makes sense, since reading ready prices from close[] does not require any additional costs unlike the universal functions.
Debugging on real ticks in the tester
When writing indicators and trading robots, it is impossible to foresee all possible scenarios that may occur during online work. Fortunately, the MetaEditor allows to perform debugging using history data as well. Simply run the debugging in visual testing mode, and you will be able to test the program on the specified history interval. It is possible to accelerate, pause and skip testing to the desired date.
Important: in the Debug window, set the tick modeling mode to "Every tick based on real ticks". This will allow to use the real quotes stored by the trade server for debugging. They will be automatically downloaded to your computer at the first test.
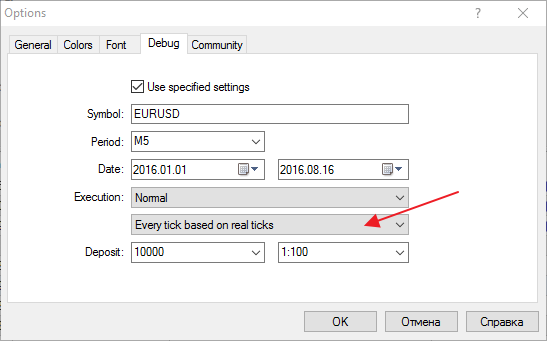
If these parameters are not set in the MetaEditor, then the visual testing will use the current tester settings. Specify the "Every tick based on real ticks" mode in them.
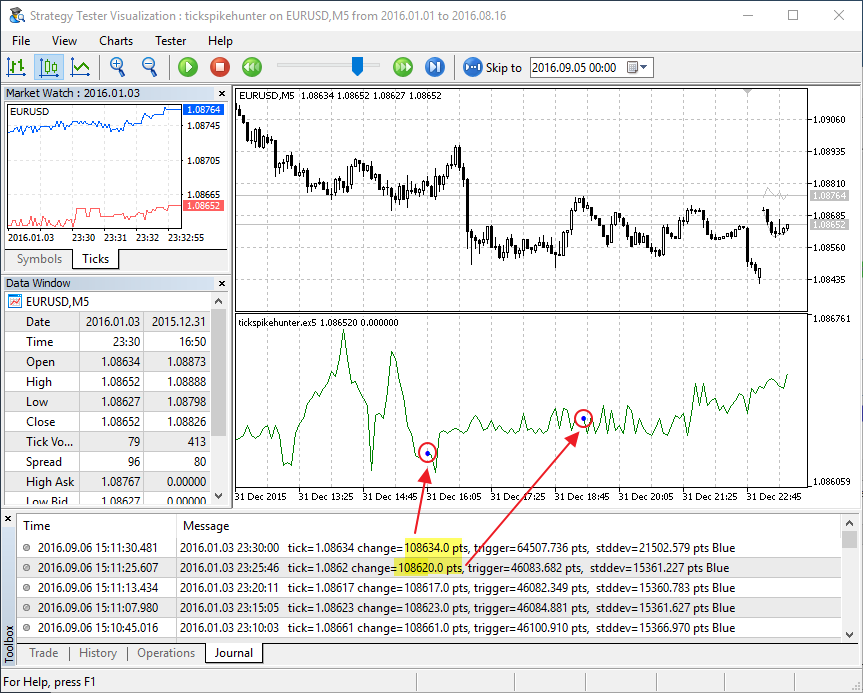
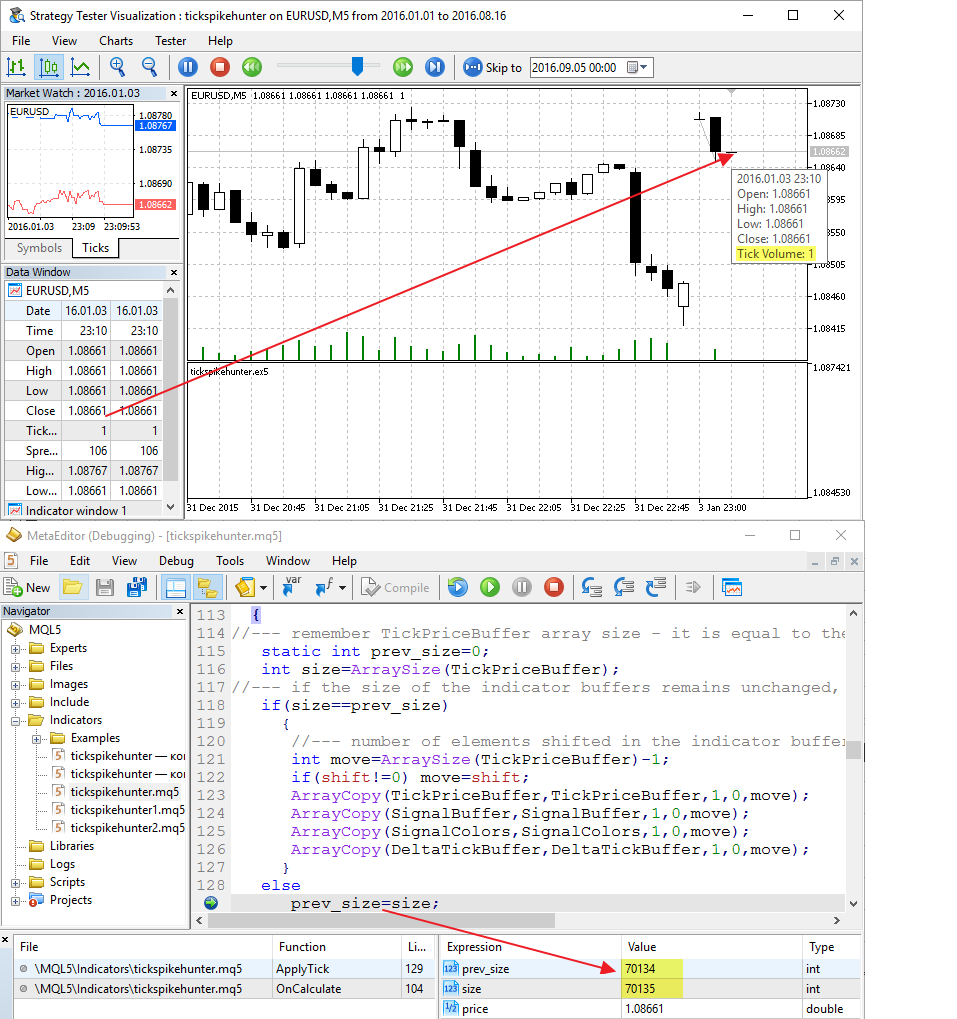
Strange gaps can be seen on the tick chart. This means that there is an error is the algorithm. There is no knowing how much it would have taken to track it while testing in real time. In this case, the Journal logs of the visual tester show that the strange gaps occur at the moment a new bar appears. That's it! — we forgot that the size of the indicator buffers increases by 1 during the transition to the new bar. Make corrections to the code:
void ApplyTick(double price)
  {
//--- store the size of the TickPriceBuffer array - it is equal to the number of bars on the chart
   static int prev_size=0;
   int size=ArraySize(TickPriceBuffer);
//--- if the size of the indicator buffers did not change, shift all elements backwards by 1 position
   if(size==prev_size)
     {
      //--- the number of elements to be shifted in the indicator buffers on each tick
      int move=ArraySize(TickPriceBuffer)-1;
      if(shift!=0) move=shift;
      ArrayCopy(TickPriceBuffer,TickPriceBuffer,1,0,move);
      ArrayCopy(SignalBuffer,SignalBuffer,1,0,move);
      ArrayCopy(SignalColors,SignalColors,1,0,move);
      ArrayCopy(DeltaTickBuffer,DeltaTickBuffer,1,0,move);
     }
   prev_size=size;
//--- store the latest price value
   TickPriceBuffer[0]=price;
//--- calculate the difference with the previous value
Run visual testing and place a breakpoint in order to catch the moment a new bar is opened. Add the values to watch and make sure everything is correct: the number of bars on the chart has increased by one, the tick volume of the current bar is 1 — it is the first tick of the new bar.
So, code optimization has been performed, errors have been fixed, execution times of different functions have been measured. Now, the indicator is ready for work. We can now run the visual testing and observe what happens after signals appear on the tick chart. Is there anything that can be further improved? A coding perfectionist would say yes! There has been no attempt to use a circular buffer to improve the operation speed yet. Those interested can check for themselves — does it give a performance boost?
The MetaEditor is a ready laboratory for developing trading strategies
In order to write an automatic trading system, it is important to not only have a convenient development environment and powerful programming language, but also additional tools for debugging and calibration of the program. This article described:
- how to create a tick chart in the first approximation in a couple of minutes;
- how to use debugging on a chart in real time mode by pressing the F5 button;
- how to run the code profiling to identify inefficient code parts;
- how to perform fast debugging on history data in visual testing mode;
- how to view the values of the required variables during debugging.
Developing an indicator that displays trade signals is often the first step needed to create a trading robot. Visualization helps to develop the trading rules or to reject the idea even before the project had started.
Utilize all the features of the MetaEditor development environment to create efficient trading robots!
Related articles:
- MQL5: Create Your Own Indicator
- Creating Tick Indicators in MQL5
- The Principles of Economic Calculation of Indicators
- Averaging Price Series for Intermediate Calculations Without Using Additional Buffers
- Debugging MQL5 Programs
Translated from Russian by MetaQuotes Ltd.
Original article: https://www.mql5.com/ru/articles/2661
Warning: All rights to these materials are reserved by MetaQuotes Ltd. Copying or reprinting of these materials in whole or in part is prohibited.

 MQL5 Cookbook - Trading signals of moving channels
 How to copy signals using an EA by your rules?
 Cross-Platform Expert Advisor: Orders
 Graphical Interfaces X: Updates for Easy And Fast Library (Build 2)
- Free trading apps
- Over 8,000 signals for copying
- Economic news for exploring financial markets
You agree to website policy and terms of use
Good afternoon, help for a beginner! I need to signal only at a larger number of ticks for example only from 10...
You should ask your question in one of the topics for beginners:
Questions from Beginners MQL5 MT5 MetaTrader 5
Questions from Beginners MQL4 MT4 MetaTrader 4
You need to ask your question in one of the newbie threads:
Questions from Beginners MQL5 MT5 MetaTrader 5
Questions from Beginners MQL4 MT4 MetaTrader 4