Regardez les tutoriels vidéo de Market sur YouTube
Comment acheter un robot de trading ou un indicateur
Exécutez votre EA sur
hébergement virtuel
hébergement virtuel
Test un indicateur/robot de trading avant d'acheter
Vous voulez gagner de l'argent sur Market ?
Comment présenter un produit pour qu'il se vende bien
Indicateurs techniques pour MetaTrader 5 - 27
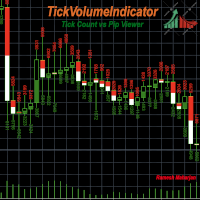
Il existe différents indicateurs et méthodes pour identifier les tendances sur un graphique. TickVolumeIndicator en fait partie. Il vous aide à identifier et à prédire les tendances futures en affichant les tendances passées à partir des données des ticks.
TickVolumeIndicator est un indicateur qui colore les bougies visibles sur le graphique à partir des volumes de ticks. Les volumes de ticks correspondent aux valeurs des cours acheteur et vendeur. L'utilisateur peut choisir entre le nombre de
FREE

Introducing the Professional Arka STM Signal Indicator
With Arka Candle Close Time – 100% Free Version Fast, Accurate, and Unmatched in Identifying Trading Opportunities
This indicator is the result of combining advanced price action analysis with specialized market algorithms, delivering clear, timely, and profitable signals. Completely Free – No Installation or Usage Limits
️ An automated trading bot, fully synchronized with it, is also ready to run. The Power of ARKA STM Signa
FREE

For those who love to follow Volume behavior here it is a little indicator that could be used as a replacement for the old and standard MT5 built-in volume indicator. The trick here is that this indicator paints the volume histogram based on the direction of the candle giving to the trader a quick "Heads Up" on what is happening, visually! It could be used to study and see for instance, the volume and past bars volume during (or, reaching) a peak (Tops and Bottoms). UP candles are shown in pale
FREE

This indicator converted from 5 min Buy and Sell Range Filter - guikroth version on TradingView Popularity of the Range Filter
The Range Filter is a very popular and effective indicator in its own right, with adjustments to the few simple settings it is possible to use the Range Filter for helping filter price movement, whether helping to determine trend direction or ranges, to timing breakout or even reversal entries. Its practical versatility makes it ideal for integrating it's signals into a

The purpose of Impulse Release is to prevent trading in the wrong direction. While the Impulse System operates in a single timeframe, Impulse Release is based on two timeframes. It tracks both the longer and the shorter timeframes to find when the Impulse points in the same direction on both. Its color bar flashes several signals: If one timeframe is in a buy mode and the other in a sell mode, the signal is "No Trade Allowed", a black bar. If both are neutral, then any trades are allowed, showi

Hidden Edge – High-Low PreUS High-Low PreUS is a clean and lightweight indicator that marks key reference levels before the US session begins.
It draws a session box from 00:01 to 09:00 CET, identifying the high and low of the Asian session, and includes additional reference elements to support structured intraday trading decisions. Features Draws a rectangular range from 00:01 to 09:00 CET Marks the high and low of the session clearly Plots a horizontal yellow line as a suggested stop level bas
FREE
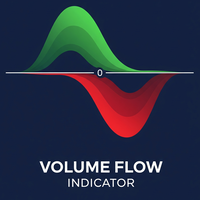
Volume Flow Indicator (VFI) - User Manual 1. General Introduction The Volume Flow Indicator (VFI) is an advanced technical oscillator designed to measure the strength and sustainability of a price trend by incorporating both price and volume data. Developed based on the concepts of On-Balance Volume (OBV) but with significant improvements, the VFI provides deeper insight into money flow and the conviction behind price movements. This indicator is not an automated trading system but a powerful an
FREE
VWAP (Volume Weighted Average Price) is a technical analysis indicator that shows the average price of an asset, weighted by trading volume, over a specified time period. It is calculated by dividing the total dollar value traded (price × volume) by the total volume. Formula: VWAP = sum(PRICE*VOLUME)/sum(VOLUME)
MM vwap have 4 options to set anchor:
Month Week Day Session Indicator will be updated in future.
FREE

Qu'est-ce que Pi Cycle Projections ? Pi Cycle Projections est un système de trading complet pour MetaTrader 5 qui vous offre un double avantage : il identifie non seulement des signaux d'entrée à haute probabilité (croisement de moyennes mobiles) dans le moment présent, mais il trace également une carte visuelle des scénarios futurs possibles du marché. Pensez-y comme à un système deux-en-un : Un générateur de signaux intelligent qui vous dit quand agir, via les croisements de moyennes mobiles P
FREE

The big figure is a crucial aspect of forex trading, serving as a reference point for trade execution, risk management, and technical analysis. By understanding the importance of the big figure and incorporating it into their trading strategies, forex traders can improve their decision-making process and increase the likelihood of successful trades. Why is the Big Figure Important? The big figure is important for several reasons: Simplification: Traders often refer to the big figure when discu
FREE

The indicator shows the current timeframe and symbol name. It is also possible to turn on the indication of time until the end of the current bar. In the settings, you can specify: - the location of the indicator in relation to the terminal window, top left, top right, bottom left and bottom right - a row of text display arrangements so that the inscriptions do not overlap each other - color - font - font size.
FREE

Indicateur de suivi de tendance avec filtre moyen du signal d'entrée
Cet indicateur agit comme un tracker de tendance et un filtre, utilisant les moyennes mobiles comme signaux d'entrée. Les moyennes mobiles sont essentielles pour déterminer différents horizons de tendance :
- La moyenne primaire standard sur 200 périodes indique la tendance à long terme. - La moyenne secondaire sur 50 périodes indique la tendance à moyen terme. - La moyenne tertiaire sur 20 périodes indique la tendance la pl
FREE
How To Determine If The Market is Strong Or Weak?
Strength Meter uses an Adaptive Algorithm That Detect Price Action Strength In 4 Important Levels! This powerful filter gives you the ability to determine setups with the best probability.
Features Universal compatibility to different trading systems Advance analysis categorized in 4 levels Level 1 (Weak) - Indicates us to WAIT. This will help avoid false moves Weak Bullish - Early signs bullish pressure Weak Bearish - Early signs bearish press

You may find this indicator helpfull if you are following a session based strategy. The bars are colored according to the sessions. Everything is customisable.
Settings: + Asia Session: zime, color, high, low + London Session: zime, color, high, low + US Session: zime, color, high, low
Please feel free to comment if you wish a feature and/or give a review. Thanks.
FREE

In this indicator you choice a data to be used from yesterday (high, low, open, close, etc) to automatically draw an line to be the zero. And, from that a percentage deviation ("Percentage to be used") is calculated and used to draw others line to both side until a limit be reached.
Both sides can have diferrent colours as show in screenshots. Also, more than one indicator can be used at same time.
FREE

Zone Alerts by iXOpay - MT5 Indicator What it is Indicator that marks price zones and sends alerts when the price touches, breaks, exits, or retests those zones. Neutral, informative tool. No promises of profit. How to use Attach to any symbol and timeframe. Set the zone boundaries and enable the desired events. Optionally enable trend/volatility filters. Receive alerts and manage your plan. Inputs EMA_Period (20/50/100/200) - optional trend filter Stoch_K , Stoch_D , Stoch_Smooth - confirmation
FREE

VWAP WAVE [Riz] - MT5 Indicator Advanced VWAP Divergence Detection System
VWAP Wave is a professional-grade Volume Weighted Average Price indicator with built-in divergence detection system. It identifies high-probability reversal and continuation signals by analyzing price-VWAP relationships across multiple timeframes.
FREE

The initial balance (IB) is a range in which the price spent its first two OPT periods after the opening. In other words, the opening balance is a range of the first hour after the market opened. The opening balance arose from room trading, as room traders observed the various ranges after the market opened.
This indicator allows you to enter the starting and ending hours and minutes of a specific hourly time range so that the trader can set up different IBs according to the market.
Automatic
FREE
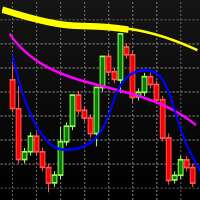
Baseado no indicador MIMA SAR, que é uma combinação dos indicadores MIMA Consolidação e MIMA Tendência, da metodologia Phicube. O indicador é composto pelos 8 fractais, 17,34.72.144.305,610.1292,2554. Sendo a tendência indicada pelas linhas finas e a consolidação pelas linhas mais espessas. Para usar o indicador de maneira adequada deve-se partir do princípio de que tudo na natureza segue o caminho que oferece menor resistência. Isso significa que para uma reversão da tendência ocorrer nesse mod
FREE

https://www.mql5.com/en/users/gedeegi/seller
The design features a bold orange countdown timer icon set against a dark gray background, with the clock hands pointing toward the upper right. Below the timer, a candlestick chart displays green and red bars that represent price movements across different time periods, with sharp detailing and balanced composition. The countdown time of "05:17" is prominently displayed next to the clock, adding a dynamic and informative element to the image.
FREE

Apply to the 5 minute timeframe against the major USD forex pairs. AUDUSD EURUSD GBPUSD USDCAD USDCHF USDJPY Highlights the PropSense Book Levels Turn on/off for Sydney, Asia, London and New York Sessions Shows the Tokyo and London Fixes Turn on/off for Tokyo and London Configure how many historical fixes to show Shows the Sessions Turn on/off visible indication for sessions (supports 4 sessions) Visibly shows the sessions (out of the box configuration for Sydney, Tokyo, London and New York) Hig
FREE

We at Minions Labs love to study, challenge and discover new facts about Price Behavior in current markets. We would NOT call it Price Action because today this is a word totally overused and means, thanks to the False Prophets out there, absolutely NOTHING.
The study hypothesis we propose is this: Some Assets, in certain Timeframes, present a behavior of Price continuity when the candlesticks close without a Wick on them... So the purpose of this indicator is to "color" those candlesticks who
FREE
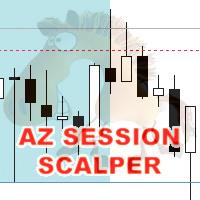
AZ session scalper
A small but useful session indicator, designed primarily for scalping. Enable the session you plan to trade, watch the reaction of the M5/M15 candlesticks to the level of the previous trading session, and enter. We always look at the reaction of the current session to the previous one. For example, if you trade the Americas, enable the European session, and watch how one session takes away liquidity from another. Important: adjust the time to your broker's time zone in the i
FREE

Purpose and functions of the indicator The indicator determines and marks the moments of trend change on the chart based on the theory of fractal levels breakout on any of the analyzed timeframes. If a breakout based on all rules is valid, a horizontal line with corresponding color will appear on the chart. If there is an uptrend, the line will be blue. In the descending trend, the line will be red. The blue line is a strong support level, the trader should look for buying opportunities above th
FREE
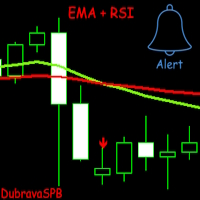
Introducing EMA + RSI – A Trading Indicator Combining Exponential Moving Average (EMA) and Relative Strength Index (RSI) Analysis. The indicator signals trade entries with arrows on the chart when two EMAs cross and the RSI meets the specified conditions.
It is initially optimized for the GBPUSD currency pair on the 1H timeframe, but users can customize it to fit their strategy. Key Features: Flexible settings: Users can adjust EMA length, choose the price for calculation, and configure RSI para
FREE

RITZ Candle Kaufman’s AMA is a precision market-flow indicator built around Kaufman’s Adaptive Moving Average (KAMA / AMA) — a dynamic smoothing algorithm that automatically adjusts to changing volatility.
This enhanced version interprets AMA momentum directly into smart candle-color signals , giving traders a clean, noise-filtered view of trend strength and directional bias. Where most indicators repaint or react too slowly, RITZ Candle AMA delivers stable, non-repainting color shifts based on
FREE
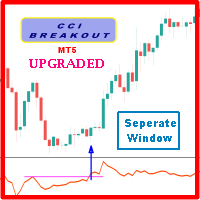
Probability emerges to record higher prices when Commodity Channel Index breaks out oscillator historical resistance level when exhibit overbought values. Since, oscillator breakout of support and resistance have similar effect as price breaks support and resistance levels, therefore, its highly advised to confirm price breakout with oscillator breakout; certainly, will have the same output in short trades. Concept is based on find swing levels which based on number of bars by each side of peak
FREE

FX Correlation Matrix is a powerful multi-timeframe dashboard that helps traders analyze real-time currency correlations of up to 28 symbols at a glance. With customizable settings, sleek design, and manual symbol selection option, it enhances trade accuracy, reduces risk, and identifies profitable correlation-based opportunities. Setup & Guide: Download MT4 Version here. Exclusively for you: It's your chance to stay ahead of the market. Follow our MQL5 channel for daily market insights, char

Pivot Points Classic – L’indicatore essenziale per ogni trader tecnico Questo indicatore disegna automaticamente i livelli di Pivot Point più utilizzati dai trader professionisti, con supporto completo a 4 metodi di calcolo: Metodi supportati :
• Traditional
• Fibonacci
• Woodie
• Camarilla Caratteristiche principali :
Calcolo su timeframe superiore (multi-timeframe)
Visualizzazione chiara dei livelli P, R1, R2, R3, S1, S2, S3
Etichette dinamiche con nome e valore del livello
Colori per
FREE

Bienvenue dans le futur du trading avec le KMeans Price Zones Detector, un indicateur innovant pour MetaTrader qui utilise la puissance de l'apprentissage automatique pour identifier les zones de prix clés. Cet outil utilise l'algorithme de clustering KMeans pour détecter dynamiquement les centroïdes dans les données de prix, mettant en évidence les zones où les prix sont plus susceptibles de rencontrer un support, une résistance ou une consolidation. Algorithme KMeans innovant Le KMeans Price Z
FREE

** All Symbols x All Timeframes scan just by pressing scanner button ** *** Contact me to send you instruction and add you in "Head & Shoulders Scanner group" for sharing or seeing experiences with other users. Introduction: Head and Shoulders Pattern is a very repetitive common type of price reversal patterns. The pattern appears on all time frames and can be used by all types of traders and investors. The Head and Shoulders Scanner indicator Scans All charts just by pressing

Divergence Hunter - Professional Multi-Oscillator Divergence Detection System Overview Divergence Hunter is a professional-grade technical indicator designed to automatically detect and visualize price-oscillator divergences across multiple timeframes. Built for serious traders who understand the power of divergence trading, this indicator combines precision detection algorithms with an intuitive visual interface. Key Features Multiple Oscillator Support: RSI (Relative Strength Index) MACD (Mo
FREE

L'algorithme est basé sur l'idée de l'indicateur Currency Power Meter. Dans cette version, le nombre de valeurs affichées est illimité, son code est plus compact et rapide, les valeurs de la barre courante peuvent être obtenues grâce aux tampons indicateurs. Ce que l'indicateur montre : une bande fine et le chiffre supérieur devant la devise montrent l'indice de force relative pour les N dernières heures (N est défini dans les paramètres de la variable 'Heures'), une bande plus large montre l'
FREE

AI Adaptive Market Holographic System Indicator Based on Microstructure and Field Theory Abstract: This paper aims to explore the construction principles and implementation mechanism of a novel financial market analysis tool—the Micro gravity regression AIselfregulation system. This system fuses Market Microstructure theory, classical mechanics (elasticity and gravity models), information entropy theory, and adaptive AI algorithms. By aggregating Tick-level data in real-time, physically modeling

Thermo MAP is a multicurrency and multitimeframe indicator that display a smart heat map based on proprietary calculations. Watch how Forex market moved and is currently moving with a single dashboard and have a consistent and good idea of what is happening!
It can be suitable for both scalping or medium/long term, just select options that better fit your trading style Symbols list are automatically sorted based on the preferred column. There is the possibility to click on: First row, timeframe
FREE

Вилка Нео v5, разрабатывалась для торговой системы "Оракул", но постепенно дополнялась, например - углами Ганна и другими опциями... Можно создавать графические объекты с заданным цветом, стилем и толщиной, такие как: прямоугольники с заливкой и без, отрезки трендлиний и нестандартный инструмент - "вилка Нео" в виде трезубца, так же есть возможность интерактивно настраивать цветовую палитру прямо с графика, настраивать видимость объектов для разных ТФ, толщину и стили...
Панель переключается кл
FREE

Forex 17 – Bollinger Bands Pure Sound Alert No Plots génère des alertes sonores lorsque le prix dépasse la bande supérieure ou inférieure des Bollinger Bands. Des sons distincts sont utilisés pour les cassures haussières et baissières, aidant à identifier des conditions potentiellement surachetées ou survendues. Cette version sans affichage graphique ne trace aucun élément visuel sur le graphique. Les paramètres personnalisables incluent la période, la déviation et les intervalles d’alerte. L’ap
FREE
[ MT4 Version ] Order Block Indicator MT5 — Precision Trading Made Simple
Order Block Indicator MT5 is designed to help traders spot powerful reversal zones effortlessly — without cluttered charts or guesswork.
Built for scalping , swing trading , and smart intraday decisions , it highlights active order blocks across multiple timeframes with precision, speed, and full customization. Trade with clarity, save valuable time, and react instantly to market structure changes — even across Forex

El **Heiken Ashi Smoothed** es una versión suavizada del indicador técnico Heiken Ashi, que se utiliza en el análisis de gráficos de velas para identificar tendencias del mercado y pronosticar movimientos de precios. Este indicador se basa en el promedio de datos de precios para formar un gráfico de velas que ayuda a los traders a filtrar el ruido del mercado.
**¿Para qué sirve?** Este indicador se utiliza para identificar cuándo los traders deben permanecer en una operación y cuándo está por
FREE

WYSIWYG Candle for WYSIWYG ORB Smart Breakout Candles is a professional multi-method breakout detection indicator that combines ATR, Bollinger Bands, Opening Range Breakout (ORB), and Squeeze Detection to identify high-probability breakout opportunities across all financial instruments. This indicator provides real-time visual signals through colored candles and precise arrow placements, making it ideal for traders seeking reliable volatility-based entries. "Use in conjunction with the WYS
FREE

I'm sure after a lot of research on the internet, you haven't found any indicator that can help you with forex or binary trading in the latest probability strategy created by famous trader Ronald Cutrim. The strategy is based on a simple count of green and red candles, checking for a numerical imbalance between them over a certain period of time on an investment market chart. If this imbalance is confirmed and is equal to or greater than 16%, according to trader Ronald Cutrim, creator of the pro
FREE
If you love this indicator, please leave a positive rating and comment, it will be a source of motivation to help me create more products <3 Key Takeaways StochRSI is an oscillator that measures the RSI level relative to its high-low range over a period of time. It is more sensitive than the traditional RSI and can highlight overbought or oversold conditions in the market. StochRSI is typically used to generate more frequent and timely trading signals compared with the traditional RSI. StochRSI
FREE
N/B: All our product purchase comes with our free ‘’DAILY SCALPER EA’’ - bit.ly/4qlFLNh Whatsapp Developer for yours after successful purchase
Eternal Spike Detector Pro - M5 Mastery System
HOW TO TRADE THIS SYSTEM
TRADING RULES
For CRASH 500/900/1000:
SELL SETUP:
· Wait for RED DOWN ARROW to appear · Enter SELL at the close of the M5 candle where arrow appears · Stop Loss: 1.5x ATR above the entry high · Take Profit: 2-3x ATR below entry · Only trade maximum 7 signals per day

The Spider ZIGZAG is an algorithm to determine how critical the current peak is by spreading several lines with different parameters instead of one line between each 2 peaks. 1. The more zigzag's lines meet at a peak the higher probability the market will go for correction or change direction. 2. Usually when 3-4 zigzag's lines meet at a peak, the market enters a correction period, this don't happen instantly, it might take some time. 3. Usually when 5-6 zigzag's lines meet at a peak, th
FREE

The Price Action Finder Multi indicator is an indicator of entry points that searches for and displays Price Action system patterns on dozens of trading instruments and on all standard time frames: (m1, m5, m15, m30, H1, H4, D1, Wk, Mn). The indicator places the found patterns in a table at the bottom of the screen. By clicking on the pattern names in the table, you can move to the chart where this pattern is located. Manual (Be sure to read before purchasing) | Version for MT4 Advantages
1. Pat

« “Naturu” est un indicateur manuel qui utilise la symétrie de la nature comme algorithme.
Dominez le marché grâce à une stratégie simple et à une sagesse cachée ! Lorsque vous chargez l’indicateur, deux lignes apparaissent — Haut (Top) et Bas (Bottom).
Cliquez une fois sur une ligne pour l’activer.
Pour la déplacer, cliquez simplement sur la bougie où vous souhaitez la placer. Vous définissez un point haut et un point bas, et l’indicateur calcule automatiquement : une zone magenta montrant l’en
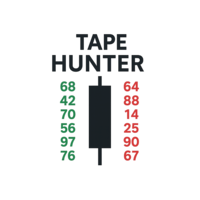
Tape Hunter – Votre radar Effort vs Résultat sur MT5 Tape Hunter est l’indicateur ultime pour les traders souhaitant voir le véritable jeu des prix sur MetaTrader 5. Il affiche de manière claire et intuitive les volumes agressifs d’achat et de vente basés sur le POC (Point of Control), vous permettant de visualiser l’effort du marché et le résultat réel de chaque chandelier. ️ Pourquoi est-ce important ?
Tout volume ne fait pas bouger le prix ! Tape Hunter met en évidence si l’effort (vo

Auto Optimized RSI est un indicateur fléché intelligent et facile à utiliser, conçu pour fournir des signaux d’achat et de vente précis. Il utilise des simulations de trading sur des données historiques pour déterminer automatiquement les niveaux RSI les plus efficaces pour chaque instrument et période. Cet indicateur peut être utilisé comme un système de trading autonome ou intégré dans votre stratégie existante, et il est particulièrement utile pour les traders à court terme. Contrairement a

Heiken Ashi Yemeni Heiken Ashi Yemeni is a professional indicator for MetaTrader 5 that combines modified Heiken Ashi candles with two smart trend lines ( Yemen 1 & Yemen 2 ) based on advanced and complex internal calculations, providing a clearer view of the trend and reducing market noise. The indicator is designed to give traders a smooth and easy-to-read market overview , making it suitable for manual trading and trend-based strategies . Indicator Features Enhanced Heiken Ashi candles for
FREE

This indicator that I am sharing publicly is an adaptation for MetaTrader 5 (MT5), and I want to make it absolutely clear that it is not my original work . The original code was published on the TradingView platform and can be freely accessed at the following official link:
TradingView – Original Indicator The reason for making it public on MetaTrader 5 is that I want more people to have free access to it, just as its original author shares it on TradingView. This publication is not intended
FREE

TransitGhost Signal indicator, this is one of my best forex trading strategy. The strategy is based on the simple moving average cross, 5 SMA AND 200 SMA of which take a longer time to cross. Whenever the is a cross between the 5 SMA and 200 SMA a signal will be given, when the 5 SMA cross the 200 SMA to the upside ,a buying arrow will appear on chart, and push notification(alert) "Buy now, use proper risk management" will be sent on both the MT5 PC and mobile app, and when the 5 SMA cross the 2
FREE
Indicateur de signaux pour les options binaires, également utilisé de manière efficace sur le Forex et d’autres marchés. Il convient au trading en grille (grid) de court terme sur M1–M5 et inclut des signaux pour renforcer les positions étape par étape. La version gratuite fonctionne uniquement sur la paire XAUUSD. La version complète pour MetaTrader 5 est disponible ici : https://www.mql5.com/en/market/product/156185 L’indicateur utilise une adaptation à deux niveaux : un profil de vitesse de b
FREE

About the indicator: DALA Forecast is a universal tool for predicting the dynamics of time series of any nature. For prediction, modified methods of nonlinear dynamics analysis are used, on the basis of which a predictive model is built using machine learning methods. To get the trial version of the indicator, you can contact me in private messages.
How to use the indicator: Apply the indicator to your chosen financial instrument or indicator with the settings you need. The prediction will be
FREE

English
VWAP Daily (Clean) is a simple and lightweight indicator that plots the classic Daily VWAP (Volume Weighted Average Price) directly on your MT5 chart. Features: Classic Daily VWAP calculation Supports real volume (if available) or tick volume Timezone offset option to match your broker’s server time Weekend merge option (merge Saturday/Sunday data into Friday) Clean version → no arrows, no alerts, only VWAP line VWAP is widely used by institutional traders to identify fair value, su
FREE

PRO VERSION https://www.mql5.com/en/market/product/144989?source=Site https://www.mql5.com/en/users/gedeegi/seller GEN Support & Resistance (EGGII77) is an MT5 indicator that automatically detects and draws Support & Resistance levels based on pivot highs and lows. The indicator features two sets of S&R (main structure and quick levels), a customizable maximum number of lines, adjustable colors, and a clean chart display for clearer price action analysis.
FREE
The Sessions and Bar Time indicator is a professional utility tool designed to enhance your trading awareness and timing precision on any chart. It combines two key features every trader needs — market session visualization and real-time bar countdown — in one clean, efficient display. Key Features: Candle Countdown Timer – Shows the remaining time before the current candle closes, helping you anticipate new bar formations. Market Session Display – Automatically highlights the four main trading
FREE

The RSI Divergence Indicator is a powerful tool designed to identify potential reversals in the market by spotting discrepancies between the Relative Strength Index (RSI) and price movement. Divergences can be a significant indication of an impending trend change, either from bullish to bearish or vice versa. This indicator is built for making the task of identifying potential trade opportunities more straightforward and efficient.
Features: Automatic Detection: The indicator scans the chart
FREE

Synthetic Reverse Bar is an evolution of Reverse Bar indicator. It is well-known that candlestick patterns work best at higher timeframes (H1, H4). However, candlesticks at such timeframes may form differently at different brokers due to dissimilarities in the terminal time on the single symbol, while the history of quotes on M1 and M5 remains the same! As a result, successful patterns are often not formed at higher timeframes! Synthetic Reverse Bar solves that problem! The indicator works on M5
This indicator is a sophisticated MetaTrader 5 tool that calculates and displays Average Daily Range (ADR) levels on your chart. It draws horizontal lines representing expected price movement ranges based on historical daily volatility, helping traders identify potential daily high and low targets. ADR (Average Daily Range) = The average difference between the daily high and low over a specified period (default: 14 days). Unlike ATR which includes gaps between days, ADR focuses purely on int
FREE

Channels indicator does not repaint as its based on projecting the falling and raising channels. As a trader you need a path to be able to place your buy and sell trades such as: Supply and Demand , Falling & raising channels. Falling and raising channels can be in any time frame and also can be in all time frames at the same time and the price always flows within these channels. Experienced trades will draw the key levels and channels around the time frames. But, they will not be able to draw
FREE

Véritable indicateur de toupie
Il détecte une toupie précise sur le graphique avec un rapport équilibré entre le corps et la hauteur de la mèche, ce qui est la véritable signification de la toupie qui la diffère de Hammers and Doji ou Null Candlestick.
Cet indicateur trace une icône de wingdings au nombre de toupies trouvées sur le graphique.
Les paramètres incluent
Nombre de barres : Pour ajuster la recherche sur le nombre de barres
Couleur de l'icône : changer la couleur de l'icône
Code
FREE

PriceActionMatrix - Assistant de Scalping Multi-Modèles PriceActionMatrix est un indicateur orienté scalping qui détecte et valide automatiquement de multiples modèles d'action sur le prix à court terme. Plutôt que de présenter chaque chandelle comme un signal autonome, l'outil agrège des modèles tels que Pin Bar, Engulfing, Inside Bar, zones de consolidation et mèches de rejet, puis les soumet à des couches de confirmation configurables - vérifications de tendance et des EMA, plage ATR, indica

Les indicateurs de tendance sont l’un des domaines de l’analyse technique utilisés dans le trading sur les marchés financiers.
Indicateur de Angular Trend Lines - détermine de manière exhaustive la direction de la tendance et génère des signaux d'entrée. En plus de lisser la direction moyenne des bougies
Il utilise également l’angle d’inclinaison des lignes de tendance. Le principe de construction des angles de Gann a été pris comme base pour l'angle d'inclinaison.
L'indicateur d'analyse techniq

Il s'agit d'un indicateur clair pour juger des hauts et des bas, et cela fonctionne bien pour le marché oscillant.
Prix promotionnel 49$ → 59$
caractéristiques bon pour juger des hauts et des bas Pas de redessin, pas de dérive Calcul rapide, pas de décalage Mode de rappel riche Plusieurs paramètres et couleurs peuvent être ajustés
paramètre "======== Principal ========" HighLowPeriod1 = 9 HighLowPeriod2 = 60 HighLowPeriod3 = 34 HighLowEMAPeriod = 4 MASignalPeriod = 5 "======== Notifier =====
UZFX SWS {Scalping Winning Signals} Pro v1.0 est un indicateur puissant et sans repeinture développé par Usman Zabir (UZFX LABS) spécialement pour les scalpers, les day traders et les swing traders à la recherche de signaux d'entrée précis sur des marchés en évolution rapide. Idéal pour les traders qui exigent des signaux fiables en temps réel, sans décalage ni fausses repeintures.
MES MEILLEURS DÉLAIS RECOMMANDÉS* : 30 MINUTES ET PLUS. {1H} EST MON PRÉFÉRÉ. ET LES RÉSULTATS SONT ÉPOUSTOUFLANTS

Cet indicateur à plusieurs périodes et à plusieurs symboles recherche les barres à épingles, les étoiles du matin/soir, les engloutissements, les pinces à épiler, les frappes à trois lignes, les barres intérieures, les fanions et les triangles. L'indicateur peut également être utilisé en mode graphique unique. Veuillez en savoir plus sur cette option dans le produit blogue . Combiné à vos propres règles et techniques, cet indicateur vous permettra de créer (ou d'améliorer) votre propre sys

MarketCrack – Whale Detector : S'aligner avec l'argent intelligent MarketCrack – Whale Detector est un indicateur professionnel conçu pour détecter visuellement et de manière anticipée l'activité des grands acteurs du marché, connus sous le nom de « baleines ». Son objectif est d'identifier les moments clés de pression institutionnelle significative, permettant au trader de s'aligner avec la direction de l'argent intelligent et de prendre des décisions stratégiques avec une plus grande confiance

Ritz Area Konsolidasi – Smart Market Compression & Breakout Visualizer
The Ritz Area Konsolidasi indicator intelligently detects and visualizes market consolidation zones — areas where price movement is compressed within a defined range before a potential breakout. By combining adaptive ATR-based volatility analysis with precise range logic, it helps traders identify key accumulation, distribution, or indecision zones in real time. Core Functionality: Dynamic Consolidation Detection
Identifie
FREE

L'indicateur Gann Box est un outil puissant et polyvalent conçu pour aider les traders à identifier et exploiter les niveaux clés du marché. Cet indicateur permet de dessiner un rectangle sur le graphique, qui est automatiquement divisé en plusieurs zones avec des niveaux stratégiques 0, 0.25, 0.50, 075, 1 . Lorsque le prix touche un de ces niveaux, des alertes se déclenchent, offrant ainsi une aide précieuse pour les décisions de trading. Vous savez instantanément l'évolution du marché par ra

Full Description Overview Drawdown Controller Calculator Indicator is an advanced professional risk-management tool for MetaTrader 5 , specially designed for traders who use multiple running trades, pending orders, grid systems, and martingale strategies . This indicator allows you to see the future drawdown in advance — not only for currently running trades, but also for all pending orders combined , assuming they get triggered step by step. Instead of guessing or hoping, you will know ex
FREE
Découvrez comment acheter un robot de trading sur le MetaTrader Market, le magasin d'applications de la plateforme MetaTrader.
e système de paiement de MQL5.community prend en charge les transactions via PayPal, les cartes bancaires et les systèmes de paiement populaires. Nous vous recommandons vivement de tester le robot de trading avant de l'acheter, pour une meilleure expérience client.
Vous manquez des opportunités de trading :
- Applications de trading gratuites
- Plus de 8 000 signaux à copier
- Actualités économiques pour explorer les marchés financiers
Inscription
Se connecter
Si vous n'avez pas de compte, veuillez vous inscrire
Autorisez l'utilisation de cookies pour vous connecter au site Web MQL5.com.
Veuillez activer les paramètres nécessaires dans votre navigateur, sinon vous ne pourrez pas vous connecter.