DYJ TradingView

5
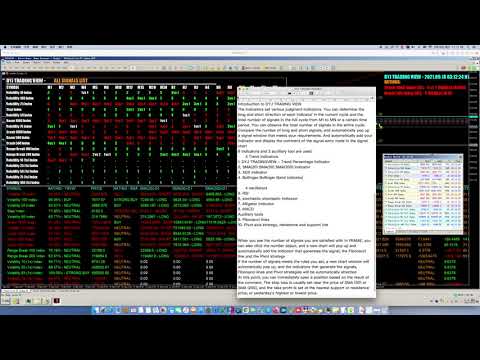
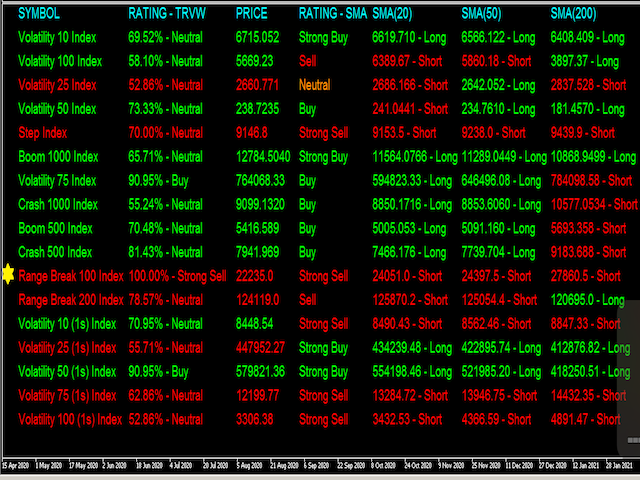
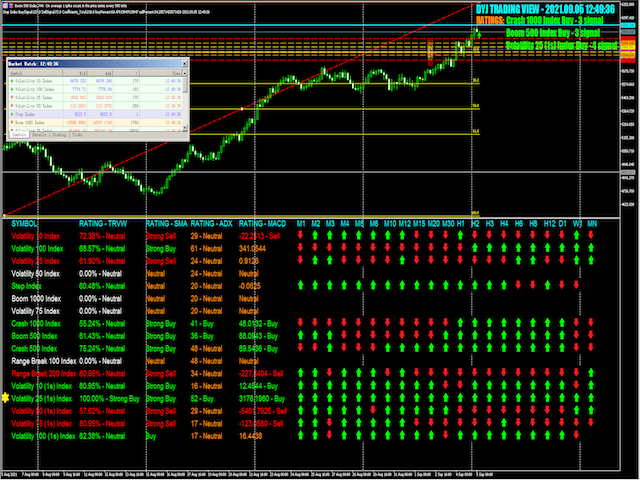
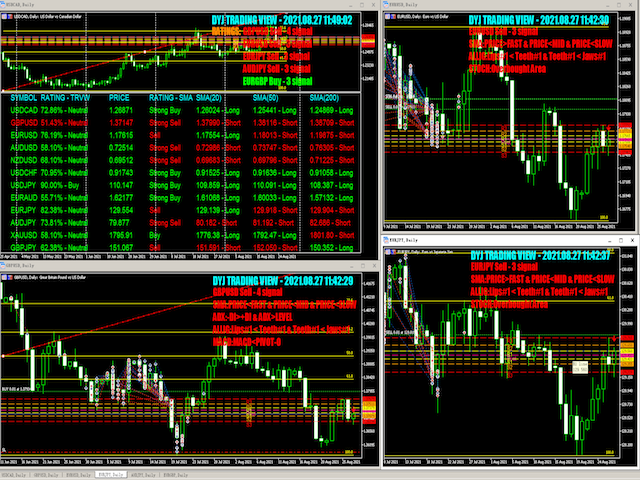
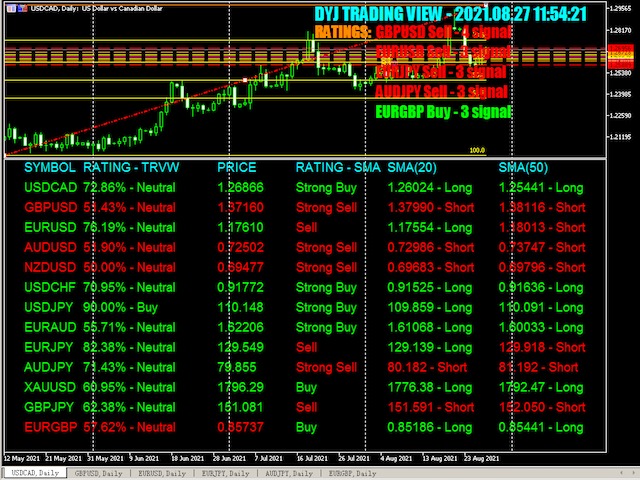
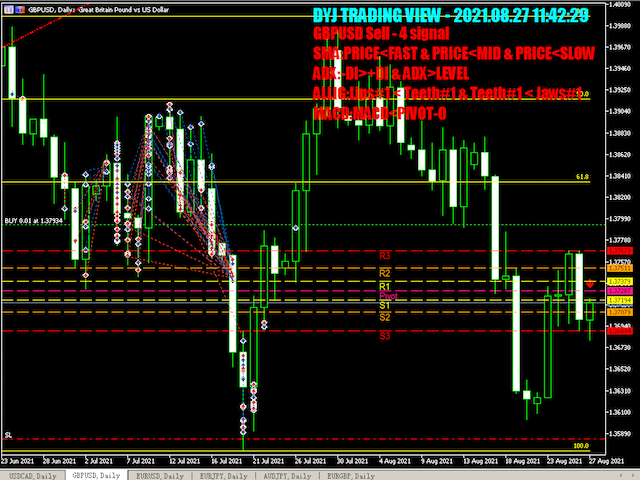
DYJ TRADINGVIEW est un système de notation multi-indicateurs, utilisant le décompte des signaux de notation et des outils d'analyse pour trouver des opportunités d'entrée sur les marchés mondiaux

DYJ TRADINGVIEW dispose de 10 indicateurs intégrés pour l'analyse du marché.

L'analyse basée sur des indicateurs est utilisée par de nombreux commerçants pour les aider à prendre des décisions sur les transactions à prendre et où les entrer et les sortir.

Nous utilisons plusieurs types différents qui peuvent bien se compléter.

Utilisez-nous pour suivre votre marché, vous pouvez trouver des transactions plus précises.

Les indicateurs de tendance participant à la notation comprennent DYJ POWERSIGNAL, ADX, SMA, Bollinger Bands.

Les oscillateurs participant à la notation incluent MACD, RSI, Stochastic, Alligator.

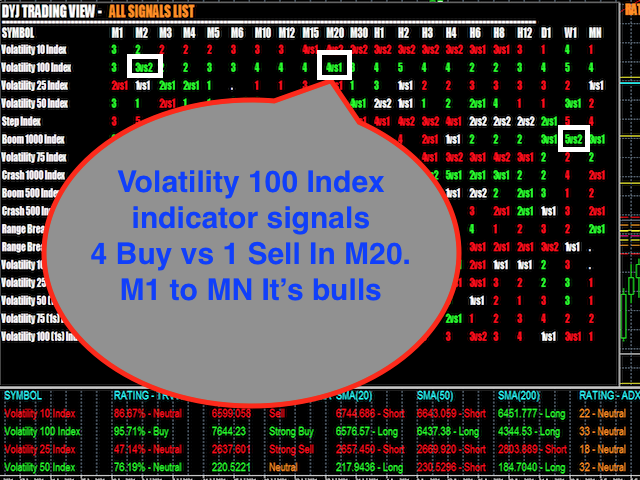
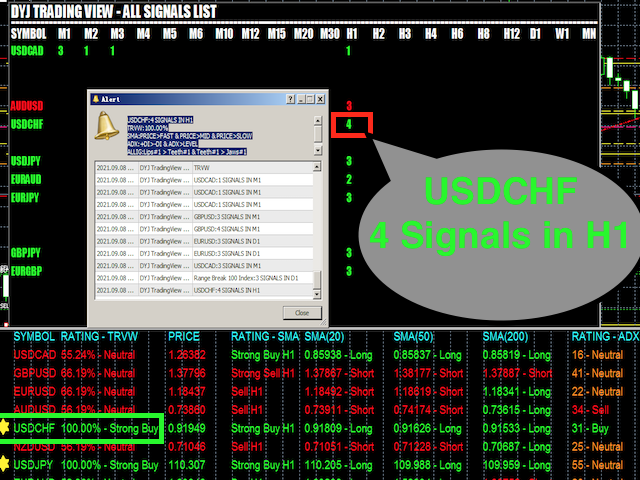
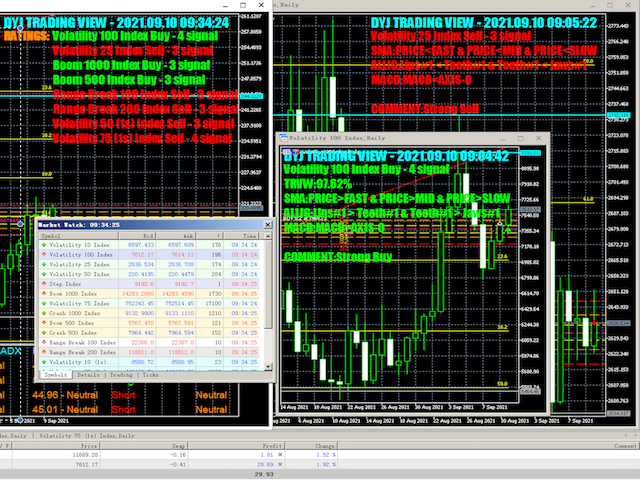
Lorsqu'il y a 3 indicateurs montrant la même direction pour acheter ou vendre des signaux lorsque le nombre de signaux est supérieur ou égal à 3, nous commençons à entrer dans la transaction de marché.

Input

[GENERAL]

  • ViewName           =  "DYJ TRADING VIEW"  --> Company Name.
  • InpIsDisplayPrice  = true  -->  Display Price.
  • InpPriceShiftBars  = 1  -->  Price Shift Bars
  • InpMaxTrendeds   =  3 --> Signals is greater than InpMaxTrendeds, rating symbol .

[TRADINGVIEW]   

  • InpPowerSignalMinPercent   =  90 --> TradeingView Minimum Percent
  • InpPowerSignalStrongPercent   =  100 --> TradeingView Strong Percent
  • InpPowerSignalMaxPercent   =  100 --> TradeingView Maximum Percent
  • InpHiddenPeriodTrend       =  false   --> Hide M1 to MN

[CANDLE]

  • InpUseCandle =  true -->  Use Candle.
  • InpEntryUpper           =  33 --> Spread Multiple,It's Buy Entryies    
  • InpEntryLower           =  33 --> Spread Multiple,It's Sell  Entryies  

[MA]

  • InpUseMA=true;
  • InpIsDisplayFastMA=true  -->  DisplayFastMA
  • InpIsDisplayMidMA=true  --> Display MidMA
  • InpIsDisplaySlowMA=true  --> Display SlowMA
  • InpMAFastPeriod=20        --> Fast Period
  • InpMAMidPeriod=50       -->  Mid Period
  • InpMASlowPeriod=200     -->  Slow Period

[ADX] 

  • InpUseAdx=true --> Use ADX
  • InpIsDisplayPlusdi=false;  -->  Display ADX Plusdi
  • InpIsDisplayMinusdi=false --> Display ADX Minusdi
  • InpAdxPeriod               = 14 -- ADX:  Averaging period 
  • InpTrendLevel              = 30 -- ADX:  Trend Level 

[RSI]

  • InpUseRsi  =true --> Use RSI
  • InpRSIPeriod               =  14  -->  RSI Period
  • InpRsiOversold            =  30       --> R si Oversold
  • InpRsiOverbought        =  70 -->  Rsi Overbought

[BOLLINGER] 

  • InpUseBollinger   =  true  -->  Use Bollinger
  • InpIsDisplayUpper=true
  • InpIsDisplaylower=true
  • Inp_Bands_bands_period                 = 20 -- Bollinger bands period
  • Inp_Bands_deviation                    = 2 -- Bollinger bands deviations
  • InpBandDistance                        = 50 -- BandDistance,in points   

[MACD]

  • InpUseMACD   =  true -->  Use MACD
  • InpIsDisplayMacdSignal=false -->  Display MacdSignal
  • InpMacdFast                = 12 -->  MacdFast
  • InpMacdSlow                = 26 -->  MacdSlow
  • InpMacdSignal              = 9 -->  MacdSignal
  • InpMacdPriceField          = PRICE_CLOSE -->  macd calculation method 
  • InpMACDOpenLevel           = 3 -->  MACD Open Level
  • InpMACDCloseLevel          = 2 -->  MACD Close Level

[MACD MA TREND]

  • InpMacdMA                  = 26  -->  MA Period
  • InpMacdMAMethod            = MODE_EMA -->  type of smoothing macdma
  • InpMacdMAPriceField        = PRICE_CLOSE -->  macd calculation method 

[STOCHASTIC]

  • InpUseStochastic        =  true  --> Use Stochastic
  • InpSTOKperiod              = 5 --> K-period 
  • InpSTODperiod              = 3 --> D-period 
  • InpSTOSlowing              = 3 -->  slowing-period    
  • InpSTOMaMethod             = MODE_EMA -->  type of smoothing stochastic
  • InpSTOPriceField           = STO_LOWHIGH -->  stochastic calculation method 
  • InpOversoldArea            = 20 --> stoch oversold zone
  • InpOverboughtArea          = 80 -->  stoch overbought zone 

[ALLIGATOR]

  • Inp_jaw_period    = 13 -->  period for the calculation of jaws 
  • Inp_jaw_shift     = 8 --> horizontal shift of jaws 
  • Inp_teeth_period  = 8 -->  period for the calculation of teeth 
  • Inp_teeth_shift   = 5 -->  horizontal shift of teeth 
  • Inp_lips_period   = 5 -->  period for the calculation of lips 
  • Inp_lips_shift    = 3 -->  horizontal shift of lips 
  • Inp_ma_method     = MODE_EMA -->  type of smoothing 
  • Inp_applied_price = PRICE_MEDIAN  -->  type of price 

[PIVOT]

  • InpUsePivot = true;  
  • InpCalculationMode =  FIBONACCI_RETRACEMENT    -->   FIBONACCI RETRACEMENT 

[FIBONACCI]

  • InpUseFibonacci = true; 
  • InpFibDate1=1 -->  1 st point's date, % 
  • InpFibPrice1=1 -->  1 st point's price, % 
  • InpFibDate2=100 -->  2 nd point's date, % 
  • InpFibPrice2=100 -->  2 nd point's price, % 

[Panel]

  • InpLanguage              = English --> English or Chinese


Avis 1
Marion Lancaster Dicaprio
244
Marion Lancaster Dicaprio 2021.09.07 07:21 
 

I highly recommended Dyj global for their products and customer's services. I sincerely think they are the best in the industry they will go above an beyond to make sure you get the best trading results. I have been using this service for approximately one year.

Produits recommandés
Crash 1000 Scalping Indicator for the Crash 1000 Deriv Synthetic Index. Introduction The Crash 1000 Scalping Indicator is a specialized tool designed for the Crash 1000 index on the Deriv Synthetic market. This indicator is particularly useful for scalping on the M1 timeframe, helping traders to identify precise entry and exit points for buy positions. It is designed to be non-repainting, providing clear signals with audible alerts and push notifications, and is compatible with mobile devices th
STRICTLY FOR BOOM INDEX ONLY!!!!! Here I bring the Maximum Trend Arrows OT1.0 MT5 indicator. This indicator is made up of a combination of different trend indicators for entries and exits, for entries an orange arrow will paint on the chart below the current market and a red flag for closing of trades and it produces buy arrows only. When the orange arrow appears, it will appear along with it's sound to notify you. The 1H timeframe is recommended, don't use it anywhere else than on the 1H timefr
Identify precise entry and exit points with AB=CD patterns This indicator finds AB=CD retracement patterns. The AB=CD Retracement pattern is a 4-point price structure where the initial price segment is partially retraced and followed by an equidistant move from the completion of the pullback, and is the basic foundation for all harmonic patterns. [ Installation Guide | Update Guide | Troubleshooting | FAQ | All Products ] Customizable pattern sizes Customizable AC and BD ratios Customizable b
Magic Finger can help you identify trends and trading opportunities clearly. The finger points to the open position signal, and the discoloration line is confirmed by the trend. If you are a day trader, you can choose to trade during a period of active trading, referring to the discoloration line as the basis for the next order, finger signal as a filter. If you are a trend trader, you can choose a period above H1, wait for the appearance of the finger signal in the key price area, and enter th
Owl Smart Levels MT5
Sergey Ermolov
4.07 (30)
Version MT4   |  FAQ L' indicateur Owl Smart Levels est un système de trading complet au sein d'un seul indicateur qui comprend des outils d'analyse de marché populaires tels que les fractales avancées de Bill Williams , Valable ZigZag qui construit la structure d'onde correcte du marché et les niveaux de Fibonacci qui marquent les niveaux exacts d'entrée. sur le marché et les endroits où prendre des bénéfices. Description détaillée de la stratégie Mode d'emploi de l'indicateur Conseiller-Assis
Mac-Binary option Signals is unique mathematical concept to trade iqoptions,binary,rocketoptions specter or any other binary options company 1 min 5 expiry run robot 30min everyday and fill profit and loss ratios inside mt2iq/mt2binary and run or 1min to 5min expiry ...go to setting in mt2iq robot allow otc and digital options. and select risk 500and profit 300$ per day it can stop automatically after profit or loss... If it can close after loss restart and Reset profit and loss button run again
Noize Absorption Index - is the manual trading system that measures the difference of pressure between bears forces and bulls forces. Green line - is a noize free index that showing curent situation. Zero value of index shows totally choppy/flat market.Values above zero level shows how powerfull bullish wave is and values below zero measures bearish forces.Up arrow appears on bearish market when it's ready to reverse, dn arrow appears on weak bullish market, as a result of reverse expectation.
Atomic Analyst MT5
Issam Kassas
4.14 (21)
Tout d'abord, il convient de souligner que cet indicateur de trading n'est ni repainting, ni redrawing et ne présente aucun délai, ce qui le rend idéal à la fois pour le trading manuel et automatisé. Manuel de l'utilisateur : réglages, entrées et stratégie. L'Analyste Atomique est un indicateur d'action sur les prix PA qui utilise la force et le momentum du prix pour trouver un meilleur avantage sur le marché. Équipé de filtres avancés qui aident à éliminer les bruits et les faux signaux, et à
Le niveau Premium est un indicateur unique avec une précision de plus de 80 % des prédictions correctes ! Cet indicateur a été testé par les meilleurs Trading Specialists depuis plus de deux mois ! L'indicateur de l'auteur que vous ne trouverez nulle part ailleurs ! À partir des captures d'écran, vous pouvez constater par vous-même la précision de cet outil ! 1 est idéal pour le trading d'options binaires avec un délai d'expiration de 1 bougie. 2 fonctionne sur toutes les paires de devises
ATrend
Zaha Feiz
4.82 (17)
ATREND ATREND : Comment ça fonctionne et comment l'utiliser Comment ça fonctionne L'indicateur "ATREND" pour la plateforme MT5 est conçu pour fournir aux traders des signaux d'achat et de vente robustes en utilisant une combinaison de méthodologies d'analyse technique. Cet indicateur s'appuie principalement sur la plage vraie moyenne (ATR) pour mesurer la volatilité, ainsi que sur des algorithmes de détection de tendance pour identifier les mouvements potentiels du marché. Laissez un message ap
Banana Binary MT5 Signal
Nirundorn Promphao
1 (1)
Promotion $66 lifetime for you. The principle of this indicator is very simple: detecting the trend with Moving Average, then monitoring the return point of graph by using the crossing of Stochastic Oscillator and finally predicting BUY and SELL signal with arrows, alerts and notifications. The parameters are fixed and automatically calculated on each time frame. Example: If you install indicator on EURUSD, timeframe M5: the indicator will detect the main trend with the Moving Average on this ti
Double HMA MTF for MT5
Pavel Zamoshnikov
4 (4)
This is an advanced multi-timeframe version of the popular Hull Moving Average (HMA) Features Two lines of the Hull indicator of different timeframes on the same chart. The HMA line of the higher timeframe defines the trend, and the HMA line of the current timeframe defines the short-term price movements. A graphical panel with HMA indicator data from all timeframes at the same time . If the HMA switched its direction on any timeframe, the panel displays a question or exclamation mark with a tex
VisualVol
Maxim Kuznetsov
The indicator highlights the points that a professional trader sees in ordinary indicators. VisualVol visually displays different volatility indicators on a single scale and a common align. Highlights the excess of volume indicators in color. At the same time, Tick and Real Volume, Actual range, ATR, candle size and return (open-close difference) can be displayed. Thanks to VisualVol, you will see the market periods and the right time for different trading operations. The indicator displays: T
Wave Trend MT5
Diego Arribas Lopez
MT4 Version Wave Trend MT5 Wave Trend is an oscillator, which helps identifing in a extremely accurate manner market reversals. The Oscillator being obove the overbought level and a cross down of the fast into the slow MA usually indicates a good SELL signal. If the oscillators is below the oversold level and the fast MA crosses over the slower MA usually highlights a good BUY signal. The Wave Trend indicator can be also used when divergences appear against the price, indicating the current move
Introduction to the Manual Backtesting Indicator on MQL5 The MetaTrader platform provides an excellent backtesting tool for evaluating Expert Advisors (EAs). However, when it comes to manually backtesting a strategy to assess its effectiveness, this tool has some limitations: You cannot manually draw zones or trend lines while in backtesting mode. You cannot switch timeframes to check time alignment. For example, if my strategy requires additional confirmation from a higher timeframe (HTF), this
Fibaction
Abdelkhalek Orabi
Indicator Name: Fibaction – price action candle Detector Description: Fibo Signal Boxes is a powerful Smart Money Concept (SMC)-inspired indicator that auto-detects price action candles. bullish hammers and shooting stars, then draws precise Fibonacci entry zones and multiple take-profit levels directly on the chart. as for the SL personally i use 40 pips rules  Key Features: Detects bullish hammer and shooting star reversal candles. Automatically draws Fibonacci entry and TP boxes. as
Your Trend Friend
Luigi Nunes Labigalini
5 (1)
The trend is your friend! Look at the color of the indicator and trade on that direction. It does not  repaint. After each candle is closed, that's the color of the trend. You can focus on shorter faster trends or major trends, just test what's most suitable for the symbol and timeframe you trade. Simply change the "Length" parameter and the indicator will automatically adapt. You can also change the color, thickness and style of the lines. Download and give it a try! There are big movements w
Visual CrossPulse Dynamics Indicator
AL MOOSAWI ABDULLAH JAFFER BAQER
Visual CrossPulse Dynamics: Trade with the Market's True Rhythm Unlock a new level of market insight with Visual CrossPulse Dynamics, a sophisticated trading indicator designed to adapt to ever-changing volatility and reveal the true direction of the trend. Are you tired of indicators that lag in fast-moving markets or give false signals during consolidation? The Visual CrossPulse Dynamics indicator solves this problem by using an advanced, adaptive algorithm that intelligently adjusts to the m
This trading indicator is non-repainting, non-redrawing, and non-lagging, making it an ideal choice for both manual and automated trading. It is a Price Action–based system that leverages price strength and momentum to give traders a real edge in the market. With advanced filtering techniques to eliminate noise and false signals, it enhances trading accuracy and potential. By combining multiple layers of sophisticated algorithms, the indicator scans the chart in real-time and translates comple
ETE Detector v4.0 (Head & Shoulders) Auteur : KOUAME N’DA LEMISSA Version : 4.0 Plateforme : MetaTrader 5 Type d’indicateur : Graphique / Signaux de trading visuels Description générale L’ ETE Detector v4.0 est un indicateur technique conçu pour identifier automatiquement les figures chartistes “Épaule-Tête-Épaule” (ETE) classiques et inversées sur les graphiques MT5. Ces motifs sont largement utilisés pour anticiper les retournements de tendance. Grâce à cet outil, les traders peuvent : Détecte
Trade smarter, not harder: Empower your trading with Harmonacci Patterns This is arguably the most complete harmonic price formation auto-recognition indicator you can find for the MetaTrader Platform. It detects 19 different patterns, takes fibonacci projections as seriously as you do, displays the Potential Reversal Zone (PRZ) and finds suitable stop-loss and take-profit levels. [ Installation Guide | Update Guide | Troubleshooting | FAQ | All Products ] It detects 19 different harmonic pri
Indicateur unique qui met en œuvre une approche professionnelle et quantitative pour signifier le trading de réversion. Il capitalise sur le fait que le prix dévie et revient à la moyenne de manière prévisible et mesurable, ce qui permet des règles d'entrée et de sortie claires qui surpassent largement les stratégies de trading non quantitatives. [ Installation Guide | Update Guide | Troubleshooting | FAQ | All Products ] Des signaux de trading clairs Étonnamment facile à échanger Couleurs et t
PipFinite Exit EDGE MT5
Karlo Wilson Vendiola
4.86 (29)
Did You Have A Profitable Trade But Suddenly Reversed? In a solid strategy, exiting a trade is equally important as entering. Exit EDGE helps maximize your current trade profit and avoid turning winning trades to losers. Never Miss An Exit Signal Again Monitor all pairs and timeframes in just 1 chart www.mql5.com/en/blogs/post/726558 How To Trade You can close your open trades as soon as you receive a signal Close your Buy orders if you receive an Exit Buy Signal. Close your Sell orders if
Apex WilliamsR MT5 Description Apex Williams %R MT5 is a professional technical indicator that enhances the traditional Williams %R oscillator with advanced momentum analysis and multiple quality filters. Key Features Intelligent Signal System - Automatic buy/sell signal generation - Quality filters to reduce false signals - Clear visual indicators on chart Advanced Divergence Analysis - Automatic divergence detection - Integrated price-oscillator analysis - Technical signal confirmation
**   All Symbols   x   All Timeframes   scan just by pressing scanner button ** Discount: The price is $50$, But now it is just $35, Limited time offer is active. *** Contact me  to send you instruction and add you in "Trend Reversal group" for sharing or seeing experiences with other users. Introduction: Trendlines are the most famous technical analysis in trading . Trendlines continually form on the charts of markets across all the different timeframes providing huge opportunities for traders
L'indicateur SMC Venom Model BPR est un outil professionnel pour les traders travaillant dans le concept Smart Money (SMC). Il identifie automatiquement deux modèles clés sur le graphique des prix: FVG   (Fair Value Gap) est une combinaison de trois bougies, dans laquelle il y a un écart entre la première et la troisième bougie. Forme une zone entre les niveaux où il n'y a pas de support de volume, ce qui conduit souvent à une correction des prix. BPR   (Balanced Price Range) est une combinaiso
Présentation : Cet indicateur MT5 permet aux traders de suivre facilement le numéro quotidien des bougies. Indicateur Numéro de Bougie Quotidienne pour MT5 L’indicateur Numéro de Bougie Quotidienne affiche le numéro séquentiel de chaque bougie directement sur votre graphique MetaTrader 5. Il aide les traders à suivre le comptage des barres intrajournalières et à analyser facilement les motifs de session. Principales fonctionnalités : Affiche les numéros des bougies sous chaque bougie en temps ré
Trade Filter is a tool designed primarily for traders using many Expert Advisors on the same currency pair and/or grid systems creating many simultaneous trading operations. By adding the filter (as an indicator) to a given chart, must select a magic number of the EA and only its trades remain visible. Numerous settings for colors, line styles, font sizes and others have been added, through which you can adjust the display according to your preferences. Set files also can be created and loaded.
VR Cub MT 5
Vladimir Pastushak
VR Cub est un indicateur permettant d'obtenir des points d'entrée de haute qualité. L'indicateur a été développé pour faciliter les calculs mathématiques et simplifier la recherche de points d'entrée dans un poste. La stratégie de trading pour laquelle l'indicateur a été rédigé prouve son efficacité depuis de nombreuses années. La simplicité de la stratégie de trading est son grand avantage, qui permet même aux traders débutants de négocier avec succès avec elle. VR Cub calcule les points d'ouve
TRI Visualizer
Yoshimi Mon 三 Ura
TRI Visualizer MT5 – Thermodynamic Market Analysis Overview The TRI (Thermal Range Indicator) Visualizer Enhanced is a rare market analysis indicator that goes beyond conventional technical analysis, applying principles of thermodynamics from physics. It interprets market price fluctuations as “thermodynamic energy,” enabling the highly accurate detection of subtle market changes that are often overlooked. Innovative Mechanisms 1. Dual Calculation Engines Classic TRI Mode Formula: |Close
Les acheteurs de ce produit ont également acheté
Divergence Bomber
Ihor Otkydach
4.96 (68)
Chaque acheteur de cet indicateur reçoit également gratuitement : L’outil exclusif « Bomber Utility », qui accompagne automatiquement chaque opération de trading, fixe les niveaux de Stop Loss et de Take Profit, et clôture les positions selon les règles de la stratégie Des fichiers de configuration (set files) pour adapter l’indicateur à différents actifs Des set files pour configurer le Bomber Utility selon différents modes : « Risque Minimum », « Risque Équilibré » et « Stratégie d’Attente » U
ARIPoint
Temirlan Kdyrkhan
ARIPoint is a powerful trading companion designed to generate high-probability entry signals with dynamic TP/SL/DP levels based on volatility. Built-in performance tracking shows win/loss stats, PP1/PP2 hits, and success rates all updated live. Key Features: Buy/Sell signals with adaptive volatility bands Real-time TP/SL/DP levels based on ATR Built-in MA Filter with optional ATR/StdDev volatility Performance stats panel (Success, Profit/Loss, PP1/PP2) Alerts via popup, sound, push, or email Cu
Grabber System MT5
Ihor Otkydach
5 (18)
Je vous présente un excellent indicateur technique : Grabber, qui fonctionne comme une stratégie de trading "tout-en-un", prête à l'emploi. En un seul code sont intégrés des outils puissants d'analyse technique du marché, des signaux de trading (flèches), des fonctions d'alerte et des notifications push. Chaque acheteur de cet indicateur reçoit également gratuitement : L'utilitaire Grabber : pour la gestion automatique des ordres ouverts Un guide vidéo étape par étape : pour apprendre à installe
RelicusRoad Pro MT5
Relicus LLC
4.83 (23)
Combien de fois avez-vous acheté un indicateur de trading avec d' excellents backtests, des preuves de performance sur compte réel avec des chiffres fantastiques et des statistiques partout , mais après l'avoir utilisé, vous finissez par faire sauter votre compte ? Vous ne devriez pas faire confiance à un signal seul, vous devez savoir pourquoi il est apparu en premier lieu, et c'est ce que RelicusRoad Pro fait de mieux ! Manuel d'utilisation + Stratégies + Vidéos de formation + Groupe privé ave
Obtenez l’indicateur AUX GRATUIT et le support EA   Téléchargement direct — Cliquez ici [ D.I.C.E ] Divergence in Chaos Environment est un outil MT5 spécialisé conçu pour les traders appliquant la théorie des vagues d’Elliott dans le cadre des techniques de Trading Chaos. Il identifie les divergences cachées et régulières du prix, synchronisées avec l’environnement de marché chaotique décrit par Bill Williams. Caractéristiques clés Divergence alignée sur les vagues d’Elliott : détecte les diver
FX Power MT5 NG
Daniel Stein
5 (23)
FX Power : Analysez la force des devises pour des décisions de trading plus intelligentes Aperçu FX Power est l'outil essentiel pour comprendre la force réelle des principales devises et de l'or, quelles que soient les conditions du marché. En identifiant les devises fortes à acheter et les faibles à vendre, FX Power simplifie vos décisions de trading et révèle des opportunités à forte probabilité. Que vous suiviez les tendances ou anticipiez les retournements à l'aide de valeurs extrêmes de D
Trend Forecaster
Alexey Minkov
5 (7)
The Trend Forecaster indicator utilizes a unique proprietary algorithm to determine entry points for a breakout trading strategy. The indicator identifies price clusters, analyzes price movement near levels, and provides a signal when the price breaks through a level. The Trend Forecaster indicator is suitable for all financial assets, including currencies (Forex), metals, stocks, indices, and cryptocurrencies. You can also adjust the indicator to work on any time frames, although it is recommen
FX Volume MT5
Daniel Stein
4.86 (21)
FX Volume : Découvrez le Sentiment du Marché tel que perçu par un Courtier Présentation Rapide Vous souhaitez faire passer votre approche de trading au niveau supérieur ? FX Volume vous fournit, en temps réel, des informations sur la manière dont les traders particuliers et les courtiers sont positionnés—bien avant la publication de rapports retardés comme le COT. Que vous visiez des gains réguliers ou recherchiez simplement un avantage plus solide sur les marchés, FX Volume vous aide à repére
ACB Breakout Arrows MT5
KEENBASE SOFTWARE SOLUTIONS
5 (1)
L’indicateur ACB Breakout Arrows fournit un signal d’entrée crucial sur le marché en détectant un modèle de rupture spécifique. Il analyse en continu le graphique à la recherche d’un momentum établi dans une direction et déclenche un signal précis juste avant le mouvement principal. Obtenez le scanner multi-actifs et multi-unités de temps ici - Scanner pour ACB Breakout Arrows MT5 Fonctionnalités principales Les niveaux de Stop Loss et Take Profit sont fournis par l’indicateur. Inclut un table
Quantum Trend Sniper
Bogdan Ion Puscasu
4.73 (51)
Présentation       Quantum Trend Sniper Indicator   , l'indicateur révolutionnaire MQL5 qui transforme la façon dont vous identifiez et négociez les inversions de tendance ! Développé par une équipe de traders expérimentés avec une expérience commerciale de plus de 13 ans,       Indicateur Quantum Trend Sniper       est conçu pour propulser votre parcours de trading vers de nouveaux sommets grâce à sa manière innovante d'identifier les inversions de tendance avec une précision extrêmement élevée
Berma Bands
Muhammad Elbermawi
5 (7)
L'indicateur Berma Bands (BB) est un outil précieux pour les traders qui cherchent à identifier et à capitaliser sur les tendances du marché. En analysant la relation entre le prix et les BB, les traders peuvent déterminer si un marché est dans une phase de tendance ou de range. Visitez le [ Berma Home Blog ] pour en savoir plus. Les bandes de Berma sont composées de trois lignes distinctes : la bande de Berma supérieure, la bande de Berma moyenne et la bande de Berma inférieure. Ces lignes sont
TPSproTREND PrO MT5
Roman Podpora
4.72 (18)
VERSION MT4        —        ИНСТРУКЦИЯ RUS           —        INSTRUCTIONS  ENG Fonctions principales : Signaux d'entrée précis SANS RENDU ! Si un signal apparaît, il reste d’actualité ! Il s'agit d'une différence importante par rapport aux indicateurs de redessinage, qui peuvent fournir un signal puis le modifier, ce qui peut entraîner une perte de fonds en dépôt. Vous pouvez désormais entrer sur le marché avec plus de probabilité et de précision. Il existe également une fonction de coloration
AriX
Temirlan Kdyrkhan
1 (3)
AriX Indicator for MT5 A powerful trend-following and signal-evaluation tool AriX is a custom MT5 indicator that combines Moving Averages and ATR-based risk/reward logic to generate clear buy/sell signals. It visualizes dynamic SL/TP levels, evaluates past trade outcomes, and displays win/loss statistics in a clean on-chart panel. Key features include: Buy/Sell signals based on MA crossovers ATR-based SL/TP1/TP2/TP3 levels with visual lines and labels Signal outcome tracking with real-time stat
MetaForecast M5
Vahidreza Heidar Gholami
5 (3)
MetaForecast prédit et visualise l'avenir de n'importe quel marché en se basant sur les harmoniques des données de prix. Bien que le marché ne soit pas toujours prévisible, s'il y a un motif dans les prix, MetaForecast peut prédire l'avenir aussi précisément que possible. Comparé à d'autres produits similaires, MetaForecast peut générer des résultats plus précis en analysant les tendances du marché. Paramètres d'entrée Past size (Taille passée) Spécifie le nombre de barres que MetaForecast util
Ce tableau de bord découvre et affiche les zones   d'offre   et de   demande   sur le graphique, à la fois en mode scalping et à long terme, en fonction de votre stratégie de trading pour les symboles sélectionnés. En outre, le mode scanner du tableau de bord vous permet de vérifier tous les symboles souhaités en un coup d'œil et de ne manquer aucune position appropriée /   Version MT4 Indicateur gratuit:   Basic Supply Demand Caractéristiques Permet de visualiser les opportunités de tradin
Top indicator for MT5   providing accurate signals to enter a trade without repainting! It can be applied to any financial assets:   forex, cryptocurrencies, metals, stocks, indices .  Watch  the video  (6:22) with an example of processing only one signal that paid off the indicator! MT4 version is here It will provide pretty accurate trading signals and tell you when it's best to open a trade and close it. Most traders improve their trading results during the first trading week with the help of
Gold Sniper Scalper Pro: Entrée Avancée et Gestion des Risques Ceci est la version mise à jour de Gold Sniper Scalper Pro. Elle conserve les principales fonctionnalités à succès et inclut de nouveaux ajouts qui améliorent la flexibilité, la sécurité et l'efficacité dans le trading du XAUUSD. Caractéristiques Clés et Améliorations 1. Système d'Entrée Flexible: Modes de Signal Doubles L'indicateur propose désormais deux modes distincts de génération de signaux, offrant plus de contrôle sur l'init
TPSpro RFI Levels MT5
Roman Podpora
4.53 (19)
Zones de retournement - niveaux / Zones actives d'un acteur majeur INSTRUCTIONS RUS   /   INSTRUCTIONS   ENG   /   Version MT4 CHAQUE ACHETEUR DE CET INDICATEUR       OBTENEZ EN PLUS   GRATUITEMENT   : 3 mois       accès aux signaux de trading du service       SUPER SIGNAUX       — points d’entrée prêts à l’emploi selon l’algorithme TPSproSYSTEM. 3 mois       accès à des supports de formation avec des mises à jour régulières - immersion dans la stratégie et la croissance professionnelle. Assist
PZ Trend Trading MT5
PZ TRADING SLU
3.8 (5)
Capture every opportunity: your go-to indicator for profitable trend trading Trend Trading is an indicator designed to profit as much as possible from trends taking place in the market, by timing pullbacks and breakouts. It finds trading opportunities by analyzing what the price is doing during established trends. [ Installation Guide | Update Guide | Troubleshooting | FAQ | All Products ] Trade financial markets with confidence and efficiency Profit from established trends without getting whip
Ce tableau de bord affiche les derniers   modèles harmoniques   disponibles pour les symboles sélectionnés, ce qui vous permettra de gagner du temps et d'être plus efficace /   version MT4 . Indicateur gratuit:   Basic Harmonic Pattern Colonnes de l'indicateur Symbol :   les symboles sélectionnés apparaissent Trend   :   haussière ou baissière Pattern :   type de motif (gartley, papillon, chauve-souris, crabe, requin, cypher ou ABCD) Entry:   prix d'entrée SL:   prix du stop loss TP1:   1er
Golden Spike Premium
Kwaku Bondzie Ghartey
5 (1)
Golden Spikes Indicator Technical indicator for synthetic indices trading on M1 timeframe. Compatible with Boom/Crash indices on Deriv platform and Gain/Pain indices on Weltrade platform. send me A private  message to receive trade ASISTANT EA.. booklet guide:  https://drive.google.com/file/d/1knQJqGHZSP5eQN24ndRz2ayZVCst6XhN/view?usp=sharing Also check my premium spikes bot: https://www.mql5.com/en/market/product/142350 Features Uses Parabolic SAR, RSI, and Bollinger Bands analysis Three risk
Introducing the South African Sniper indicator created by a small group of traders with a few years trading trading the financial market profitably . This is a plug and play indicator that provides you with  BUY and SELL (SNIPER ENTRY) signals with TARGET and trail stops. The indicator Works with all MT5 trading instruments. The indicator uses previous  chart data as receipt to speculate on future market moves.  "The South African Sniper indicator community are very happy with the indicator and
Elliott Wave Trend was designed for the scientific wave counting. This tool focuses to get rid of the vagueness of the classic Elliott Wave Counting using the guideline from the template and pattern approach. In doing so, firstly Elliott Wave Trend offers the template for your wave counting. Secondly, it offers Wave Structural Score to assist to identify accurate wave formation. It offers both impulse wave Structural Score and corrective wave Structure Score. Structural Score is the rating to sh
Unlock key market insights with automated support and resistance lines Tired of plotting support and resistance lines? This is a multi-timeframe indicator that detects and plots supports and resistance lines in the chart with the same precision as a human eye would. As price levels are tested over time and its importance increases, the lines become thicker and darker, making price leves easy to glance and evaluate. [ Installation Guide | Update Guide | Troubleshooting | FAQ | All Products ] Boos
Trend Hunter MT5
Andrey Tatarinov
5 (2)
Trend Hunter est un indicateur de tendance pour travailler sur les marchés du Forex, des cryptomonnaies et des CFD. Une particularité de l'indicateur est qu'il suit la tendance avec confiance, sans changer le signal lorsque le prix dépasse légèrement la ligne de tendance. L'indicateur n'est pas redessiné; un signal d'entrée sur le marché apparaît après la fermeture de la barre. Lorsque vous suivez une tendance, l'indicateur affiche des points d'entrée supplémentaires dans la direction de la te
Kecia Footprint Orderflow
Niccolo Filippo Palombi
3.67 (3)
if you want to test it : private message me ( MT5 demo testing doesn't work ) Designed to help traders gain a deeper understanding of the market’s true order flow dynamics . By visualizing the “ footprints ” left by candles, this indicator reveals how the delta ( the difference between buying and selling pressure ) changes during the candle formation, as well as how volume fluctuates at different price levels. These insights are essential for traders seeking to identify reversals, breakouts, and
Royal Scalping Indicator M5
Vahidreza Heidar Gholami
5 (6)
Royal Scalping Indicator is an advanced price adaptive indicator designed to generate high-quality trading signals. Built-in multi-timeframe and multi-currency capabilities make it even more powerful to have configurations based on different symbols and timeframes. This indicator is perfect for scalp trades as well as swing trades. Royal Scalping is not just an indicator, but a trading strategy itself. Features Price Adaptive Trend Detector Algorithm Multi-Timeframe and Multi-Currency Trend Low
THE 4 GUARDIANS OF PROFIT BANKER 1.     LEVEL 3 POWER INDICATOR (The General) · Identifies MAJOR market turning points · Filters out noise and minor fluctuations · Only acts on significant high/low points 2.     ZIGZAG FRACTALS (The Confirmer) · Validates the Level 3 signals · Ensures swing point authenticity · Adds second-layer confirmation 3.     BOLLINGER BANDS (The Boundaries) · Identifies overextended price levels · Provides natural support/resistance zones · Ensures entries at op
Was: $249  Now: $149   Market Profile defines a number of day types that can help the trader to determine market behaviour. A key feature is the Value Area, representing the range of price action where 70% of trading took place. Understanding the Value Area can give traders valuable insight into market direction and establish the higher odds trade. It is an excellent addition to any system you may be using. Inspired by Jim Dalton’s book “Mind Over Markets”, this indicator is designed to suit the
Blahtech Supply Demand MT5
Blahtech Limited
4.54 (13)
Was: $299  Now: $149  Supply Demand uses previous price action to identify potential imbalances between buyers and sellers. The key is to identify the better odds zones, not just the untouched ones. Blahtech Supply Demand indicator delivers functionality previously unavailable on any trading platform. This 4-in-1 indicator not only highlights the higher probability zones using a multi-criteria strength engine, but also combines it with multi-timeframe trend analysis, previously confirmed swings
Plus de l'auteur
DYJ WITHDRAWAL PLAN : Système de Trading sur Renversement de Tendance 1. Qu'est-ce que DYJ WITHDRAWAL PLAN ? DYJ WITHDRAWAL PLAN   est un   système de trading intelligent basé sur le renversement de tendance , conçu pour   ouvrir et clôturer automatiquement les positions   lorsque le marché change de direction. Ce système est   compatible avec tous les instruments financiers et tous les courtiers , qu'il s'agisse de   Forex   ou d' Indices Synthétiques , il s'adapte facilement à tous types de
QuickClose: Instant Order Management Made Simple QuickClose   allows you to instantly close all orders with a single click. It operates at high speed, giving you the flexibility to close orders for a specific symbol or all symbols at once. This makes trade management significantly faster and more efficient. This   Expert Advisor can swiftly close all buy and sell orders either for a selected symbol or across all trades. The   SymbolButton is specifically designed for order closure, featuring bo
Professional traders know that a reversal in market price is the best entry points to trade. The trend changes K line state changes the most obvious. The SoarSignal is good to identify these changes, because we have incorporated the KDJ indicators. It is the closest to the K line state of the indicators. The two lines of KDJ Winner move within a range of 0 and 100. Values above 80 are considered to be in overbought territory and indicate that a reversal in price is possible. Values below 20 are
StrongCurrency
Daying Cao
5 (1)
This StrongCurrency is a complete trading system based on a variety of technical indicators, moving averages and pivots. Each of those elements can be assessed in defined rules and coefficients (depending on the indicator) providing limitless optimization scenarios for the StrongCurrency. In order to work the StrongCurrency creates a trend strength and entry point signal list display by evaluating these data, that takes data from all symbols. It extrapolates all the information in order to get t
PowerSignal
Daying Cao
5 (1)
Ce PowerSignal est un système de trading complet basé sur l'ATR d'indicateurs techniques. Ces indicateurs enregistreront l'état actuel de chaque POWERTREND dans chaque période et paire de devises analysées. Le PowerSignal crée un affichage de la force de tendance et de la liste des points d'entrée en évaluant ces données. S'il y a une coïncidence totale sur une paire, une alerte apparaîtra indiquant un tel cas. Les données de liste incluent Symbol, M5-MN1, BuyPercent, SellPercent, LastEntry. Le
This indicator shows the crossing between two moving averages, a slower and faster moving average. Signal show alert pop-up, when MA1 crosses above the MA2. Signal show alert pop-up, when MA1 crosses below the MA2. Inputs Value Fast MA Setup Period = 5 - period of Faster Moving Average (value 5). Mode = SMA - type of Moving Average (SMA, EMA, SMMA, LWMA). Price = Close - type of price (Close, Open, Low, High, Median, Typical, Weighted). Slow MA Setup Period = 10 - period of Slower MA (value 10)
This EA is based on the classical trend-following system of opening the positions. The EA is based on DYJ TwoMACrossAlarm and ATR and CCI indicator. It uses two moving averages. The EA uses dynamic allocation MA period. The MA1 and MA2 period is the Fibonacci sequence, such as 5.8 or 13.21 or 21.34 or...; EA Entry Rules: Go long when fast MA1 crosses above the slow MA2 and CCI crosses above the zero line; Go short when fast MA1 crosses below the slow MA2 and CCI crosses below the zero line; the
DYJ news foreign exchange factory est l'indicateur de base de l'analyse du marché pour les outils de transaction de calendrier et les événements macroéconomiques. Ici, vous pouvez trouver les nouvelles financières et les indicateurs des plus grandes économies du monde - des États-Unis et de l'union européenne à l'Australie et au Japon, il y a neuf économies impliquant plus de 60 paires de devises. Plus de 800 indicateurs et événements macroéconomiques ont été recueillis en temps réel auprès de
This indicator shows the crossing between three moving averages (slower, middle and faster ones). When fast MA crosses up middle MA and middle MA crosses up slow MA, the bullish alert is issued. When fast MA crosses down middle MA and middle MA crosses down slow MA, the bearish alert is issued. Signals to close buy positions are generated if fast MA crosses middle MA downwards, signals to close sell positions are generated if fast MA crosses middle MA upwards. Inputs Fast MA Setup MAPeriod1 = 5
The Expert Advisor is based on three Moving Average indicators. ThreeMACross is based on the following idea: crossing of three Moving Average lines (Fast, Middle and slow ones) is used as a signal for opening and closing a position together. Go Long when Fast MA (MA1) crosses above Middle MA (MA2), and Middle MA (MA2) crosses above Slow MA (MA3). Go Short when Fast MA (MA1) crosses below Middle MA (MA2), and Middle MA (MA2) crosses below Slow MA (MA3). Signals to close buy positions are generate
The RiseTrading is a unique High quality and easy to use and affordable trading tool because we have incorporated a number of proprietary features and PowerSignal and MACD and Stochastic indicators. The main advantages of the trend trading strategy used by the Expert Advisor are opening positions only in the direction of a trend, ability for the long-term retention of profitable positions allowing users to achieve good combinations of profit/loss distributions. That can work on a real account at
DYJ stock controller est un système de bourse en monnaie unique Il peut afficher des valeurs aléatoires pour chaque paire de devises de M1 à MN Lorsque la valeur Stoch d'une période atteint la zone de dépassement et la zone de dépassement, il y a une invite de couleur. Vous pouvez faire la bonne transaction en fonction de ces informations. Créez un modèle d'indicateur de stock appelé « DYJ inventory control » et enregistrez-le. Lorsque vous cliquez à l'aide de la souris sur une zone d'achat ex
The DYJ SoarTrading is based on SoarSignal indicator. It can be used for any currency pair and timeframe. Signals to buy are generated when SoarSignal has crossed oversold downwards, reached oversold and then crossed back up through oversold. Signals to sell are generated when SoarSignal has crossed overbought upwards, reached overbought, and then crossed back down through overbought. Close a trade when SoarSignal reaches the opposite side ( overbought for long order, oversold for short order).
The  DYJ WPR - SignalSource is based on  WPR  indicator. It can be used for any currency pair and timeframe. The  WPR  recommends  Indicator values ranging between 80 and 100% indicate that the market is oversold. Indicator values ranging between 0 and 20% indicate that the market is overbought. The entry signal of this indicator is a turning point in the trend. The indicator uses analog trading technology, Provide you with indicators to evaluate the overall profit of the opening signal and clo
DYJ Sharp advanced algorithm that detects new trends and current trend continuations for use as an entry and exit strategy. The strategy display the SHARP trend demarcation area. This SHARP area has high HighLine and low LowLine. Falling of high below HighLine of SHARP and then falling of close below LowLine of SHARP can be interpreted as a signal to sell. Rising of close above HighLine of SHARP and then rising of low above LowLine of SHARP can be interpreted as a signal to buy. The signal for e
DYJ TRENDWAVE features an advanced algorithm that detects new trends and current trend continuations for use as an entry strategy. DYJ TRENDWAVE's volatility is based on the power of buyers and sellers, it grabs total body size of candles and identifies the battle between buyers and sellers as a percentage of the total volume, like Sellers: (-)100% and Buyers: (+)100%. This information can be used for any entry and exit strategy. For bullish/Long Pin bar it is below the price line, for bearish/S
DYJTRENDWAVE features an advanced algorithm that detects new trends and current trend continuations for use as an entry strategy. DYJTRENDWAVE's volatility is based on the power of buyers and sellers, it grabs total body size of candles and identifies the battle between buyers and sellers as a percentage of the total volume, like Sellers: (-)100% and Buyers: (+)100%. This information can be used for any entry and exit strategy. For bullish/Long Pin bar it is below the price line, for bearish/Sho
Dyj Reversal est un consultant expert entièrement automatisé. Un filtre métrique aléatoire est utilisé pour les entrées. Les conseillers ont besoin de types de comptes de couverture et de rec. La perte de commande sera libérée sous caution par le jeu et deviendra un profit. Si la commande est dans la mauvaise direction. Vous pouvez désactiver la stratégie de jeu à tout moment. Recommandations générales Comptes ECN recommandés, écart xauusd entre 8 et 11 points ou moins, écart EUR / USD 1 Le dép
DYJ T3ModeMA
Daying Cao
2 (1)
DYJ T3ModeMA est basé sur l'algorithme T3. L’algorithme T3 a été introduit dans le domaine de l’analyse technique dans un article intitulé « Better Moving Averages » publié par le magazine américain TASC. T3 peut lisser les séries de prix tout en réduisant le retard du système de suivi des tendances. La taille de la colonne de l'indicateur détermine le signal d'entrée et lorsque la taille de la colonne est proche de 0, c'est le point de basculement de la tendance. L'indicateur utilise des techni
Dyj Long Term Strategy ea is a long - line Trading System Nous commençons par chercher le prix le plus bas dans la bougie comme tendance à long terme, et nous commençons à chercher le prix le plus élevé comme tendance à court terme, et nous garderons la position la plus longue possible et ferons le plus grand profit. Lorsqu'une commande est mal dirigée, la stratégie peut la transformer en gain. EA s'exécute sur n'importe quelle période d'un graphique à une seule devise Signal URL INPUT InpMagi
The DYJBands opens and closes positions using Bollinger Bands signals: It performs trades after a price rebound from the borderlines of the indicator. It has the option to close positions by an opposite signal, by take profit and stop loss, move a trade to breakeven upon reaching the central Bollinger band or after a certain price movement. By default, the EA is configured for trading the GBPUSD currency pair on the H1 timeframe. Also, settings for the EURUSD, USDJPY, USDCAD and XAUUSD currency
The DYJ MacdSto is a unique High quality and easy to use and affordable trading tool because we have incorporated a number of proprietary features and MACD and Stochastic and RSI and ADX indicators. The main advantages of the trend trading strategy used by the Expert Advisor are opening positions only in the direction of a trend, ability for the long-term retention of profitable positions allowing users to achieve good combinations of profit/loss distributions. DYJ MacdSto EA uses MACD and Stoch
This StrongCurrency is a complete trading system based on a variety of technical indicators, moving averages and pivots. Each of those elements can be assessed in defined rules and coefficients (depending on the indicator) providing limitless optimization scenarios for the StrongCurrency. In order to work the StrongCurrency creates a trend strength and entry point signal list display by evaluating these data, that takes data from all symbols. It extrapolates all the information in order to get t
The DYJ TrendPending EA tracks the new change of price of the currency pair and opens trades in case of a price low and high from the main movement in the direction of the trend. So EA uses the least risky grid and Add lots. And can attach a positive and reverse pending order. The PositivePending orders can reduce the number of grids and Add lots,  while ReversePending orders reduce the loss of orders . For more convenient search, the working timeframe has been added to inputs (Work timeframe).
This is a multi-currency and multi-strategy EA. This EA is to create one or more polling trading strategies in a transaction. In the polling mode, the strategies filter a trend-free range market environment and trades are placed in the opposite direction at the edges of the range. With an additional main trend filter in the trend-following mode, the DYJ's ArtOfForexWar can also trade pull-backs during trends in the trend of loss. The winning rate is more than 95% within three orders or three cl
Dyj scappingburg ea est un expert - Conseil entièrement automatisé. Le filtre de l'algorithme de bureau est utilisé pour les entrées. Les conseillers ont besoin de types de comptes de couverture et de rec. La perte de commande sera libérée sous caution par le jeu et deviendra un profit. Si la commande est dans la mauvaise direction. Vous pouvez désactiver la stratégie de jeu à tout moment. Recommandations générales Comptes ECN recommandés, écart xauusd entre 8 et 11 points ou moins, écart EUR /
DYJ ArtOfMakingMoney attempts to gauge bullish and bearish forces in the market by using two separate measures, one for each type of directional pressure. The  EA's BearsIndex  attempts to measure the market's appetite for lower prices The EA's BullsIndex attempts to measure the market's appetite for higher prices Features Monitors all pairs at the same time. The EA monitors the top 35 pairs by default, but you can select less pairs if you wish. It is a multi-currency EA that can be run from a s
Notre objectif est de fournir un service accessible et de qualité, de fournir aux participants du marché, aux traders et aux analystes, des outils indispensables pour des décisions de trading informées et opportunes. L'indicateur d'analyste DYJ Trend le plus optimisé, le plus robuste et le plus facile à utiliser. L'analyste de DYJ Trend tente d'évaluer les forces haussières et baissières du marché en utilisant deux mesures distinctes, une pour chaque type de pression directionnelle. Le Bears
The DYJ Trend Analyser EA is based on  DYJ Trend Analyst  indicator. The most optimized, highly robust and easy to use DYJ Trend Analyser EA. DYJ Trend Analyser EA attempts to gauge bullish and bearish forces in the market by using two separate measures, one for each type of directional pressure. The  EA's BearsIndex  attempts to measure the market's appetite for lower prices. The EA's BullsIndex attempts to measure the market's appetite for higher prices. Pivot Point Extra Indicator for DYJ Tre
This is an expert adviser that is intended to trade where sudden sharp movements occur on charts.  This EA is the trend breakout trading. However it makes only one trade per bar. Low risk EA with no too many positions, and there are predefined TP, SL and TS for each position. Features Monitors all pairs at the same time. The EA monitors the top 15 pairs by default, but you can select less pairs if you wish. It is a multi-currency EA that can be run from a single chart (M5 to D1,recommended timef
Filtrer:
Marion Lancaster Dicaprio
244
Marion Lancaster Dicaprio 2021.09.07 07:21 
 

I highly recommended Dyj global for their products and customer's services. I sincerely think they are the best in the industry they will go above an beyond to make sure you get the best trading results. I have been using this service for approximately one year.

Répondre à l'avis