Regardez les tutoriels vidéo de Market sur YouTube
Comment acheter un robot de trading ou un indicateur
Exécutez votre EA sur
hébergement virtuel
hébergement virtuel
Test un indicateur/robot de trading avant d'acheter
Vous voulez gagner de l'argent sur Market ?
Comment présenter un produit pour qu'il se vende bien
Nouveaux indicateurs techniques pour MetaTrader 5

TRENDSMART ENTRY PRO - Améliorez votre trading Cherchez-vous un outil pour automatiser et améliorer l'efficacité de votre trading ? Au lieu de passer des heures à analyser des graphiques, laissez TRENDSMART ENTRY PRO devenir votre puissant assistant pour prendre des décisions de trading rapides et précises. Ce produit n'est pas seulement un indicateur, mais un système de trading complet qui vous aide à optimiser vos profits et à minimiser les risques. Pourquoi TRENDSMART ENTRY PRO est-il le pre
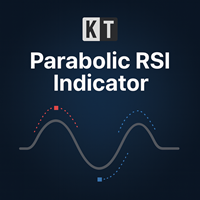
KT Parabolic RSI superpose le Parabolic SAR directement sur la ligne du RSI afin de mettre en évidence les points de retournement probables du marché. Les niveaux classiques de surachat et de survente du RSI indiquent déjà des inversions possibles, mais l’ajout du filtre PSAR élimine une grande partie du bruit et rend les signaux plus clairs et plus fiables, offrant ainsi de meilleures opportunités de trading. Signaux Carré Grand : Un retournement du Parabolic SAR alors que le RSI se situe en zo
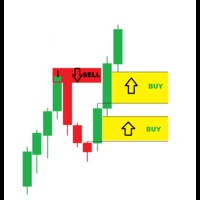
A Smart Price Imbalance Tool with Arrows, Labels, and FVG Zones The Fair Value Gap (FVG) Indicator is designed to automatically detect price imbalance zones on the chart – a widely used concept in Smart Money Concepts (SMC) and Institutional Trading Models (ICT) . These gaps, also known as imbalances or inefficiencies , often highlight areas where price may return to "rebalance" liquidity. Many professional traders consider these levels as high-probability zones for potential reversals, retrace

MTF Candlestick Pattern Pro V2.10 : Moteur d'Analyze de Motifs Multi-Timeframes Avancé Analyse Quantitative de Niveau Professionnel pour Traders Systémiques Allez au-delà de la simple reconnaissance de motifs. MTF Candlestick Pattern Pro V2.10 est un indicateur algorithmique sophistiqué conçu pour MetaTrader 5 qui offre une analyse de motifs multi-timeframes de niveau institutionnel directement sur votre graphique. Ce système fournit non seulement une identification des motifs en temps réel,

Auto Candle Sequence Counter – Indicateur MT5
Présentation Auto Candle Sequence Counter est un indicateur professionnel pour MetaTrader 5 qui détecte et met en évidence automatiquement les séquences consécutives de bougies haussières et baissières. Il fournit une visualisation en temps réel, des statistiques et des alertes pour soutenir les stratégies basées sur l’action des prix.
Fonctionnalités principales
Détection de séquences de 2 à 7 bougies (haussières/baissières).
Cartographie précis
FREE

Indicateur Avancé de Calendrier Économique Cet indicateur affiche directement sur le graphique tous les événements économiques futurs pertinents pour la paire de devises ou l’instrument sélectionné. Il permet d’anticiper les périodes de forte volatilité et de planifier les stratégies de trading avec plus de précision. Fonctionnalités principales Affichage des événements futurs jusqu’à 5 jours à l’avance (paramétrable). Filtrage par niveau d’impact des nouvelles (élevé, moyen, faible). Option pou
FREE
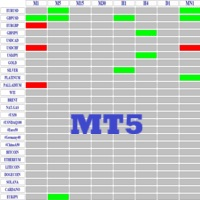
A day high low scanner is a stock screening tool that helps traders and investors identify stocks based on their daily price movements, specifically focusing on stocks that are hitting new highs or lows within a trading day. Here's how it typically works: Day High Scanner: Identifies stocks that are trading at or near their highest price of the current trading day Shows stocks with strong upward momentum Helps traders spot potential breakout opportunities or stocks with bullish sentiment Day Low

Professional TMA Version 1.0 - Advanced Technical Analysis
OVERVIEW The Professional TMA Centered is an advanced technical indicator based on the Triangular Moving Average (TMA) that provides multidimensional market analysis through accurate signals, dynamic bands, and automatic reversal point detection.
What is a TMA (Triangular Moving Average)? The TMA is a doubly smoothed moving average that significantly reduces market noise while remaining sensitive to trend changes. Unlike traditiona

Si tu trades sur les marchés financiers, tu sais sûrement à quel point le spread est important – cette différence entre le prix d'achat (ask) et de vente (bid) peut sérieusement affecter ton profit. Spread Size est un indicateur simple mais très utile qui affiche le spread actuel directement sur le graphique. Plus besoin de surveiller constamment les données manuellement – tout est juste sous tes yeux ! À quoi ça sert ?
Le spread n'est pas qu'un chiffre. C'est ton argent réel. Un spread bas
FREE
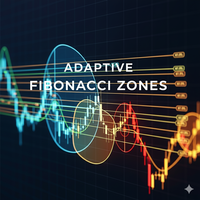
L'indicateur Adaptive Fibonacci Zones est une version améliorée et dynamique du retracement de Fibonacci classique de MetaTrader 5. Sa principale différence avec l'outil natif est que vous n'avez pas besoin de tracer manuellement les niveaux , ni de décider à l'œil de quel point à quel point mesurer le retracement. L'indicateur fait ce travail pour vous : il détecte automatiquement les swings (points hauts et points bas pertinents) du marché en utilisant des fractales et un filtre de volatilité
FREE
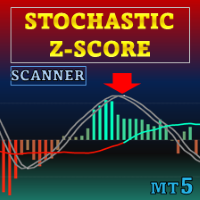
Offre spéciale : ALL TOOLS , seulement 35 $ chacun ! Nouveaux outils à 30 $ pendant la première semaine ou pour les 3 premiers achats ! Chaîne Trading Tools sur MQL5 : rejoignez ma chaîne MQL5 pour recevoir mes dernières actualités Stochastic Z-Score est un oscillateur de momentum qui normalise le prix avec un score Z, borne le signal via une logique stochastique et le lisse avec HMA, tandis que l’ALMA apporte un contexte long terme. Il fournit un signal clair et réactif, plus un

Représentation graphique de la force intrajournalière des devises. Le calcul est basé sur 28 paires. Les valeurs sont suivies depuis le début de la bougie quotidienne jusqu'à l'heure actuelle. Cet indicateur a été initialement créé comme un outil gratuit pour le tableau de bord FX28 Trader. Vous pouvez désormais l'utiliser gratuitement. L'indicateur offre de nombreux paramètres de personnalisation et peut également être lié directement au système de contrôle graphique de FX28 Trader. Remarque !
FREE
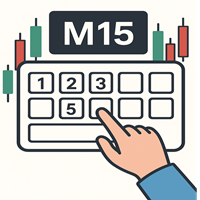
**Changez de Timeframe Instantanément avec TimeView !**
L'indicateur TimeView pour MetaTrader 5 vous permet de passer à n'importe quel timeframe en quelques touches seulement. Pas de menus compliqués, pas de recherches. Rapide, intuitif et efficace !
**Caractéristiques principales :** Raccourcis clavier : Activez le panel avec les touches numériques (1-6, 8) Personnalisable : Ajustez les couleurs, polices et taille du panel Tous les timeframes : Prise en charge de M1 à MN1 Int
FREE

Session Start Breakout - Le Chasseur d'Ouverture de Session Description Complète
L'art d'un trader est de trouver le « point de départ » . Bon nombre des mouvements de marché principaux et puissants prennent forme juste après que l'excitation initiale du début des sessions de trading clés (Asie, Londres et New York) se soit calmée. L'indicateur Session Start Breakout est un outil d'analyse avancé conçu précisément pour vous aider à identifier ces moments critiques et ces opportunités pot
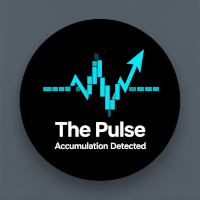
The Pulse est un indicateur qui montre la période d'accumulation en temps réel.
En termes simples: la accumulation est lorsque l'argent intelligent recueille discrètement un actif avant de lancer un mouvement puissant sur le marché.
Sur le graphique, il semble que le prix soit "coincé" dans une fourchette. C'est la phase d'accumulation — quelqu'un se prépare pour le grand déménagement.
Et si vous apprenez à remarquer ces moments — où le marché semble "geler", mais il y a une tension — vous pou
L' analyseur Donchian Time Sync apporte une puissante dimension multi-périodes à l'analyse classique des canaux Donchian, permettant aux traders de surveiller simultanément la force des tendances et les signaux de retournement potentiels sur cinq périodes graphiques différentes. Cet indicateur avancé calcule les plus hauts et les plus bas sur les périodes sélectionnées, générant des signaux visuels clairs qui aident à identifier la convergence des tendances sur plusieurs hori

Silver Stuff identifie les changements clairs de direction de tendance avec des signaux d'entrée précis. Affiche des lignes vertes pour les opportunités longues et des lignes rouges pour les configurations courtes. Le système d'alertes intégré vous notifie instantanément lors de l'apparition de nouveaux signaux de tendance. Options d'Alertes: Alertes de Barre Actuelle (alertsOnCurrent = true): se déclenchent immédiatement mais peuvent se redessiner Alertes de Barre Confirmée (alertsOnCurrent = f

Oscillateur d'Amplitude de Bougie (Candle Amplitude Oscillator) Obtenez une perspective claire sur la volatilité du marché avec l'Oscillateur d'Amplitude de Bougie. Cet outil léger et efficace va au-delà de la simple analyse des prix pour vous montrer l'énergie réelle de chaque bougie, vous aidant à prendre des décisions de trading plus éclairées. Plutôt que de deviner si un marché est actif ou calme, cet indicateur vous donne une mesure précise et standardisée de la volatilité qui fonctionne su
FREE
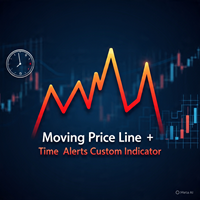
Moving Price Line Plus Event Timer Indie Cet indicateur incroyable et simple a été créé pour aider le trader à savoir exactement à quel moment le prix actuel se produit. Utile pour ceux qui tradent à une heure ou une minute précise pendant une session. Il peut également aider le trader à configurer un minuteur d’événement qui sera affiché sur le graphique. Il peut être réglé par heures ou minutes. L’utilisateur peut changer la couleur du texte et de la ligne selon son choix. L’utilisateur peut c
Introduction à VEHI_v2_Improved Le VEHI_v2_Improved (Indicateur Hybride de Volatilité-Entropie) est un indicateur technique avancé pour MetaTrader 5 (MT5), basé sur le VWAP (Prix Moyen Pondéré par Volume) avec des fonctionnalités intelligentes et sans repainting. Voici ses principaux avantages : 1. Adaptation à la Volatilité du Marché Ajuste la taille de la fenêtre VWAP en fonction de la volatilité du marché (ATR), assurant : Une réponse rapide dans des conditions de forte volatilité. Des signau
TCZ – TriCurrency Z-Score Reversion est un indicateur et scanner compagnon conçu pour un trio de devises. Il adapte l’approche du Z-score résiduel de cointégration de l’arbitrage statistique afin de se concentrer sur les distorsions de prix dans un triangle FX à 3 paires. L’ensemble combine contrôle d’hystérésis du seuil Z (trois modes d’entrée : BreakOut / ReEntry / Retest), Dominance Gate pour détecter la domination d’une jambe, un arrêt basé sur le half-life (timeout) et un ajustement automat
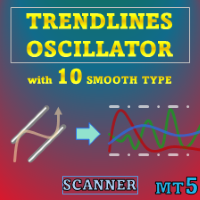
Offre spéciale : ALL TOOLS , seulement $35 chacun ! Les nouveaux outils seront à $30 pendant la première semaine ou pour les 3 premiers achats ! Chaîne Trading Tools sur MQL5 : Rejoignez ma chaîne MQL5 pour recevoir mes dernières actualités Trendlines Oscillator identifie la tendance et le momentum à l’aide de distances normalisées entre le prix actuel et les dernières lignes de tendance haussières (support) et baissières (résistance) détectées.
Voir davantage pour la version MT

VISUAL ATR CANDLESTICK SCANNER PRO L'indicateur intelligent de reconnaissance de figures en chandeliers pour les nouveaux traders.
RENCONTREZ-VOUS CES DIFFICULTÉS ? Vous fixez le graphique sans savoir quelle figure en chandelier apparaît ? Vous manquez des opportunités en or parce que vous ne reconnaissez pas les signaux à temps ? Vous perdez de l'argent en entrant sur des figures faibles et peu fiables ?
LA SOLUTION PARFAITE POUR VOUS ! FONCTIONNALITÉS EXCEPTIONNELLES - A

Êtes-vous prêt à changer votre façon de trader ? Vous sentez-vous perdu au milieu de milliers de signaux de marché ? Êtes-vous fatigué des points d'entrée inexacts, des pertes constantes et de la perte de temps à analyser ? Il est temps de mettre fin à ces problèmes. Smart Entry Point Analyzer Pro n'est pas seulement un indicateur technique ordinaire ; c'est une solution complète conçue pour faire de vous un trader plus professionnel, dès aujourd'hui. Trading intelligent : Maximiser les profits

Custom Indictor Signal Scanner for scan your own any custom indicator and template its one click you can open your desire signals(given time frame alert). Also can open same template with particular input indicator just type name of template your created with given indicator and enjoy all time frame scan with your logical signals What is a Custom Indicator Scanner for MT5 A custom indicator scanner is an Indicator or script that automatically scans multiple currency pairs and timeframes for s

L'indicateur Gamma-Trend est un outil de trading technique utilisé pour identifier la direction de la tendance et les points potentiels de retournement. Son objectif ultime est simple : identifier clairement les signaux d'entrée et de sortie. Sur le graphique, l'indicateur Gamma-Trend apparaît sous forme de lignes colorées qui changent selon la direction de la tendance : une couleur indique une tendance haussière, et une autre montre une tendance baissière. Il présente des niveaux de suivi qui s

L'Indicateur de Pression Acheteurs-Vendeurs affiche le sentiment du marché sur plusieurs timeframes de M1 à D1. Il calcule les pourcentages de pression d'achat et de vente en utilisant une analyse de momentum de moyennes mobiles sur une période configurable. Le panneau visuel montre des barres de progression avec la force acheteuse en sarcelle et la dominance vendeuse en rouge, accompagnées de valeurs en pourcentage lorsque significatives. Chaque timeframe inclut une mesure de force de tendance

Gold Scalping Signal — Entry-Level Indicator Gold Scalping Signal is a beginner-friendly signal indicator designed exclusively for Gold (XAUUSD).
It is offered as an affordable rental version , allowing traders to try it easily before moving on to the Pro edition. Key Features Exclusive logic for Gold (XAUUSD) Clear arrow signals: BUY = Lime, SELL = Red Signals based on closed candles (no repaint) Easy-to-use rental model for quick access Recommended Usage Recommended timeframes: M1 (sc
FREE
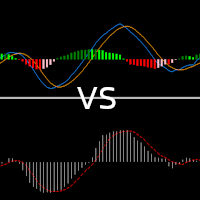
Version optimisée de l'indicateur MACD coloré Le MACD (Moving Average Convergence/Divergence) est un indicateur de trading populaire utilisé dans l'analyse technique des cours des titres. Il est conçu pour identifier la force, la direction, la dynamique et la durée d'une tendance.
Valeurs par défaut : 12,26,9 Type de MA : exponentiel
Valeurs que j'utilise : 8,21,5 Type de MA : simple N'hésitez pas à utiliser ce qui vous convient le mieux.
Interprétation commerciale : Le MACD est positif lorsq
Developed by Smart2Trader
The Didi Index Nuvem Indicator is an indicator based on the original Didi Aguiar (Didi Index) indicator, featuring two visualization methods for the moving averages: as a cloud or as lines (original). This customization offers a new way to visualize the moving average crossovers in the Didi Index indicator. About the Didi Index Indicator The Didi Index Indicator , created by Brazilian trader Didi Aguiar, is a technical analysis tool based on the crossover of three expo
FREE

Special Launch Price: Only $30!
Regular price $39 → Now available for $30 (limited time) .
Price will return to normal once the first buyer reviews are collected.
Gold Scalper Signal Pro — Professional Gold Signal Indicator Gold Scalper Signal Pro is a professional-grade high-precision indicator designed exclusively for Gold (XAUUSD) scalping .
It provides real-time BUY/SELL signals that allow you to capture the very beginning of trends while minimizing market noise , supporting stable an
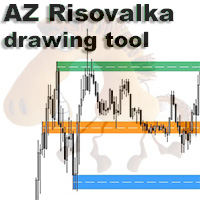
AZ Risovalka levels drawing tool An indicator for simplifying the drawing of levels. Select the indicator mode for the body, shadow, or the whole candle in the settings. Click the 'Draw' button on the drawing panel to create a level, then click on the body or shadow of the candle and select the level color in the color menu that appears. The 'Delete' button to delete level you select, 'Color' to select the color of an already created level. You can set your own colors in the indicator menu (6 co
FREE
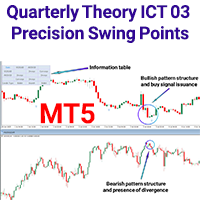
Quarterly Theory ICT 03 Precision Swing Points MT5 The Quarterly Theory ICT 03 Precision Swing Points MT5 indicator is a specialized analytical solution built on the ICT methodology for Metatrader 5. It applies the concept of Precision Swing Points to identify potential market shifts with accuracy. By monitoring divergence and convergence patterns in candle closings between two or more correlated instruments, the indicator highlights signals using color-coded arrows directly on the chart. A key
FREE
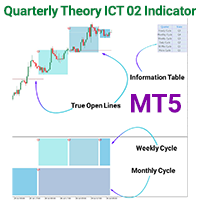
Quarterly Theory ICT 02 Indicator MT5 The Quarterly Theory ICT 02 Indicator MT5 is a specialized analytical tool built upon ICT methodology and fractal time cycles. It segments the market into systematic phases, allowing traders to observe repeating price behaviors over different time horizons. These recurring stages are divided into four quarters (Q1, Q2, Q3, Q4) and can be applied consistently across micro, daily, weekly, and yearly cycles depending on the trader’s preferences. «Indicator Inst
FREE
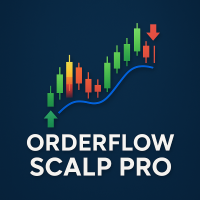
Professional Scalping Indicator for XAUUSD and Major Forex Pairs Orderflow Scalp Pro delivers institutional-grade trading intelligence through advanced volume analysis, dynamic VWAP calculations, and precision arrow signals. This complete trading system transforms complex market data into clear, actionable signals for consistent profitability on 3-4 minute timeframes. Three Powerful Components in One System Volume Profile HeatMap Transform your charts into institutional-grade order flow analysis
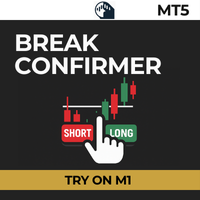
The Break Confirmer gives traders a fast, structured way to confirm price reversals with precision.
With one click, an alert is set. The tool then tracks price action and instantly notifies when a break occurs beyond previous bars or candle bodies — confirming a potential reversal entry without constant chart watching. The integrated multi-symbol panel can manage up to 100 pairs at once, allowing dozens of alerts across multiple instruments. This makes the Break Confirmer more than just an ale
FREE
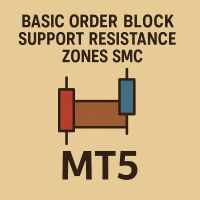
Introduction The Order Block Support & Resistance Zones SMC Indicator is a powerful trading tool designed to detect order blocks effectively.
This indicator displays both support and resistance order blocks , calculated based on zigzag levels .
We have three zigzag levels , each calculated based on the previous one.
In the Basic version , you get access to Level 1 and Level 2 blocks only. Order blocks represent key price levels where the market is likely
FREE
MultiFrame Pivot: A Multi-Timeframe Analysis Tool MultiFrame Pivot is an analysis indicator designed to provide an overview of the market based on Pivot Points across multiple timeframes. The indicator synthesizes information from different timeframes to give you a more comprehensive view of important price levels. KEY FEATURES: Multi-Timeframe Analysis: MultiFrame Pivot allows you to simultaneously monitor the price's status relative to Pivot Points (PP), Support 1 (S1), and Resistance 1 (R1)
FREE

The Keltner Channel Pro is a modern and enhanced version of the classic Keltner Channel , designed for traders who want to identify trends, reversals, and overbought/oversold zones with greater accuracy. Built with EMA (Exponential Moving Average) and ATR (Average True Range) , this indicator automatically adapts to market volatility, providing dynamic channels that help filter noise and improve trade timing. Key Features: Main channel (upper, middle, and lower) based on EMA + ATR. Opt
FREE
Reversal Pattern AI — an absolute breakthrough in the world of indicator development, combining artificial intelligence algorithms, multi-level market analysis, and classical methods of technical analysis. It not only detects reversal patterns but also evaluates market inefficiencies, generating highly accurate trading signals. Thanks to a hybrid model that uses price action analysis, Volumes, Volatility, VWAP, and Volume AVG %, the indicator easily adapts to any market conditions.
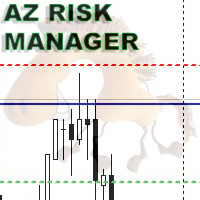
A simple indicator for calculating risk and automatically calculating the take profit line. In the settings, you enter the desired risk to profit ratio, the indicator will automatically calculate the volume for entry and show where to set the take-profit line to maintain the proportion. The risk is calculated based on your balance data. The information panel can be moved around the screen. The stop-loss line can also be moved, this will recalculate the entry volume and the take-profit position.
FREE

Introducing the Professional Indicator ARKA – Candle Close Time
Do you want to always know the exact remaining time for the current candle to close? Or do you want to instantly see the real-time broker spread right on your chart without any extra calculations?
The ARKA – Candle Close Time indicator is designed exactly for this purpose: a simple yet extremely powerful tool for traders who value clarity, precision, and speed in their trading.
Key Features:
Displays the exact time re
FREE
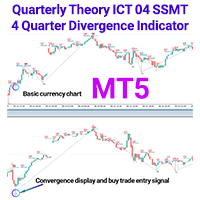
Quarterly Theory ICT 04 SSMT 4 Quarter Divergence Indicator MT5 The SSMT 4 Quarter Divergence Smart Money Sequential Tool is built on advanced principles of technical market analysis, focusing on structural patterns and institutional trading behavior. By applying detailed time-cycle evaluation and structural mapping, this indicator detects divergence across correlated assets within four distinct quarterly phases (Q1–Q4). To function properly, the tool compares two related instruments, such a
FREE
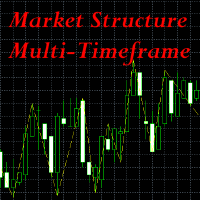
This indicator is extremely useful for traders who want to keep an eye on the market structure without wasting time drawing it manually. It also adds an important optional feature, which is MTF (Multi-Timeframe) analysis . Multi-Timeframe (MTF) analysis is a trading technique that consists of analysing the same financial instrument on different time intervals (charts) simultaneously, in order to gain a more complete view of the market. Starting with the analysis of higher timeframe charts to i
FREE
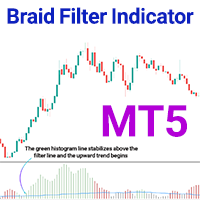
Braid Filter Indicator for MetaTrader 5 The Braid Filter Indicator for MetaTrader 5 is a specialized technical tool designed for traders to analyze market trends and refine trade signals. Built on the interaction of multiple moving averages with a dynamic filtering algorithm, it provides a precise view of changes in price direction. Using colored histogram bars in combination with a central blue filter line, the indicator highlights optimal trading zones for both buying and selling opportunities
FREE

Indicator to find the best trend following trades easy. This is FREE trial version of the indicator and works only on "GBP USD M15 ". Full version and Free Bonus here:
Buy and sell arrows with high performance and consistent results. Automatic analysis of market opportunities ; Never repaints, recalculates or backpaints signals;
The trial version does not work on SUFFIX OR PREFIX brokers ! The full version works in all symbols and TF + Multi Currency Scanner + SPECIAL BONUS .
FREE

1. Introduction Smart Volume S/R Pro is a powerful technical analysis tool designed for the MetaTrader 5 platform. Unlike traditional Support & Resistance (S/R) indicators that rely on price peaks and troughs, this indicator automatically identifies critical S/R zones based on a core factor: Trading Volume . Core Principle: Price levels that witnessed exceptionally high trading volume in the past will often become significant psychological zones, where the price is likely to react strongly (eith
FREE
Crash Tragos – The Ultimate Crash Indices Scalping Indicator The Crash Tragos is a powerful scalping tool designed specifically for Crash 300, 500, 600, 900, and 1000 indices . Built for traders who want precision and consistency, this indicator helps you buy safely in Crash markets while avoiding unnecessary spikes. Timeframes: M1 and M5
Scalping Focus: Buy entries only on Crash Indices
Safe Holding Power: M1: Hold trades for 60 – 120 candles while avoiding spikes M5: Capture 20 – 40 c
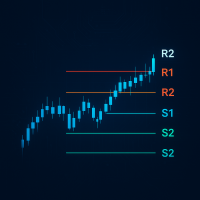
Pivot eXtreme Pivot adalah level referensi penting yang digunakan trader untuk memetakan potensi support & resistance intraday maupun jangka lebih panjang.
Dalam sistem ini, level pivot dikembangkan menjadi P (Pivot Point utama) , R1–R13 (Resistance) , serta S1–S13 (Support) . Pivot Point (P) Titik pusat utama, dihitung dari rata-rata harga (High + Low + Close) / 3 . Berfungsi sebagai acuan keseimbangan harga : Jika harga di atas P → tren cenderung bullish. Jika harga di bawah P → tren c
FREE

Introducing IQ Star Lines - a unique astrological indicator purely based on Vedic astrology calculations , for the first time on Metatrader. This unique tool plots dynamic planetary grid lines based on real-time stars, constellations, and celestial movements , which allows you to plot the power of the cosmos directly onto your trading charts. This indicator is specifically designed for scalpers and intraday traders. The grid lines get automatically adjusted on your chart, with the moving sola
The presented indicator is an original development based on the Predictive Moving Average indicator, which, in turn, was created by John Ehlers. The presented indicator in the form of an oscillator displays the rate of change of the Predictive Moving Average in a separate window. The indicator does not have customizable parameters, at the same time, in most cases, its signals are accurate. The indicator does not repaint on already formed bars, but its readings on the current bar (which continues
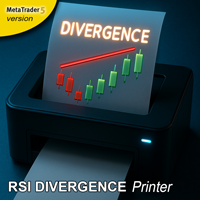
## RSI Divergence Printer Indicator MT5 This MetaTrader 5 (MT5) non repainting indicator automatically identifies and prints RSI divergences directly onto your price chart. This indicator can be used at any timeframes and is suitable for scalping, daytrading and swingtrading. In short, it looks for moments when the price is moving in one direction, but the underlying momentum is moving in the opposite direction, signaling a potential trend reversal. ## Explanation of the Indicator This tool, t
Key Marketing Elements: Professional Positioning: Premium product language - "Ultimate Professional Trading System" Enterprise terminology - "institutional-quality," "professional-grade" Technical credibility - AI-powered, neural network technology Market compliance - MQL5 certified, fully compliant Value Proposition Highlights: Triple strategy framework with clear explanations AI/Neural network technology as key differentiator Professional visual interface with specific details Comprehensive
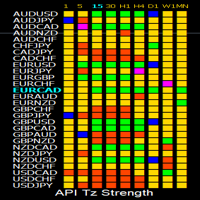
API Tz Strength Indicator MT5 – All-in-One Strength Dashboard for 28 Symbols and 9 Timeframes Take your Strength analysis to the next level with one powerful dashboard. The API Tz Strength Indicator MT5 is designed for traders who want to track market strength and reversals across multiple symbols and timeframes – all from a single chart. With advanced clickable controls, customizable watchlists, and smart alerts, this tool simplifies multi-symbol, multi-timeframe analysis like never before. _

SmartTrend ATR – Indicateur Professionnel de Tendance Description SmartTrend ATR est un indicateur technique avancé basé sur l’algorithme SuperTrend combiné à l’ATR (Average True Range).
Il a été conçu pour détecter les changements de tendance avec précision , en offrant des signaux BUY/SELL clairs et faciles à lire , adaptés à tous les styles de trading (Scalping, Day Trading, Swing, Position). L’indicateur utilise une logique anti-repaint , un système visuel amélioré avec flèches lisible
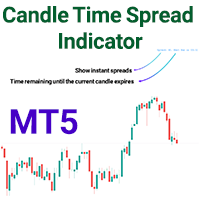
Candle Time Spread Indicator for MetaTrader 5 The Candle Time Spread Indicator for MetaTrader 5 provides traders with live updates on two crucial elements: the exact countdown until the current candle closes and the active trading spread. These details are extremely useful for strategies like candlestick analysis, price action trading, and breakout setups, where timing and spread conditions directly influence trade entries and exits. «Indicator Installation & User Guide»
MT5 Indicator Insta
FREE
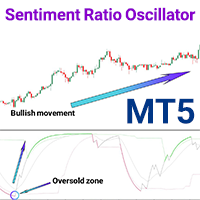
Sentiment Ratio Oscillator for MT5 The Sentiment Ratio Oscillator for MT5 is a technical tool designed to evaluate overall market behavior and highlight potential overbought and oversold conditions. By incorporating Exponential Moving Averages (EMA) along with price variations, this indicator reflects the prevailing trader sentiment for a selected instrument and plots it as a dynamic oscillator beneath the main price chart. «Indicator Installation & User Guide»
MT5 Indicator Ins
FREE

The LBArrow-2 indicator is a sophisticated tool designed for MetaTrader 5 (MT5), delivering precise arrow-based signals derived from a linear breakout strategy. This versatile indicator empowers traders to customize their experience by selecting their preferred signal style—choose between visually appealing blocks or traditional arrows—ensuring seamless integration into your trading workflow. Additionally, you can adjust the starting period from which signals are displayed and fine-tune the line
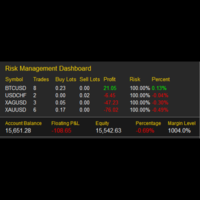
My Risk Management The Risk Management Dashboard is a visual tool designed to help traders monitor risk exposure in real time. With a clear and compact layout, it provides an instant overview of trading activity, enabling more disciplined and informed decision-making. Key Features Active Symbol Summary
Displays all traded symbols with the number of trades, total buy/sell lots, and current profit/loss. Per-Symbol Risk Analysis
Calculates and shows the risk percentage of each symbol relative to
FREE
Stochastic Premium - Technical Indicator Overview The Stochastic Premium is an advanced technical indicator based on the classic stochastic oscillator, designed specifically for traders seeking accurate entry signals with a superior visual interface. This indicator combines the effectiveness of momentum analysis with modern visual elements and advanced features.
Purpose and Functionality What does the indicator do? Identifies overbought and oversold areas in the market. Detects moving av
Parabolic SAR Buy Sell Premium Overview The Parabolic SAR with Arrows is a custom technical indicator developed for MetaTrader 5 that combines the power of the classic Parabolic SAR with clear visual buy and sell signals. This indicator is designed for traders looking to quickly and visually identify trend reversals.
️ Key Features Visual Elements SAR Line: Dotted yellow points that follow the price Buy Arrows: Green arrows (↑) that appear when the price breaks above the SAR Sell Arr
Boom and Crash Sniper - Technical Description General Information Name: Boom and Crash Multi Sniper Version: 1.00 Developed by: FrozenSkillz (2025) Type: Main Chart Indicator Specialty: Spike Detection in Boom and Crash Indices What does the indicator do? This indicator is specifically designed to detect spikes (sudden price movements) in Deriv's Boom and Crash synthetic indices. It combines multiple technical analysis tools to identify trading opportunities in these highly volatile markets.
V
RSI Arrows Professional v1.00 Advanced Technical Indicator for MetaTrader 5
Overview RSI Arrows Professional is a sophisticated technical indicator that combines the power of the traditional RSI (Relative Strength Index) with an intelligent directional signal system. Designed specifically for traders looking to identify optimal entry and exit points in the market, this indicator implements conservative trading strategies based on momentum analysis.
Key Features Conservative Signal Strategy
Description in English Currency Strength Money PRO — The Ultimate Currency Strength Indicator The Currency Strength Money PRO was designed for traders who need clarity and accuracy when analyzing Forex and Metals markets. ️ Modern LiveCharts-style display — colored bars instantly show which currencies are strong and which are weak.
️ Fully customizable — select currencies, timeframes, weights, and colors to fit your strategy.
️ Smart alerts — get notifications when a true imbalance between
Advanced Pattern Detector MT5
Take your trading to the next level with the Advanced Pattern Detector! This professional indicator for MetaTrader 5 is designed for traders looking to identify high-probability opportunities through automatic detection of Japanese candlestick and chart patterns—all in real time and with advanced statistics.
Key Features:
Automatic Pattern Detection: Recognizes key patterns such as Hammer, Shooting Star, Engulfing (bullish and bearish), Doji, Double Top, and Dou
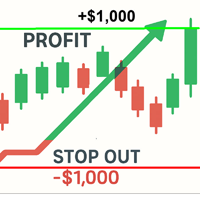
Margin & Profit Visualizer for MT5
Settings, Features, and Applications**
---
**Key Features** - **Critical Level Calculation**: Visualizes Margin Call, Stop Out, Zero Equity (Breakeven), and Total Loss levels. - **Net Breakeven Line**: Automatically calculates the average price level for all selected positions to reach a net zero profit/loss. - **Profit Target Line**: Displays the price required to reach a user-defined profit target (in monetary terms or pips). - **Multi-Currency Suppor

عنوان: محلل الدعم والمقاومة الذكي
وصف مختصر: يقوم بتحديد مستويات الدعم والمقاومة الرئيسية بشكل ديناميكي، مع تسليط الضوء على نقاط المحور الحاسمة وأعلى الارتفاعات وأدنى الانخفاضات لاتخاذ قرارات تداول دقيقة.
الوصف الكامل: أطلق العنان لقوة تحليل السوق الديناميكي مع SmartSRAnalyzerR! يرصد هذا المؤشر المتقدم تلقائيًا قمم وقيعان نقاط المحور، ويحسب أقرب مستويات الدعم والمقاومة، ويعرضها بوضوح على مخططك البياني.
الميزات الرئيسية:
الدعم والمقاومة الديناميكية: تحدد تلقائيًا المستويات الرئيسية استنادًا
FREE

EMA Multi Timeframe (MTF) – MT5 Indicator Description: The EMA Multi Timeframe (MTF) indicator for MT5 allows you to display an Exponential Moving Average (EMA) from a higher (or lower) timeframe directly on your current chart. Example: You can see the Daily (D1) EMA 9 plotted directly on your H1 chart, or even on an M5 chart, helping you align your entries with higher timeframe trends without switching between charts. Key Features: Display EMA from selectable timeframes (M1, M5, M15, M30, H1
FREE
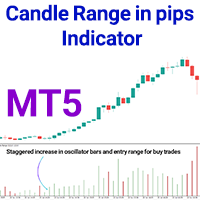
Candle Range in pips Indicator for MetaTrader 5 The Candle Range in pips Indicator for MetaTrader 5 is a technical tool developed to clearly measure and display the true range of each candle, calculated as the distance between the High and Low. This indicator visualizes price movement through a histogram positioned beneath the chart, where each bar reflects the volatility of a single candle. Green bars indicate bullish candles, while red bars correspond to bearish candles, allowing traders t
FREE
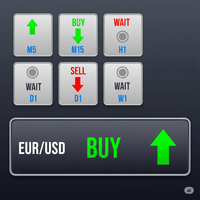
Description The Trend Signal Indicator is a powerful multi-timeframe technical analysis tool designed for MetaTrader 5. It provides visual trading signals based on four key indicators: Stochastic, RSI, Entry CCI, and Trend CCI. The indicator displays signals in an organized tile format with an additional summary tile showing the current symbol's signal. Key Features 1. Multi-Timeframe Analysis Supports 9 timeframes: M1, M5, M15, M30, H1, H4, D1, W1, MN1 Each timeframe displayed in its own tile
Savez-vous pourquoi MetaTrader Market est le meilleur endroit pour vendre des stratégies de trading et des indicateurs techniques ? Pas besoin de publicité ou de protection logicielle, pas de problèmes de paiement. Tout est fourni dans le MetaTrader Market.
Vous manquez des opportunités de trading :
- Applications de trading gratuites
- Plus de 8 000 signaux à copier
- Actualités économiques pour explorer les marchés financiers
Inscription
Se connecter
Si vous n'avez pas de compte, veuillez vous inscrire
Autorisez l'utilisation de cookies pour vous connecter au site Web MQL5.com.
Veuillez activer les paramètres nécessaires dans votre navigateur, sinon vous ne pourrez pas vous connecter.