Regardez les tutoriels vidéo de Market sur YouTube
Comment acheter un robot de trading ou un indicateur
Exécutez votre EA sur
hébergement virtuel
hébergement virtuel
Test un indicateur/robot de trading avant d'acheter
Vous voulez gagner de l'argent sur Market ?
Comment présenter un produit pour qu'il se vende bien
Nouveaux indicateurs techniques pour MetaTrader 5 - 11

Nous sommes heureux de présenter l'indicateur Tout en Un nommé
Top Breakout Indicator MT5
Cet indicateur a été développé par une équipe ayant de nombreuses années d'expérience dans le trading et la programmation.
Chaîne MQL5 : https://www.mql5.com/en/channels/diamondscalping Chaîne Telegram : https://t.me/autoprofitevery MT4 : https://www.mql5.com/en/market/product/107044?source=Site+Market+Product+Page
Avec uniquement cet indicateur, vous pouvez à la fois trader et gérer votre com

The Trend Forecaster indicator utilizes a unique proprietary algorithm to determine entry points for a breakout trading strategy. The indicator identifies price clusters, analyzes price movement near levels, and provides a signal when the price breaks through a level. The Trend Forecaster indicator is suitable for all financial assets, including currencies (Forex), metals, stocks, indices, and cryptocurrencies. You can also adjust the indicator to work on any time frames, although it is recommen
CARTE ALGO
CARACTÉRISTIQUES
- NIVEAUX D'ENTRÉE
- PRENDRE DES NIVEAUX DE PROFIT
- POINTS D'ENTRÉE D'INVERSION
- STRATÉGIE DE RENVERSEMENT
- STRATÉGIE DE TRADING DE TENDANCE
- ACHETER ET VENDRE DES SIGNAUX DE SWING TRADING SUR CHAQUE PÉRIODE
LE LOGICIEL DE TRADING N1 BAT TOUT MARCHÉ TOUS LES JOURS AVEC CE LOGICIEL MT5 !
VOUS VOULEZ PASSER LES ENTREPRISES D'OBJECTIFS ALGO MAP EST CONVIVIAL POUR LES ENTREPRISES D'OBJETS !
NOUVEAU DANS LE TRADING ET VOUS VOULEZ UNE STRATÉGIE Q

L'indicateur Forex RSI Double Stochastique est une modification de l'oscillateur stochastique pour la plateforme MetaTrader 5.
INFORMATIONS SUR L'INDICATEUR L'indicateur forex Double Stochastique implémente un double stochastique appliqué au RSI, en utilisant des niveaux flottants au lieu de niveaux fixes pour évaluer la survente et la surachat.
Dans les cas où la période RSI est <=1, vous obtenez juste une double stochastique. Vous pouvez utiliser un lissage supplémentaire des résultat

The Psychological Oscillator MT5 Forex indicator is an excellent modification of the classic oscillator that will help you in trading for MetaTrader 5.
INFORMATION ABOUT THE INDICATOR The Psychological Oscillator MT5 Forex indicator is presented in the form of a color histogram and has all the qualities of forex oscillators.
There are also zones, when and in which zones the market is located. Everything is done simply and as clearly as possible so that all traders can understand it without

RAD CRITICAL LEVES RAD indicator tracks “Relevant Volume” in real time, identifying accumulation and distribution processes, projecting them in the chart as SUPPORT or RESISTANCE zones. Natural support and resistance levels are generated by Volume Accumulation and Distribution processes. As these processes evolve, levels at which the relevant volume in the market place is positioned, become difficult areas to cross upwards or downwards. By using this information, traders can identify very s

Description Helps you detect the structure of the market, using different types of Smart Money concepts. This should help you to upgrade your trading strategy in every way. Smart Money Features: Color candle to signal the type of structure Shows CHOCH and BOS Equal Lows and Highs Order Blocks Internal and Swings Weak and strongs high and lows Fair Value Gaps High and Lows in daily weekly and monthly timeframes Premium and discount Zones KEY LINKS: How to Install – Frequent Questions - All

O indicador criado por Didi Aguiar, o mestre das Agulhadas!
O padrão do indicador é o cruzamento de três médias móveis simples. Média rápida, período 3. Média normalizada, período 8. Média lenta, período 20.
Quando as três médias se cruzam próximas o suficiente, acontece a agulhada! Pela posição das médias é possível identificar: Agulhada de compra, agulhada de venda, ponto falso e beijo da mulher aranha.
Quer saber mais? Procure pelo site dos robôs oficiais da Dojistar: tradesystembots.co
FREE

The "SyntheticaFX Power Indicator" is an exceptional trading tool designed to offer valuable insights into market strength and potential changes, without revealing its proprietary methodology. This powerful indicator is ideally utilized in conjunction with our specialized tools, the " SyntheticaFX CrashSlayer and " BoomSlayer " Spike Indicators, to provide traders and investors with a comprehensive and dynamic trading experience. When employed alongside our SyntheticaFX CrashSlayer and BoomSlaye
FREE

Do you want to know how an economic event will impact price? What will happen to price after the news? How has an economic news affected price in the past? This indicator can help you with that.
Do you like technical analysis? Do you enjoy studying the history to predict the future? But what do you think could be more important than technical analysis, what could improve technical analysis? Of course, it's fundamental analysis! After all, economic events directly impact the market, and theref

Indicador Multiple Regression Indicador faz o plot da Curva de Retorno e dos canais superior e inferior de uma regressão para os preços de fechamento do ativo do gráfico. A Curva de Retorno é a linha central do indicador e representa a região de equilíbrio do preço entre vendedores e compradores. Nesse indicador o usuário escolhe o tipo da regressão podendo ser de 3 tipos: primeiro grau, segundo grau ou terceiro grau. Os plots do indicador são: Linha central – cor padrão preta; Linha superi
FREE

LuXiwu Trend Trading special wave marking tool
0.Main table show hide Click the bottom 10% area of price axis to show or hide main table,or by default key Q.
1. QJT search Click the high or low point of the main wave to automatically find the QJT . If there is overlap between the inner and outer intervals, click the button << or >> to adjust the left and right, or manually drag the adjustment after completion.If there is a failure wave, you can use the system's own trend line to draw the
The scanner is designed to scan signal buffers of indicators (arrows) and display the nearest signal bar on the panel in color and digital display. Symbols to be scanned, time frames and the number of bars to be scanned are specified, starting from the current (0th) bar. There is also a complex signal, which indicates a list of timeframes on which the indicator signal must match.
You can collapse the indicator by clicking the left mouse button on the upper left corner of the panel (name)

En esta versión, las alertas están funcionando y en la versión que publicó, la zona muerta de atr era solo una zona muerta sin atr, por lo que también la convirtió en una zona muerta de atr.
Indicator input parameters input int Fast_MA = 20; // Period of the fast MACD moving average input int Slow_MA = 40; // Period of the slow MACD moving average input int BBPeriod=20; // Bollinger period input double BBDeviation=2.0; // Number of Bollinger deviations input int Sensetiv
FREE

I think you all know Donchian Channels. so I am not going to write about it.
With this indicator I tried to create Donchian Trend Ribbon by using Donchian Channels.
How it works ?
- it calculates main trend direction by using the length that is user-defined. so you can change it as you wish
- then it calculates trend direction for each 9 lower lengths. if you set the length = 20 then the lengths are 19, 18,...11
- and it checks if the trend directions that came from lower lengths i
FREE

GG TrendBar Indicator - Your Multitimeframe ADX Trading Solution Experience the power of multi-timeframe trading with the "GG TrendBar MT5 Indicator." This versatile tool, built upon the ADX indicator, offers precise insights by considering multiple timeframes, ensuring you make well-informed trading decisions. Basic Details : Indicator Type : GG TrendBar Indicator (Multi-Timeframe ADX) Key Metrics : Real-time ADX analysis across multiple timeframes. Customization : Enable or disable specific ti

Developed by Charles Le Beau and featured in Alexander Elder's books, the Chandelier Exit sets a trailing stop-loss based on the Average True Range (ATR). The indicator is designed to keep traders in a trend and prevent an early exit as long as the trend extends. Typically, the Chandelier Exit will be above prices during a downtrend and below prices during an uptrend.
Calculation
The original Chandelier Exit formula consists of three parts: a period high or period low, the Average True
FREE

Unlock the Power of Scalping with this Essential Indicator for Any Currency Pair! Experience Crystal-Clear Buy/Sell Signals and Activate Instant Alerts for Maximum Precision.
Introducing the Ultimate Scalping Companion: Your Key to Precision Profits! Transform Your Trading Strategy with an Indicator that Stands the Test of Time! In the ever-evolving world of trading, consistent success hinges on smart risk management . While no tool can be the holy grail, our non-repainting indicator
FREE

Trend Envelopes indicator is calculated based on a % of price change. That % is then used to determine if there is a new trend or trend remains the same.
This version is using Standard Deviation for the price change calculation instead and is adding prices smoothing prior to be used in calculations. The smoothing can be done using one of the 4 average types:
* Simple Moving Average
* Exponential Moving Average
* Smoothed Moving Average
* Linear Weighted Moving Average
Als
FREE

================ // Average period ma_Sma, // Simple moving average ma_Ema, // Exponential moving average ma_Smma, // Smoothed MA ma_Lwma // Linear weighted MA =============== // Average method // Turn alerts on? // Alert on current bar? // Display messageas on alerts? // Play sound on alerts?
FREE
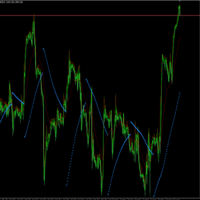
La idea de este indicador es la siguiente: reemplazar los precios High, Low del indicador SAR por los valores del indicador Moving Average. Al final tendremos la siguiente imagen:
Es decir, el indicador SAR cambia su dirección después de tocar el indicador Moving Average.
Parámetros de entrada SAR: Step - parámetro "Step" del indicador SAR; SAR: Maximum - parámetro "Maximum" del indicador SAR; MA: Period - parámetro "período de promediación" del indicador MA; MA: Shift - parámetro "d
FREE

Es un indicador que no se repinta y que muestra la tendencia a corto plazo. contiene lo siguiente: Visual Mode MA Period MA Method MA Price
ATR Period Volatility Factor Offset Factor Use Break Use Envelopes Use Alert
cualquier sugerencia hagamelo saber en los comentarios y también colocar estrellas para postear más contenido, indicadores y advisor actualizadas
FREE

Unlock the Power of Scalping with this Essential Indicator for Any Currency Pair! Experience Crystal-Clear Buy/Sell Signals and Activate Instant Alerts for Maximum Precision.
Introducing the Ultimate Scalping Companion: Your Key to Precision Profits! Transform Your Trading Strategy with an Indicator that Stands the Test of Time! In the ever-evolving world of trading, consistent success hinges on smart risk management . While no tool can be the holy grail, our non-repainting indicator is a

Scalper Dynamic Pivot detects respectable narrow reversal areas that can be used to mark repeatable opportunity windows. Originally made for M1 timeframe and targeting M30 using EMA200.
Setup/inputs:
First, set one pip on price, e.g. EURUSD to 0.0001, USDJPY to 0.01, or XAUUSD to 0.1. Set minimum and maximum range on pips, if you want scalp between 10 to 20 pips then set it to 10 and 20 respectively. Set moving average length to be used as pivot baseline. To use M30 with EMA200 please use M

The GGP Squeeze Momentum MT5 Indicator is a volatility and momentum tool designed to help traders optimize their trading performance and providing traders with actionable insights to make well-informed trading decisions. This indicator is MT5 conversion of the Squeeze Momentum Indicator by “LazyBear “ in Trading View website and some alert methods are added to provide real-time alerts when a trading signal is generated, in order to allow traders to act quickly and efficiently. For MT4 version pl

The GGP Williams Vix Fix MT5 Indicator is based on the volatility of the market and grants a huge support for finding out when a correction is coming to end. This indicator is MT5 conversion of the CM_Williams_Vix_Fix Finds Market Bottoms Indicator by “ChrisMoody “ in Trading View website and some alert methods are added to provide real-time alerts when a trading signal is generated, in order to allow traders to act quickly and efficiently. For MT4 version please click here . Larry Williams Deve
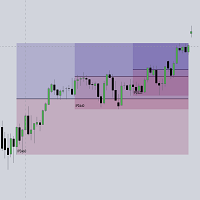
This script automatically calculates and updates ICT's daily IPDA look back time intervals and their respective discount / equilibrium / premium, so you don't have to :) IPDA stands for Interbank Price Delivery Algorithm. Said algorithm appears to be referencing the past 20, 40, and 60 days intervals as points of reference to define ranges and related PD arrays. Intraday traders can find most value in the 20 Day Look Back box, by observing imbalances and points of interest. Longer term traders c

Draw as many custom candles as possible on a single chart with this special indicator. Your analysis skill will never be the same again for those who know the power that having a hawkeye view of all price action at once provides. Optimized for performance and allows customization on the appearance of candle bodies and wicks. This is an integral part of analysis at our desks, we hope it will never leave your charts too once you can use it to its full potential.

Cet indicateur vous permet d'afficher les étiquettes des niveaux de Fibonacci avec une grande taille de police
. Il prend en charge jusqu'à 25 niveaux de Fibonacci
- Dès que vous dessinez Fibonacci, il affiche les niveaux que vous avez ajoutés comme paramètre d'entrée avec une grande taille de police avec la couleur et la police que vous choisissez.
Options personnalisables :
1. Police de texte Fibo
2. Taille du texte Fibo
3. Couleur du texte Fibo
3. Ajoutez une description

Gold Venamax - c'est le meilleur indicateur technique boursier. L'algorithme de l'indicateur analyse l'évolution des prix d'un actif et reflète la volatilité et les zones d'entrée potentielles.
Caractéristiques de l'indicateur:
Il s'agit d'un super indicateur avec Magic et deux blocs de flèches de tendance pour un trading confortable et rentable. Le bouton rouge pour changer de bloc est affiché sur le graphique. La magie est définie dans les paramètres de l'indicateur, afin que vous puissie

Gold Trend - il s'agit d'un bon indicateur technique boursier. L'algorithme de l'indicateur analyse le mouvement du prix d'un actif et reflète la volatilité et les zones d'entrée potentielles.
Les meilleurs signaux de l'indicateur:
- Pour la VENTE = histogramme rouge + pointeur SHORT rouge + flèche de signalisation jaune dans la même direction. - Pour l'ACHETER = histogramme bleu + pointeur LONG bleu + flèche de signalisation aqua dans la même direction.
Avantages de l'indicateur:
1

L'indicateur Delta Book est un puissant outil d'analyse de marché qui combine l'utilisation du delta de volume avec des informations issues du carnet d'ordres pour détecter le flux des prix sur les marchés financiers tels que les actions, les contrats à terme et les cryptomonnaies. Il est important de noter que le Delta Book nécessite un accès aux données de volume en temps réel et aux informations du carnet d'ordres pour exploiter pleinement son potentiel. La caractéristique principale du Delta

I've combined two trading strategies, the Order Block Strategy and the FVG Trading Strategy, by utilizing a combination of the FVG indicators and Order Blocks. The results have been surprisingly effective.
This is a two-in-one solution that makes it easy for traders to identify critical trading zones. I've optimized the settings so that all you need to do is install and trade; it's not overly complex to explain further. No need for any usage instructions regarding the trading method. You shou

This is a trend follwing indicator, where you can find signals, when there's a crossover between the lines. When current price is above the lines, you are on a long term situation and when price is below the lines, you are on a short one. Period of calculations can be edited. So, with this, if you add other indicators to filter bad signals, you can have a good profitable strategy.

L'indicateur « Market Session Times » indique l'heure de quatre séances de trading : Asie, Europe, Amérique et Pacifique. L'heure des séances de trading est fixée au format GMT et ne dépend donc pas du tout du serveur de trading. Les données suivantes sont utilisées : Séance de négociation
Ville
GMT
Asie Tokyo
Singapour
Shanghai 00h00 à 06h00
01h00-09h00
01h30-07h00 L'Europe Londres
Francfort 07h00-15h30
07h00-15h30 Amérique New York
Chicago 13h30−20h00
13h30−20h00 Pa

Engulfing Candle Detector
Detectable pattern Double Candlestick Patterns Bullish Engulfing
The first candle is black candle. The second candle opens with a gap below the real body of the black candle but rallies upwards to close above the real body of the black candle. In other words, the second candle's real body completely engulfs the first candle's real body Bearish Engulfing
The first candle is white candle. The second candle opens with a gap above the real body of the white candle but
FREE

Sessions sont très importantes et souvent des bon endroits pour chercher des setups. En SMC, ICT, la session asiatique est souvent utilisée pour créer de la liquidité.
L'indicateur affiche: Haut & Bas de la session asiatique La ligne de prix de l'ouverture de minuit (New York)
Congifuration Ligne style, coleur Text position, taille, color
Questions, commentaires, envoyez moi un message en direct ici: https://www.mql5.com/en/users/mvonline
FREE

Fair Value Gap Sweep is a unique and powerful indicator that draws fair value gaps on your chart and alerts you when a gap has been swept by the price. A fair value gap is a price gap that occurs when the market opens at a different level than the previous close, creating an imbalance between buyers and sellers. A gap sweep is when the price moves back to fill the gap, indicating a change in market sentiment and a potential trading opportunity.
Fair Value Gap Sweep indicator has the following
FREE

Multi-currency and multi-timeframe indicator MACD. The dashboard can display both the Traditional (true) MACD and the MACD which is built into MetaTrader. On the panel you can see the current state of the indicator — the direction of movement of the MACD lines, their intersection and a pop-up window with the indicator chart. In the parameters you can specify any desired pairs-symbols and timeframes. The scanner can also send notifications about lines crossing each other and about lines crossing

Savoir où sont les niveaux importants comme les plus hauts et bas du jours précédent ou de la semaine permettent une meilleur prise de setup de trading.
Cet indicateur permet d'afficher Haut et bas du jour précédent Haut et bas de la semaine précédente
Congifuration High & Low for: Previous day, week Line Style, color Label position, size, color Questions, commentaires, envoyez moi un message en direct ici: https://www.mql5.com/en/users/mvonline
FREE

The UT Bot Alert MT5 Indicator is an advanced technical analysis tool designed to help traders optimize their trading performance. This indicator is MT5 conversion of the UT Bot alerts indicator by “QuantNomad “ in Trading View website and some alert methods are added to provide real-time alerts when a trading signal is generated, in order to allow traders to act quickly and efficiently. Key Features: Alert Types: in addition to the terminal pop-up alerts, the mobile notification sends the alert

The Market Structures Pro indicator finds and displays 5 (five) patterns of the Smart Money Concepts (SMC) system on the chart, namely:
Break Of Structures (BoS) Change of character (CHoCH) Equal Highs & Lows Premium, Equilibrium and Discount zones with Fibo grid High-high, Low-low, High-low and Low-high extremes
Patterns are displayed for two modes - Swing and Internal and are easily distinguished by color on the chart. Internal mode features higher contrast colors, finer lines, and sm
The same indicator that is published here https://www.mql5.com/en/market/product/105645?source=Site+Market+My+Products+Page , but instead of the MACD, a Stochastic Oscillator is used.
The indicator can be useful for searching for the possibility of opening a position on the Momuntum of multiple timeframes - a method described by Robert Miner in his book "High probability trading strategies".
The settings speak for themselves
Period - the timeframe for which the indicator is calculated.
FREE

The indicator is based on Robert Miner's methodology described in his book "High probability trading strategies" and displays signals along with momentum of 2 timeframes. A Stochastic oscillator is used as a momentum indicator.
The settings speak for themselves period_1 is the current timeframe, 'current' period_2 is indicated - the senior timeframe is 4 or 5 times larger than the current one. For example, if the current one is 5 minutes, then the older one will be 20 minutes The rest of the
FREE

This indicator displays MTF (Multi-Time Frame) Candles on your Chart. It helps to see the overall Trend of Market. You can specify 2ndLast, Last or Current Candle of any timeframe to show to get a better picture of Trend.. You get 4TF Bars/Candles on your current chart ..
Customizable Settings are : 1. Where to place MTF Candles.. 2. Show or Hide for each Candle 2. Time-Frame for each Candle 3. Current/ Last / 2nd Last of Each Candle
FREE

This Indicator works as a momentum oscillator however it is most used to surf the trends. Despite of being an oscillator, MACD (Moving Average Convergence/Divergence) doesn't work with over limit conditions (such as OverBought or OverSold). Graphically it's shown as two lines and an histogram with the diference of them. Standard metatrader has this indicator, however with only the two lines and without the histogram. This way it is much easier to read and uderstand it.
FREE

Introducing Candle Feeling Indicator for MetaTrader 5 - Your Ultimate Solution for Accurate and Timely Analysis! Built with more than two decades of programming experience, this indicator allows you to follow the complexities of financial markets with confidence and accuracy.
Key Features: High Precision: Identifies trend reversals with unparalleled accuracy, ensuring you stay ahead of market shifts. Analysis: All the information you need from the structure of a candle Beautiful appearance

This indicator displays MTF (Multi-Time Frame) Candles on your Chart. It helps to see the overall Trend of Market.. It also help to MTF Analysis in fast way because you dont need look in many Time-Frames.. You get 4TF Bars/Candles on your current chart.. It can help you to identify trend or Reversal early as you get overall picture at one place...
Customizable Settings are : 1. Where to place MTF Candles.. 2. Show or Hide for each Candle 2. Time-Frame for each Candle
FREE

Property of Vertical Capital Edition: Gugol_Quants About USA INDEXES QUANT_INDICATOR: This is a indicator created by math modulation to be used as a trading tool, which was developed in MQL. (MT5) This indicator is for use only with US500(S&P500), NAS100(Nasdaq Composite) and US30(Dow Jones). Signals are activated on "Open" Candle. It’s based on Intraday/Swing Trades whose main timeframe is H1, H2, H3 and H4. However you can use it with other assets by testing with the appropriate settings. *
FREE

This indicator idea comes from Tushar Chande called Qstick.
Technical indicators quantify trend direction and strength in different ways.
One way is to use the difference between close and open for each bar and to sum it up over a period of time.
The formual is:
Qstick (period ) = Average ((close-open ), period )
In this indicator, we can choose how to calculate body by two famous chart types. The first and default indicator settings are based on Heiken Ashi chart, and the second i
FREE

The bullet indicator gives accurate direction of the market structure, it will indicate to you the exact direction whether it be the market is in a downtrend or if it's in an uptrend it will give you that information which will inturn benefits you by saving you the time it takes to analyse that structure, this indicator works on a timeframes and it's most favourable on higher timeframes.
How it works: -The green arrow will be at the support of the structure indicating buys -The red arrow will

This is not a conventional Moving Average Indicator. With this indicator, you can fully costumize your moving average. You can select the "Source" Price (not only the standard prices that come with Metatrader), "Period" of it, and the "Smooth" Calculation that you want to apply. There are many of them, such as SMA (Simple Moving Average), SMMA (Smoothed Moving Average), EMA (Exponential Moving Average), DEMA (Double Exponential Moving Average), TEMA (Triple Exponential Moving Average) and LWMA (

Smart Liquidity Levels is a valuable tool for identifying optimal liquidity levels, enabling retail traders like us to strategically set our stop-loss orders. T he essential tool for traders seeking to maximize their trading success. The liquidity level is a critical component of inner circle trading (ICT). It assists us in determining when and how we should enter the market. Watch the video for detailed instructions. Here's why understanding liquidity levels is crucial in trading and how our

Un indicateur construit sur la théorie de William Gann, il trace des lignes horizontales sur les prix qui correspondent aux principaux angles d'un cycle de 360 degrés. Cet indicateur est basé sur les célèbres théories de William Gann, se concentrant sur les principaux angles considérés comme de forts niveaux de renversement de prix. Les angles principaux intégrés sont : 30, 45, 60, 90, 120, 180, 220, 270, 310 et 360. Caractéristiques : Personnalisation de l'angle : Les utilisateurs peuvent ajou

Nous vous présentons le Compas du Docteur de la Volatilité - Votre Guide Infaillible vers les Profits sur N'importe Quel Marché !
Découvrez les Secrets des Lois Mathématiques Intemporelles :Plongez au cœur de la maîtrise du trading avec notre technologie exclusive, solidement ancrée dans des principes mathématiques qui transcendent tous les marchés. Nous ne révélons pas les secrets, mais soyez assuré, cette innovation est votre sésame vers une fiabilité inégalée dans toutes les conditions
FREE
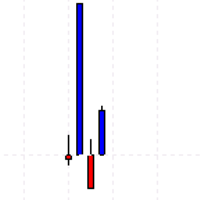
Libérez la puissance de la précision avec notre indicateur de pointe ! Cet outil ingénieux surveille méticuleusement chaque tick de prix, lançant ses calculs dès le moment où vous le chargez sur votre graphique.
Imaginez avoir la capacité de découvrir des changements de tendance subtils et des schémas directionnels au fur et à mesure de leur évolution, vous offrant ainsi un avantage remarquable dans le monde dynamique des marchés financiers. Notre indicateur est votre allié attentif, vous per

Unlock the Power of Market Analysis with Precision Are you ready to take your trading to the next level? The "Institutional Volume Profile" indicator is here to empower your trading decisions like never before. Key Features: Custom Volume Profiles : Plot volume profiles effortlessly by simply adding horizontal lines or Fibonacci tools on your MetaTrader 5 chart. There's no limit to how many profiles you can create. Insightful Visualization : The indicator beautifully displays crucial information

The "Timechannel" is a powerful technical analysis tool designed specifically for traders who want to gain deeper and more accurate insights into price movements across multiple timeframes (multi-timeframe). This indicator is an essential addition to the toolbox of any serious trader seeking to make informed and data-driven trading decisions. Key Features: Advanced Multi-Timeframe Analysis : Timechannel allows traders to analyze price movements on different timeframes simultaneously. This is cr

The Trend Sikorsky indicator contains an entire trading system, processes information from several technical instruments and the appearance of its signals is the final result of the calculation. The indicator itself evaluates how strong a signal appears in the market and when to change direction, signals this, and the trader can only make a trading decision. This indicator works on all timeframes. You need to understand that any indicator is only a visual form of a signal. Currency pairs never

The Hrum indicator was created to neutralize temporary pauses and rollbacks. It analyzes price behavior and, if there is a temporary weakness in the trend, you can notice this from the indicator readings, as in the case of a pronounced change in trend direction. Entering the market is not difficult, but staying in it is much more difficult. With the Giordano Bruno indicator and its unique trend line, staying on trend will become much easier!
Every rise and every fall is reflected in your emot

Switch Tray is a shortcut tray tool for commonly used trading pairs provided to traders. It can be placed at the bottom of the chart, and commonly used trading pairs can be set by themselves. 1. You can set the shortcut switch button for your commonly used trading pairs. The default is [EURUSD/GBPUSD/XAUUSD/USDJPY/USDCHF/USDCNH]. / slash is the separator. 2. The button of each trading pair is also equipped with the number of open positions of a certain trading pair. 3. Multi-cycle quick switchi
FREE

Chart Walker Smart Lines (CWSL) by Chart Walker Smart Lines is a MetaTrader 5 (MT5) indicator that revolutionizes technical analysis by offering a suite of powerful features to enhance your trading experience. This intelligent tool is designed to automate various aspects of chart analysis, providing traders with valuable insights and saving time on manual tasks. Key Features Automatic Channel Drawing: Smart Lines takes the hassle out of drawing trend channels by automatically identifying and

Let me introduce our ProfitPlotter indicator
We are developing a technical indicator best suited for analyzing trading performance. It can display statistics of all currency pairs and trades of different magic numbers categorized on the same chart. You can specify the time range, magic number, specific currency pairs or profit statistic curves of all currency pairs for analysis. You can also click to jump to order positions and view order details, which greatly improves the usage experience. Ma

Point and Plot: The Anchored VWAP with Channel Bands tool is designed for traders of all levels, from beginners to seasoned professionals. Point to the price level you want to anchor to, plot the horizontal line, and watch as this versatile tool transforms your trading approach. User-Friendly Interface : Navigate the tool effortlessly with a user-friendly interface that ensures you never miss a crucial detail. Real-Time Analysis : Make informed decisions in real time with dynamic data that upda

Visual guide which divides the 24 hours into three trading sessions. The default setting is to show Asian , London and New York sessions. But, the session start and end hours can be adjusted as required.
The indicator is useful to develop trading strategies by making it easy to see the market behavior during the three sessions.
Inputs Time Zone Start and End hours (Please provide values in HH:MM format, like 02:00, not like 2:00. Both the hours and minutes should have 2 digits) Time zone

This indicator is great for trading many different pairs. The indicator itself uses mathematical models of augmented accuracy, but for now they are optimized for some currency pairs. Many settings can be configured in the initial settings. There are many icons for visualization. He displays his solution on a graph using various icons. There are several types of icons. In the tester it works fine by default in the settings. It is already configured by default. Happy bidding.

This MT5 chart trend checker cuts through the noise of market volatility to provide a clearer picture of trends and price movements. It includes the following features that can provide more clarity during market assessments: 1 customizable multi-period moving average Optional Heikin-Ashi candles 3 switchable focus modes Distinct colors for easy analysis
Link to MT4 version: https://www.mql5.com/en/market/product/106708/
This indicator shows your preferred moving average from multiple time fr
FREE

The Session Volume Profile indicator displays the distribution of trade volume across price levels for a specific trading session. It visualizes areas of high and low trading activity, helping traders identify support and resistance zones. The profile's peak, known as the Point of Control (POC), represents the price with the highest traded volume.
The inputs of the indicator:
volumeBars(Row Size) : Determines the number of price bins or rows for the volume profile. A larger number results in
Camarilla Pivot Points is a math-based price action analysis tool that generates potential intraday support and resistance levels. Pivot price values are stored in output buffers within this indicator, enabling any Expert Advisor to utilize this indicator's data for trading purposes. This indicator offers the potential for developing numerous strategies. To explore some of these strategies, please visit the following websites: https://www.babypips.com/forexpedia/camarilla-pivot-points https:
Equalizer MT5 is a trend indicator that can be used as: trend filter tigger entry trailing stop Trend filter : with blue histogram we have bull market; with red histogram we have bear market and; with gray histogram we have consolidated market. The tigger : with the increase in the size of the histogram bars we can have possible entry points into a trend. The trailing stop : in a trend, when the size of the histogram bars increases we can move the stop loss to the price bar corresponding to the
FREE
Le MetaTrader Market est le meilleur endroit pour vendre des robots de trading et des indicateurs techniques.
Il vous suffit de développer une application pour la plateforme MetaTrader avec un design attrayant et une bonne description. Nous vous expliquerons comment publier votre produit sur Market pour le proposer à des millions d'utilisateurs de MetaTrader.
Vous manquez des opportunités de trading :
- Applications de trading gratuites
- Plus de 8 000 signaux à copier
- Actualités économiques pour explorer les marchés financiers
Inscription
Se connecter
Si vous n'avez pas de compte, veuillez vous inscrire
Autorisez l'utilisation de cookies pour vous connecter au site Web MQL5.com.
Veuillez activer les paramètres nécessaires dans votre navigateur, sinon vous ne pourrez pas vous connecter.