Gamma Trend AI

L'indicateur Gamma-Trend est un outil de trading technique utilisé pour identifier la direction de la tendance et les points potentiels de retournement. Son objectif ultime est simple : identifier clairement les signaux d'entrée et de sortie.

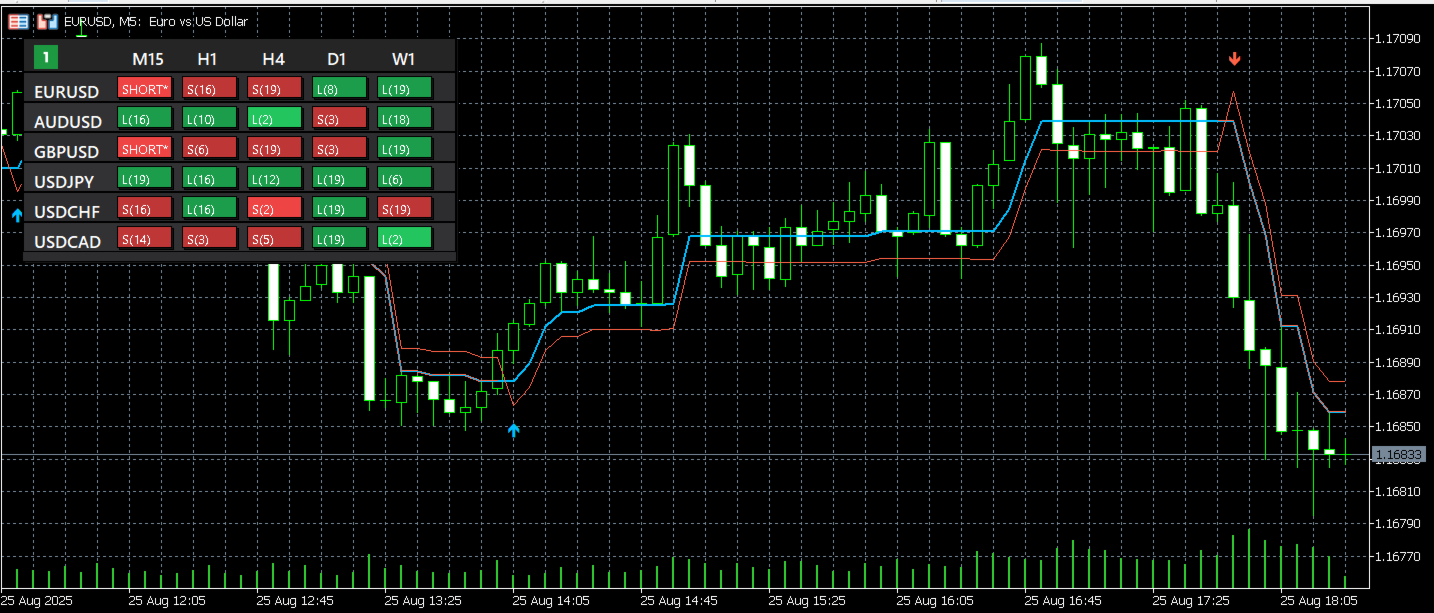
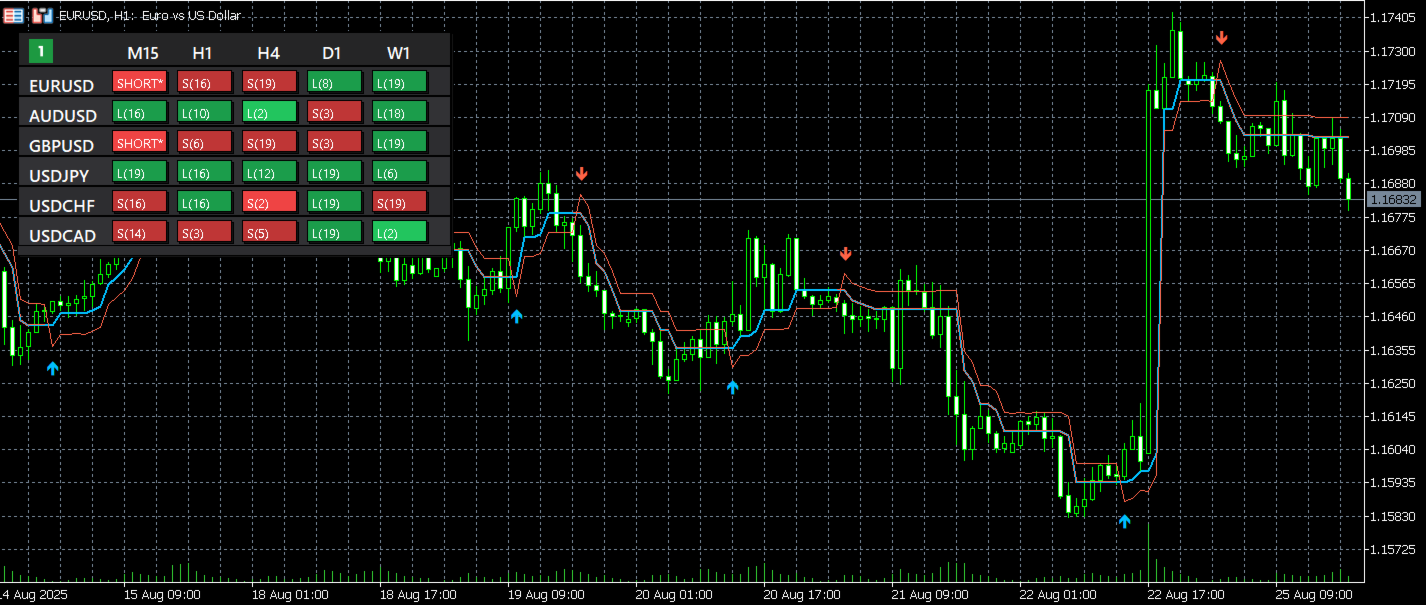
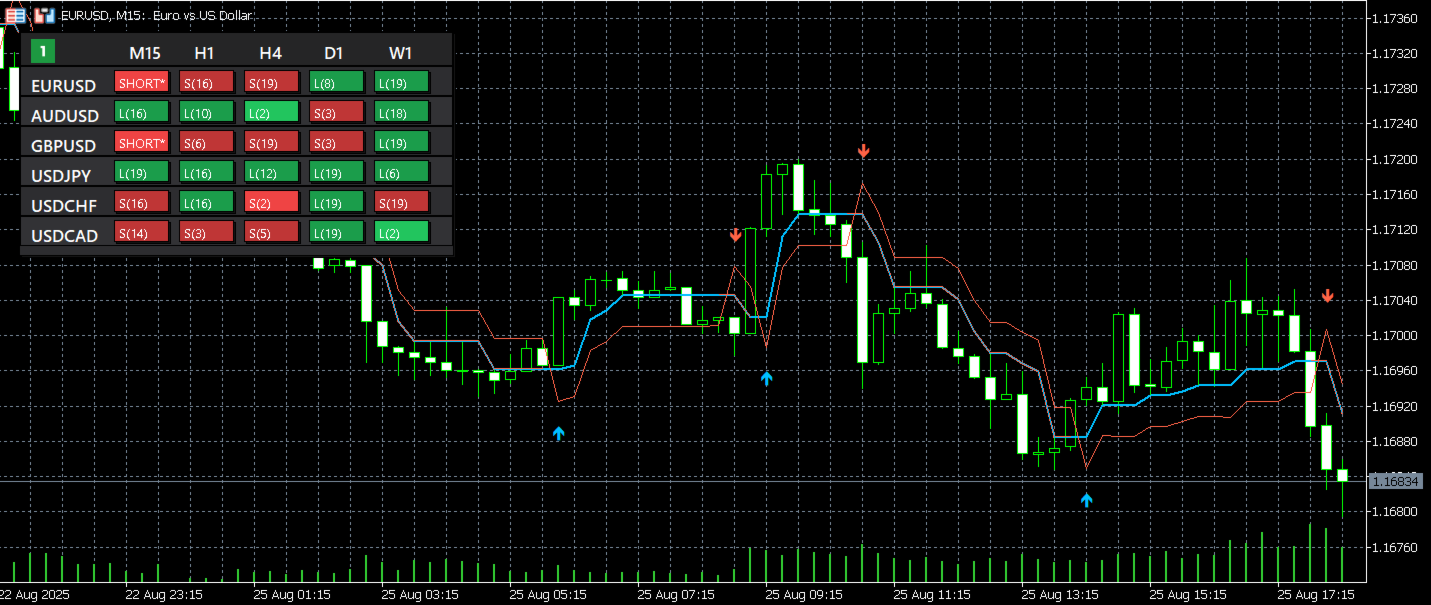
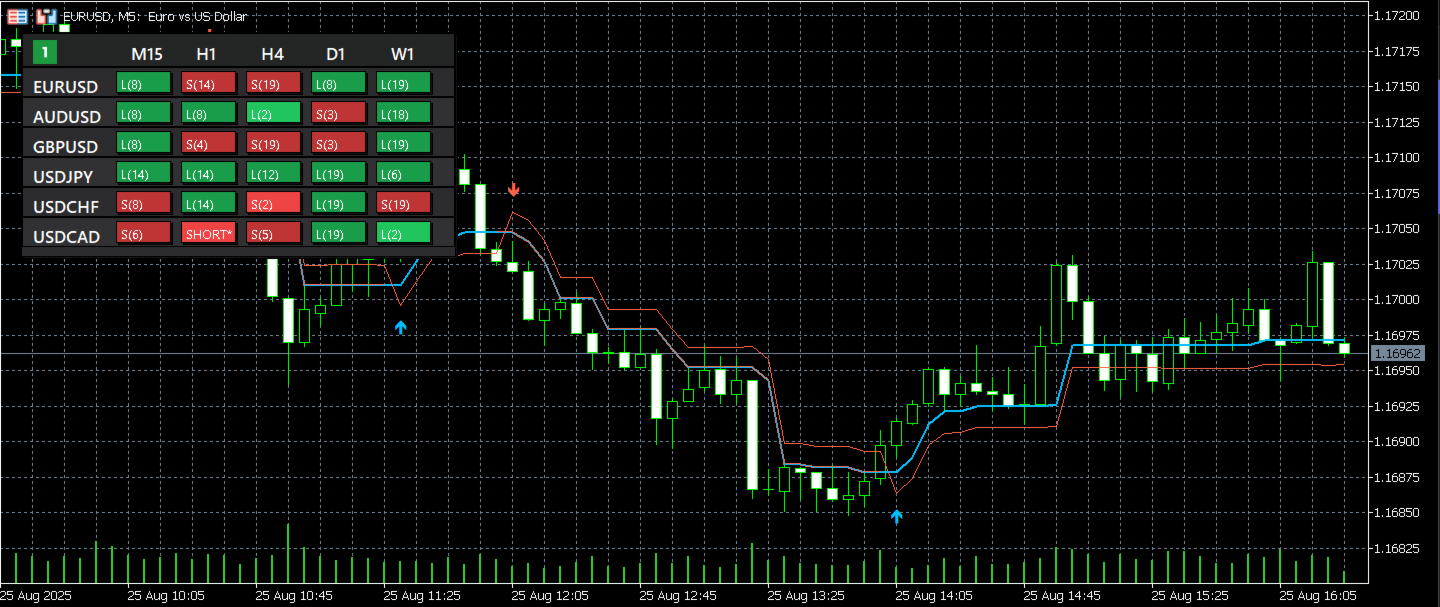
Sur le graphique, l'indicateur Gamma-Trend apparaît sous forme de lignes colorées qui changent selon la direction de la tendance : une couleur indique une tendance haussière, et une autre montre une tendance baissière. Il présente des niveaux de suivi qui suivent le mouvement des prix, fournissant des conseils continus pour la gestion des positions. L'indicateur inclut un panneau pratique qui affiche l'état actuel du signal et les informations de tendance en un coup d'œil.

Cette simplicité, peut-être, est la raison pour laquelle ses fans lui font confiance. Vous entrez simplement en position longue lorsque le signal de l'indicateur devient haussier et vous allez en position courte lorsque le signal de l'indicateur devient baissier. Les signaux de l'indicateur se présentent sous forme de flèches bleues et rouges. La flèche bleue vous indique quand entrer en position longue, et la flèche rouge vous indique quand entrer en position courte. Cependant, il est important de se rappeler que, comme la plupart des indicateurs de tendance, le Gamma-Trend fonctionne mieux dans des marchés à tendance claire et peut produire de faux signaux dans des marchés latéraux ou hautement volatils.

It shows true trend direction by ignoring small price fluctuation

Produits recommandés
CrossMaster PRO
Abderrahmane Benali
Powerful Alerts at Every Moving Average Crossover! Overview: CrossMaster PRO is a professional indicator designed to detect and notify you of precise crossover points between two customizable moving averages. Whether you're a scalper, swing trader, or long-term investor — this tool will give you the clarity and timing you need to enter and exit the market with confidence . Features:  Detects both bullish and bearish MA crossovers in real-time  Sends push notifications , pop-up alerts , and scre
"Manual channel drawing? Not anymore. Let the market structure reveal itself automatically." "Track long-term price zones 24/7, in real-time." Real Trader Pain Points Identifying pivot points manually takes   huge time   and   effort Difficult to adapt to   high volatility   and pinpoint   reliable channels Copy Ideas "Markets never sleep. Why should your analysis stop?" "Dozens of assets a day—how do you keep up?" Core Claim AutoChannels   automatically reads market structure , reducin
The TMA Centered Bands Indicator for MT5 draws bands on the chart and shows the overall price trend. It displays three bands - the lower and upper boundaries of the channel and the median.   The bands are made up of moving averages, and each of them has an MA period. The name TMA comes from triangular moving averages, as the indicator draws triangular bands.   The price will fluctuate between these ranges whenever the trend changes direction, thus creating entry and exit points.   How to trade
FREE
MasterCharts
Alexander Berger
You can think of these indicators as moving pivot points. MasterChartsTrading Price Action Indicators show good price levels to enter or exit a trade. The Blue indicator line serves as a Bullish Trend setter. If your instrument closes above the Blue line, we think about going Long (buying). When your trading instrument closes below the Red line, we think about Shorting (selling). It is very easy to read price action if you have a reference point. These support/resistance lines are there to help
BoS CHoCH Indicator
Usiola Oluwadamilol Olagundoye
The Expert Advisor for this Indicator can be found here: https://www.mql5.com/en/market/product/115445 The Break of Structure (BoS) and Change of Character indicator is a powerful tool designed to identify key turning points in price movements on financial charts. By analyzing price action, this indicator highlights instances where the market shifts from a trend to a potential reversal or consolidation phase. Utilizing sophisticated algorithms, the indicator identifies breakouts where the stru
A top and bottom indicator that can intuitively identify the trend of the band. It is the best choice for manual trading, without redrawing or drifting. Price increase of $20 every 3 days, price increase process: 79-->   99 --> 119...... Up to a target price of $1000. For any novice and programming trading friend, you can write the signal into the EA to play freely. Array 3 and array 4, for example, 3>4 turns green, 3<4 turns red. If you don't understand, please contact me. ====================P
Fibonacci Expansion Assistant Indicator for MetaTrader 5 The   Fibonacci Expansion Assistant Indicator for MetaTrader 5   is a specialized tool designed to streamline the application of Fibonacci Expansion levels within the MT4 platform. It allows traders to pinpoint critical price zones with greater precision and apply them effectively for setting profit targets and managing exit strategies. Precise Fibonacci Level Mapping   – This indicator calculates and displays exact expansion levels to hel
FREE
Highest High and Lowest Low (HH_LL) Indicator Description: The HH_LL Indicator is a trading tool designed to help traders identify key market points by automatically drawing Higher High (HH) and Lower Low (LL) lines across multiple timeframes. This indicator allows traders to easily spot significant levels on the chart, facilitating more accurate trading decisions. Key Features: Multi-Timeframe Analysis: The indicator supports various timeframes, including M30, H1, and H4. This enables traders t
FREE
A lot of professional traders use high quality divergence signals as a part of their strategy to enter a position. Spotting correct divergences quickly can often be hard, especially if your eye isn’t trained for it yet. For this reason we’ve created a series of easy to use professional oscillator divergence indicators that are very customisable so you get only the signals you want to trade. We have this divergence indicator for RSI, MACD, Stochastics, CCI and OBV. RSI:   https://www.mql5.com/en/
SMA Fibonacci EA
Christoph Kreher
Simple EA with 1 SMA and Fibonacci. The Expertadvisor opens positions in the direction of the trend when price levels have exceeded or fallen below the Fibonacci levels. It depends on the market in question and which parameters to use. The EA is programmed in such a way that optimization runs consume little time. A news filter and filter by day of the week are built in.
The indicator ‘Probability Range Bands’ gives a prediction of the amount, how much the asset is moving from its current price. The range bands give probabilities, that the candle close will not exceed this certain price level. It is also called the expected move for the current candle close.   This Indicator is based on statistical methods, probabilities and volatility. Asset price is assumed to follow a log-normal distribution. Therefore, log returns are used in this indicator to determine the
DYNAMIC SR TREND CHANNEL Dynamic SR Trend Channel is a simple indicator for trend detection as well as resistance/support levels on the current timeframe. It shows you areas where to expect possible change in trend direction and trend continuation. It works with any trading system (both price action and other trading system that use indicators) and is also very good for renko charting system as well. In an uptrend, the red line (main line) serves as the support and the blue line serves as the r
Indicator Description This indicator displays the highest and lowest prices for the previous day, week, and month. Additionally, it shows pivot levels calculated using different methods: Standard, Fibonacci, Woodie, Camarilla, and Floor pivots. Features: Previous Day High/Low: Indicates the highest and lowest prices of the previous trading day. Previous Week High/Low: Indicates the highest and lowest prices of the previous trading week. Previous Month High/Low: Indicates the highest and lowest p
If you are unsure how to use this indicator, please feel free to reach out to me. I will explain it to you and provide reading materials to help you make the most of it. TD Sequential Scanner: An Overview The TD Sequential scanner is a powerful technical analysis tool designed to identify potential price exhaustion points and trend reversals in financial markets. Developed by Tom DeMark, this method is widely used by traders to gauge market cycles and potential turning points with precision. Ho
First Dawn MT5
Innovicient Limited
The First Dawn indicator uses a unique mechanism to search and plot signals. This keeps searching for signals, making it a great indicator for scaping and identification of changes in direction, swing trading and trend trading. The    First Dawn     helps you get early signals. The backtest gives the true picture of how the indicator works with real/demo accounts. Although this is a tiny indicator it is packed with advantageous settings that will help you whether you desire to: Snap the Peaks a
High And Low MT5
Dmitriy Parfenovich
On the current chart, this indicator displays candlestick highs and lows of another time frame. Input Parameters: TimeFrame - chart time frame whose data will be displayed on the current price chart (by default, H12). Time Zone - shift of the indicator by time zone relative to the broker's time (by default, Broker-1). If the broker's time zone is UTC+1 and the Time Zone parameter is set to Broker-1, the bends of the indicator will be plotted in multiples of Greenwich Time. Indicator buffer value
ZigZag Triad Indicator for MetaTrader 5 The ZigZag Triad Indicator is a practical tool available on the MetaTrader 5 platform that plots ZigZag pivot points as support and resistance levels, enabling traders to identify key price reaction zones. Forex traders can utilize this indicator to conduct advanced technical analysis using ZigZag structures and professionally detect high-probability reaction areas in the market. «Indicator Installation & User Guide» MT5 Indicator Installation  |  ZigZag
FREE
ROC acceleration-deceleration is the manual system for medium-term scalping. Indicator based on custom ROC system which defines bullish/bearish market and especially  acceleration-deceleration of tendention in the market's main direction. Buy arrow is plotted during bearish market when current trend decelerates and sell  arrow is plotted during bullish market when current trend decelerates. Main Indicator's Features Signals are not repaint,non-late or disappear(exept cases when system recalculat
Hammer Star
Arkadii Zagorulko
This powerful tool is designed to help traders identify key reversal patterns in their charts, including the hammer and star bar formations. With this indicator, you can quickly and easily spot these patterns as they form, allowing you to make well-informed trades and potentially increase your profits. The Hammer Start indicator is customizable, allowing you to set your own parameters for identifying patterns and alerts. Whether you're a seasoned trader or just starting out, the Hammer and Star
FREE
Ultimate Hero MT5
Smart Forex Lab.
Construit pour une performance maximale. Optimisé pour les retraits de bénéfices. Introduction d'une nouvelle option - test avec émulation des retraits de bénéfices. Ultimate Hero est un outil de trading avancé conçu pour maximiser vos profits sur le marché des changes. Ce logiciel de trading avancé est créé en utilisant la dernière technologie GPT-4 et dispose d'une large gamme de fonctionnalités avancées. Ultimate Hero est un robot de trading qui utilise une stratégie de trading en grille ba
Triplet Cloud MTF is an indicator for trend-following strategy. It presents the trend in HTF from the LTF Chart that allows traders focus on looking for trade entry in the right direction and increase striking rate. It comes with simple input setup. You will only need to choose HTF you want to follow its trend and set the alert setup, then all is set. Here are the mostly selected HTF setup for each of entry timeframe: M1 Entry   : M15 Trend M5 Entry   : H1 Trend M15 Entry   : H4 Trend H1 Entry  
Introducing the 'No Nonsense Reversal Megaprofits' indicator for MetaTrader 5 (MT5), your ultimate tool for identifying trend reversals with precision and confidence. This powerful indicator is designed to cut through the noise of the markets and pinpoint crucial turning points with ease. Powered by advanced algorithms, 'No Nonsense Reversal Megaprofits' analyzes price action and key market dynamics to accurately detect when a trend is about to reverse. Whether you're a novice trader or a season
My Point MT5
Claudia Ramona Angerer
Diagnosis of major and minor pivot Trend detection with many signals Can be used in all symbols Can be used in all time frames Settings: Back Show: The number of candles it displays If you need any adjustments, or have any questions or suggestions, message me How to trade: Blue: sell signal Red: buy signal Blue and red at the same time: no signal Exit signal: Opposite signal
SWing3
AHMED ABULFATEH
5 (5)
Signaux de trading précis à 98 % Entrées précises, sorties claires | Multi-périodes | Tous marchés Fonctionnement en 3 étapes simples 1️⃣ ENTRÉE EN TRANSACTION (Règles d'achat/vente) Déclenchement du signal : Deux lignes (X) se croisent en dehors de la zone colorée (rouge pour l'achat, bleu pour la vente). Confirmation : La bougie de prix doit toucher le croisement (pendant ou dans les 1 à 5 bougies qui suivent). Entrée alternative (sans contact) : Signal de vente (zone bleue) : Le prix rest
Signal Eskiya, in addition to channel lines, reflects entry signals in the form of arrows. Trading strategies using the channel indicator belong to the classic methods of technical analysis, are easy to execute, and therefore available even to beginners. Price ranges work equally well on any trading assets and timeframes, they can be used both independently and with additional confirmation from oscillators and market volumes. American traders say: “Trend is your friend”, which means “Trend is
Market session with fibonacci
Batsukh Sumchin Khuyagbaatar
Cet indicateur est l'indicateur le plus courant que nous utilisons quotidiennement, y compris nos stratégies les plus utilisées, ICT et SMC, les limites de stop loss et les limites de liquidité qui se produisent aux heures d'ouverture et de fermeture des échanges, ainsi que le volume des échanges avec Fibonacci et le zoom avant et arrière, et les actions les plus courantes que vous souhaitez voir, telles que la sélection du mouvement d'échange que vous souhaitez voir et le tirage de Fibonacci, s
Description: The Wall of Worry indicator allows you to assess market sentiment and possible reversals. The indicator represents three lines that are displayed in a separate window. Black line (trend) - the amount of volumes in the candle body. Red line (bears) - the amount of volumes in the upper shadow of the candlestick. Blue line (bulls) - the amount of volumes in the lower shadow of the candle. The idea is based on "Wall of Worry" - this is the periodic tendency of financial markets to
Visual Dragon Cloud Indicator
AL MOOSAWI ABDULLAH JAFFER BAQER
The Visual Dragon Cloud Indicator is a powerful and unique tool designed to provide traders with deep insights into market behavior. Priced at $65, it offers a robust framework for understanding price dynamics through its sophisticated strategy, while allowing users to optimize and customize it to fit their unique trading styles. Please note: this indicator is not optimized and is intentionally crafted for you to fine-tune it for your personal trading approach. Strategy and Logic Behind the Ind
Boom Rocket
Cairo Neto Sergio Ndava
This Expert Advisor is designed exclusively for trading the Boom market on the 1-minute timeframe. It operates solely in the sell direction, focusing on precise exits at specific moments in time. Unlike typical signal bots, this EA doesn’t generate buy/sell alerts but executes trades based on a well-defined strategy to take advantage of price movements during market pullbacks. Key Features: Works exclusively for Boom market : The EA is tailored for Boom markets and functions only on the Boom as
L'indicateur aide à entrer dans un commerce en suivant la tendance, en même temps, après une certaine correction. Il trouve de forts mouvements de tendance d'une paire de devises sur un nombre donné de barres, et trouve également des niveaux de correction à cette tendance. Si la tendance est suffisamment forte et que la correction devient égale à celle spécifiée dans les paramètres, l'indicateur le signale. Vous pouvez définir différentes valeurs de correction, les valeurs de 38, 50 et 62 (nive
Les acheteurs de ce produit ont également acheté
Divergence Bomber
Ihor Otkydach
4.98 (61)
Chaque acheteur de cet indicateur reçoit également gratuitement : L’outil exclusif « Bomber Utility », qui accompagne automatiquement chaque opération de trading, fixe les niveaux de Stop Loss et de Take Profit, et clôture les positions selon les règles de la stratégie Des fichiers de configuration (set files) pour adapter l’indicateur à différents actifs Des set files pour configurer le Bomber Utility selon différents modes : « Risque Minimum », « Risque Équilibré » et « Stratégie d’Attente » U
Grabber System MT5
Ihor Otkydach
5 (15)
Je vous présente un excellent indicateur technique : Grabber, qui fonctionne comme une stratégie de trading "tout-en-un", prête à l'emploi. En un seul code sont intégrés des outils puissants d'analyse technique du marché, des signaux de trading (flèches), des fonctions d'alerte et des notifications push. Chaque acheteur de cet indicateur reçoit également gratuitement : L'utilitaire Grabber : pour la gestion automatique des ordres ouverts Un guide vidéo étape par étape : pour apprendre à installe
Trend indicator AI mt5
Ramil Minniakhmetov
5 (7)
L'indicateur Trend Ai est un excellent outil qui améliorera l'analyse du marché d'un trader en combinant l'identification des tendances avec des points d'entrée exploitables et des alertes d'inversion. Cet indicateur permet aux utilisateurs de naviguer dans les complexités du marché forex avec confiance et précision Au-delà des signaux primaires, l'indicateur Trend Ai identifie les points d'entrée secondaires qui surviennent lors des retraits ou des retracements, permettant aux traders de capit
Quantum TrendPulse
Bogdan Ion Puscasu
5 (13)
Présentation de   Quantum TrendPulse   , l'outil de trading ultime qui combine la puissance de   SuperTrend   ,   RSI   et   Stochastic   dans un seul indicateur complet pour maximiser votre potentiel de trading. Conçu pour les traders qui recherchent précision et efficacité, cet indicateur vous aide à identifier les tendances du marché, les changements de dynamique et les points d'entrée et de sortie optimaux en toute confiance. Caractéristiques principales : Intégration SuperTrend :   suivez f
AriX
Temirlan Kdyrkhan
1 (1)
AriX Indicator for MT5 A powerful trend-following and signal-evaluation tool AriX is a custom MT5 indicator that combines Moving Averages and ATR-based risk/reward logic to generate clear buy/sell signals. It visualizes dynamic SL/TP levels, evaluates past trade outcomes, and displays win/loss statistics in a clean on-chart panel. Key features include: Buy/Sell signals based on MA crossovers ATR-based SL/TP1/TP2/TP3 levels with visual lines and labels Signal outcome tracking with real-time stat
Entry In The Zone and SMC Multi Timeframe est un outil d’analyse de marché en temps réel développé sur la base du cadre Smart Money Concepts (SMC). Il analyse automatiquement les points de retournement et les zones clés sur plusieurs périodes, en mettant l’accent sur la fourniture de signaux sans repaint et en mettant en évidence les Points d’Intérêt (POI). De plus, il dispose d’un système de niveaux Fibonacci automatiques qui trace automatiquement les lignes de Fibonacci pour aider à détecter
ARIPoint
Temirlan Kdyrkhan
ARIBot is a powerful trading companion designed to generate high-probability entry signals with dynamic TP/SL/DP levels based on volatility. Built-in performance tracking shows win/loss stats, PP1/PP2 hits, and success rates — all updated live. Key Features: Buy/Sell signals with adaptive volatility bands Real-time TP/SL/DP levels based on ATR Built-in MA Filter with optional ATR/StdDev volatility Performance stats panel (Success, Profit/Loss, PP1/PP2) Alerts via popup, sound, push, or email Cus
Combien de fois avez-vous acheté un indicateur de trading avec d' excellents backtests, des preuves de performance sur compte réel avec des chiffres fantastiques et des statistiques partout , mais après l'avoir utilisé, vous finissez par faire sauter votre compte ? Vous ne devriez pas faire confiance à un signal seul, vous devez savoir pourquoi il est apparu en premier lieu, et c'est ce que RelicusRoad Pro fait de mieux ! Manuel d'utilisation + Stratégies + Vidéos de formation + Groupe privé ave
Matrix Arrow Indicator MT5
Juvenille Emperor Limited
5 (14)
Matrix Arrow Indicator MT5   est une tendance unique 10 en 1 suivant un indicateur multi-période   100% non repeint   qui peut être utilisé sur tous les symboles/instruments:   forex ,   matières premières ,   crypto-monnaies ,   indices ,  actions .  Matrix Arrow Indicator MT5  déterminera la tendance actuelle à ses débuts, en rassemblant des informations et des données à partir d'un maximum de 10 indicateurs standard, qui sont: Indice de mouvement directionnel moyen (ADX) Indice de canal de m
FX Volume MT5
Daniel Stein
4.84 (19)
FX Volume : Découvrez le Sentiment du Marché tel que perçu par un Courtier Présentation Rapide Vous souhaitez faire passer votre approche de trading au niveau supérieur ? FX Volume vous fournit, en temps réel, des informations sur la manière dont les traders particuliers et les courtiers sont positionnés—bien avant la publication de rapports retardés comme le COT. Que vous visiez des gains réguliers ou recherchiez simplement un avantage plus solide sur les marchés, FX Volume vous aide à repére
TPSproTREND PrO MT5
Roman Podpora
4.64 (14)
VERSION MT4        —        ИНСТРУКЦИЯ RUS           —        INSTRUCTIONS  ENG Fonctions principales : Signaux d'entrée précis SANS RENDU ! Si un signal apparaît, il reste d’actualité ! Il s'agit d'une différence importante par rapport aux indicateurs de redessinage, qui peuvent fournir un signal puis le modifier, ce qui peut entraîner une perte de fonds en dépôt. Vous pouvez désormais entrer sur le marché avec plus de probabilité et de précision. Il existe également une fonction de coloration
ACB Breakout Arrows MT5
KEENBASE SOFTWARE SOLUTIONS
5 (1)
L’indicateur ACB Breakout Arrows fournit un signal d’entrée crucial sur le marché en détectant un modèle de rupture spécifique. Il analyse en continu le graphique à la recherche d’un momentum établi dans une direction et déclenche un signal précis juste avant le mouvement principal. Obtenez le scanner multi-actifs et multi-unités de temps ici - Scanner pour ACB Breakout Arrows MT5 Fonctionnalités principales Les niveaux de Stop Loss et Take Profit sont fournis par l’indicateur. Inclut un table
Owl Smart Levels MT5
Sergey Ermolov
3.93 (30)
Version MT4   |  FAQ L' indicateur Owl Smart Levels est un système de trading complet au sein d'un seul indicateur qui comprend des outils d'analyse de marché populaires tels que les fractales avancées de Bill Williams , Valable ZigZag qui construit la structure d'onde correcte du marché et les niveaux de Fibonacci qui marquent les niveaux exacts d'entrée. sur le marché et les endroits où prendre des bénéfices. Description détaillée de la stratégie Mode d'emploi de l'indicateur Conseiller-Assis
Algo Pumping
Ihor Otkydach
4.74 (19)
PUMPING STATION – Votre stratégie personnelle «tout compris» Nous vous présentons PUMPING STATION – un indicateur Forex révolutionnaire qui transformera votre façon de trader en une expérience à la fois efficace et passionnante. Ce n’est pas seulement un assistant, mais un véritable système de trading complet, doté d’algorithmes puissants pour vous aider à trader de manière plus stable. En achetant ce produit, vous recevez GRATUITEMENT : Fichiers de configuration exclusifs : pour un réglage auto
PZ Swing Trading MT5
PZ TRADING SLU
5 (5)
Protect against whipsaws: revolutionize your swing trading approach Swing Trading is the first indicator designed to detect swings in the direction of the trend and possible reversal swings. It uses the baseline swing trading approach, widely described in trading literature. The indicator studies several price and time vectors to track the aggregate trend direction and detects situations in which the market is oversold or overbought and ready to correct. [ Installation Guide | Update Guide | Tro
TPSpro RFI Levels MT5
Roman Podpora
4.47 (17)
Zones de retournement - niveaux / Zones actives d'un acteur majeur INSTRUCTIONS RUS   /   INSTRUCTIONS   ENG   /   Version MT4 CHAQUE ACHETEUR DE CET INDICATEUR       OBTENEZ EN PLUS   GRATUITEMENT   : 3 mois       accès aux signaux de trading du service       SUPER SIGNAUX       — points d’entrée prêts à l’emploi selon l’algorithme TPSproSYSTEM. 3 mois       accès à des supports de formation avec des mises à jour régulières - immersion dans la stratégie et la croissance professionnelle. Assist
Trend Forecaster
Alexey Minkov
5 (7)
The Trend Forecaster indicator utilizes a unique proprietary algorithm to determine entry points for a breakout trading strategy. The indicator identifies price clusters, analyzes price movement near levels, and provides a signal when the price breaks through a level. The Trend Forecaster indicator is suitable for all financial assets, including currencies (Forex), metals, stocks, indices, and cryptocurrencies. You can also adjust the indicator to work on any time frames, although it is recommen
Top indicator for MT5   providing accurate signals to enter a trade without repainting! It can be applied to any financial assets:   forex, cryptocurrencies, metals, stocks, indices .  Watch  the video  (6:22) with an example of processing only one signal that paid off the indicator! MT4 version is here It will provide pretty accurate trading signals and tell you when it's best to open a trade and close it. Most traders improve their trading results during the first trading week with the help of
Introduction to X3 Chart Pattern Scanner X3 Cherart Pattern Scanner is the non-repainting and non-lagging indicator detecting X3 chart patterns including Harmonic pattern, Elliott Wave pattern, X3 patterns, and Japanese Candlestick patterns. Historical patterns match with signal patterns. Hence, you can readily develop the solid trading strategy in your chart. More importantly, this superb pattern scanner can detect the optimal pattern of its kind. In addition, you can switch on and off individu
FX Levels MT5
Daniel Stein
5 (7)
FX Levels : Des zones de Support et Résistance d’une Précision Exceptionnelle pour Tous les Marchés Présentation Rapide Vous recherchez un moyen fiable pour déterminer des niveaux de support et résistance dans n’importe quel marché—paires de devises, indices, actions ou matières premières ? FX Levels associe la méthode traditionnelle « Lighthouse » à une approche dynamique de pointe, offrant une précision quasi universelle. Grâce à notre expérience réelle avec des brokers et à des mises à jour
FX Power MT5 NG
Daniel Stein
5 (17)
FX Power : Analysez la force des devises pour des décisions de trading plus intelligentes Aperçu FX Power est l'outil essentiel pour comprendre la force réelle des principales devises et de l'or, quelles que soient les conditions du marché. En identifiant les devises fortes à acheter et les faibles à vendre, FX Power simplifie vos décisions de trading et révèle des opportunités à forte probabilité. Que vous suiviez les tendances ou anticipiez les retournements à l'aide de valeurs extrêmes de D
Easy Breakout MT5
Mohamed Hassan
4.6 (5)
After your purchase, feel free to contact me for more details on how to receive a bonus indicator called VFI, which pairs perfectly with Easy Breakout for enhanced confluence!    Easy Breakout MT5   is a powerful price action trading system built on one of the most popular and widely trusted strategies among traders: the   Breakout strategy ! This indicator delivers crystal-clear Buy and Sell signals based on breakouts from key support and resistance zones. Unlike typical breakout indicators
Gartley Hunter Multi
Siarhei Vashchylka
5 (11)
Gartley Hunter Multi - An indicator for searching for harmonic patterns simultaneously on dozens of trading instruments and on all possible timeframes. Manual (Be sure to read before purchasing) | Version for MT4 Advantages 1. Patterns: Gartley, Butterfly, Shark, Crab. Bat, Alternate Bat, Deep Crab, Cypher 2. Simultaneous search for patterns on dozens of trading instruments and on all possible timeframes 3. Search for patterns of all possible sizes. From the smallest to the largest 4. All fou
IQ Gold Gann Levels a non-repainting, precision tool designed exclusively for XAUUSD/Gold intraday trading. It uses W.D. Gann’s square root method to plot real-time support and resistance levels, helping traders spot high-probability entries with confidence and clarity. William Delbert Gann (W.D. Gann) was an exceptional market analyst, whose trading technique was based on a complex blend of mathematics, geometry, astrology, and ancient mathematics which proved to be extremely accurate. Download
Ce tableau de bord affiche les derniers   modèles harmoniques   disponibles pour les symboles sélectionnés, ce qui vous permettra de gagner du temps et d'être plus efficace /   version MT4 . Indicateur gratuit:   Basic Harmonic Pattern Colonnes de l'indicateur Symbol :   les symboles sélectionnés apparaissent Trend   :   haussière ou baissière Pattern :   type de motif (gartley, papillon, chauve-souris, crabe, requin, cypher ou ABCD) Entry:   prix d'entrée SL:   prix du stop loss TP1:   1er
Atbot
Zaha Feiz
4.71 (45)
AtBot : Comment ça fonctionne et comment l'utiliser ### Comment ça fonctionne L'indicateur "AtBot" pour la plateforme MT5 génère des signaux d'achat et de vente en utilisant une combinaison d'outils d'analyse technique. Il intègre la Moyenne Mobile Simple (SMA), la Moyenne Mobile Exponentielle (EMA) et l'indice de la Plage Vraie Moyenne (ATR) pour identifier les opportunités de trading. De plus, il peut utiliser des bougies Heikin Ashi pour améliorer la précision des signaux. Laissez un avis ap
Introducing the POWER TRADE indicator created by a small group of traders with a few years trading trading the financial market profitably . This is a plug and play indicator that provides you with  POWERFUL Entry signals with Profit Taking and rebound zones. The indicator Works with all MT5 trading instruments. The indicator uses previous  chart data as receipt to speculate on future market moves.
Bill Williams Advanced
Siarhei Vashchylka
5 (10)
Bill Williams Advanced is designed for automatic chart analysis using Bill Williams' "Profitunity" system. The indicator analyzes four timeframes at once. Manual (Be sure to read before purchasing) Advantages 1. Automatically analyzes the chart using the "Profitunity" system of Bill Williams. The found signals are placed in a table in the corner of the screen. 2. Equipped with a trend filter based on the Alligator indicator. Most of the system signals are recommended to be used only according t
Présentation       Quantum Breakout PRO   , l'indicateur révolutionnaire MQL5 qui transforme la façon dont vous négociez les zones d'évasion ! Développé par une équipe de traders expérimentés avec une expérience commerciale de plus de 13 ans,       Évasion quantique PRO       est conçu pour propulser votre parcours commercial vers de nouveaux sommets grâce à sa stratégie de zone de discussion innovante et dynamique. Quantum Breakout Indicator vous donnera des flèches de signalisation sur les z
MP TPO Heatmap — Market Profile (TPO) with VAH/VAL/POC/IB Market Profile is a way to visualize how price accepts or rejects value within a session. Instead of averaging, it counts how often price traded at each level during equal-time “brackets.” The result is a distribution you can read at a glance: thick areas = acceptance; thin edges = rejection. This indicator implements a TPO-based Market Profile with clean session lines (POC, VAH, VAL, IBH, IBL) and a fast, two-tone heatmap cloud that high
Plus de l'auteur
Gamma Silver Stuff
Arinze Michael Ejike
Silver Stuff identifie les changements clairs de direction de tendance avec des signaux d'entrée précis. Affiche des lignes vertes pour les opportunités longues et des lignes rouges pour les configurations courtes. Le système d'alertes intégré vous notifie instantanément lors de l'apparition de nouveaux signaux de tendance. Options d'Alertes: Alertes de Barre Actuelle (alertsOnCurrent = true): se déclenchent immédiatement mais peuvent se redessiner Alertes de Barre Confirmée (alertsOnCurrent = f
L'Indicateur de Pression Acheteurs-Vendeurs affiche le sentiment du marché sur plusieurs timeframes de M1 à D1. Il calcule les pourcentages de pression d'achat et de vente en utilisant une analyse de momentum de moyennes mobiles sur une période configurable. Le panneau visuel montre des barres de progression avec la force acheteuse en sarcelle et la dominance vendeuse en rouge, accompagnées de valeurs en pourcentage lorsque significatives. Chaque timeframe inclut une mesure de force de tendance
Filtrer:
Aucun avis
Répondre à l'avis