
Testing trading strategies on real ticks

The article provides the results of testing a simple trading strategy in three modes: "1 minute OHLC" using only Open, High, Low and Close prices of minute bars; detailed modeling in "Every tick" mode, as well as the most accurate "Every tick based on real ticks" mode applying actual historical data.
Comparing the results allows us to assess the quality in various modes, as well as helps us to use the tester more efficiently in order to receive results faster. "1 minute OHLC" mode allows receiving quick estimated test results, "Every tick" mode is closer to reality, while testing on real ticks is most accurate but time-consuming. Keep in mind that errors in a trading robot's logic may affect the number of trading operations making the strategy test results more susceptible to a selected test mode.
Trading strategy
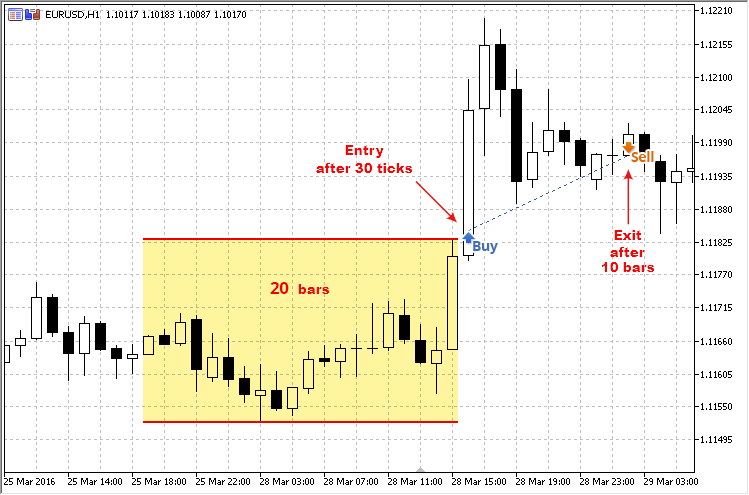
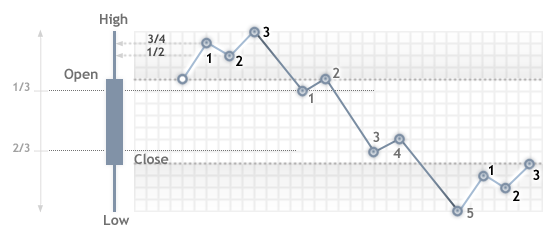
We have developed a simple trading strategy based on a range breakthrough within the last RangeLength bars. The trading rules are as follows: a range of the highest and lowest prices for the last N bars is calculated at the opening of a new bar. The default value of RangeLength parameter of the attached EA is 20 bars. It stands for the width of the window where we build the range.
After the first breakthrough of the range up- or downwards, the statistics on the incoming ticks starts accumulating (number of ticks above and below the broken range level). As soon as the number of incoming ticks exceeds (or is equal to) TicksForEnter=30, a decision on entering the market at the current price is made. If the range is broken upwards, the number of ticks above the breakout level should exceed the number of ticks below the level. In this case, the EA opens a long position. The opposite case leads to a short position.
An open position is closed after BarsForExit bars. As you can see, the rules are quite simple. See the screenshot below for more clarity:
Now, let's see how the EA test results change when applying one of the three different tick modeling modes.
Testing
The trading strategy has been tested on EURUSD H1 on the first half of 2016 – from 01.01.2016 to 30.06.2016. All EA parameters are set to default values since our objective is to simply test the strategy in different modeling modes.
Comparing results of different test modes
Test results in different modes are displayed in the table. The first thing that catches the eye is the difference in the number of trading operations. Thus, all other test results are also different. Testing in "1 minute OHLC" took 1.57 seconds which is 23 times faster than in "Every tick" mode. Such a difference is important when optimizing the trading system inputs.
In its turn, the mode "Every tick based on real ticks" has turned out to be even more time-consuming – 74 seconds as compared to 36.7 seconds in "Every tick" mode. This can be easily explained by the fact that more than 34 million ticks have been modeled when using real ticks which is almost two times more than in "Every tick" mode. Thus, the more ticks are used in tests, the more time is required for one pass in the strategy tester.
| Parameter |
1 minute OHLC |
Every tick |
Every tick based on real ticks |
|---|---|---|---|
| Ticks |
731 466 |
18 983 485 |
34 099 141 |
| Net profit |
169.46 | -466.81 |
-97.24 |
| Trades |
96 |
158 | 156 |
| Deals |
192 |
316 | 312 |
| Equity drawdown % |
311.35 (3.38%) |
940.18 (9.29%) |
625.79 (6.07%) |
| Balance drawdown | 281.25 (3.04%) |
882.58 (8.76) |
591.99 (5.76%) |
| Profitable trades (%) |
50 (52.08%) | 82 (51.90%) | 73 (46.79%) |
| Average consecutive wins |
2 |
2 |
2 |
| Testing time including tick generation time |
1.6 seconds |
36.7 seconds |
74 seconds (1 minute 14 seconds) |
Test reports of various modeling modes are displayed below as animated GIF images allowing you to compare the parameters.
The balance and equity graphs are different as well. As we can see, this simple strategy is not impressive – growth periods are followed by drawdowns and the test graphs look more like a chain of coincidences. The strategy is certainly not suitable for real trading since results are similar to a coin toss.
Trading systems depending on ticks
The trading system we have presented is highly dependent on the modeling method – namely, a number of incoming ticks and an order of their arrival. When testing in "1 minute OHLC" mode, we have the least number of ticks which may be insufficient for opening a position. "Every tick" and "Every tick based on real ticks" modes may have quite a different order of ticks arrival. In case of "Every tick" mode, we may receive a monotonically increasing or monotonically decreasing sequence of ticks that virtually guarantees a market entry after the range is broken through. In case of "Every tick based on real ticks" mode, the history of real ticks is used making the price dynamics behave unexpectedly.
Thus, we can see that the entry and exit points are different on the charts even at the beginning of the testing interval. Also, some trades are skipped.
Four tick generation modes
MetaTrader 5 strategy tester allows checking trading strategies in four tick modeling modes described in the article "The Fundamentals of Testing in MetaTrader 5". The fastest and most rough mode is "Open prices only", at which trading operations can be performed only at the opening of a new bar. No trading actions inside bars are available. The mode is most suitable for testing strategies that are not dependent on the price movements inside bars.
"1 minute OHLC" mode is a bit more accurate since it uses modeling of Open, High, Low and Close prices of each minute bar included into the tested history range. This means that when testing on H1, the EA will be called 240 times within an hour: at each of 60 minute bars, the OnTick() handler will be called 4 times (for each of OHLC prices). This mode already makes possible the usage of Trailing Stop and viewing the price dynamics on other timeframes and indicators if necessary (for example, when testing the Elder's Triple Screen strategy).
These two modes are suitable for testing a large set of trading strategies, since most traders develop robots for trading at a new bar opening. However, if you need to conduct a more accurate and detailed modeling of the incoming ticks, you will need "Every tick" mode. In this mode, the price behavior within each minute bar is additionally modeled. The ticks are generated according to complex (but predefined) laws. The price modeling mechanism for this mode is described in details in the article "The Algorithm of Ticks' Generation within the Strategy Tester of the MetaTrader 5 Terminal".
If you need the most accurate representation of history data in the strategy tester, use "Every tick based on real ticks" mode. In this mode, the tester downloads real ticks from a broker's trade server and uses them to display the price development. In case real ticks are absent for some time intervals, the tester simulates the price just like in the "Every tick" mode. Thus, if the broker has all history of the required symbols, you can perform testing of real historical data without artificial modeling. The drawback of the mode is a significant increase in test time as shown in the comparison table above.
Start developing a system with "1 minute OHLC" mode
As you can see, it is impossible to win at all aspects simultaneously – if we want to quickly check a trading idea without spending too much time, then we need to sacrifice the accuracy using simple price simulation modes. If the accuracy of entry prices and sequence of trading signals are critical, we need to use accurate modes requiring more time.
Before testing a trading strategy, you should keep in mind that a price simulation mode you are going to select will affect the accuracy of results and amount of time spent in order to obtain them. If you need to quickly check and assess a trading strategy, use "1 minute OHLC" mode. It will allow you to evaluate the trading system potential in no time.
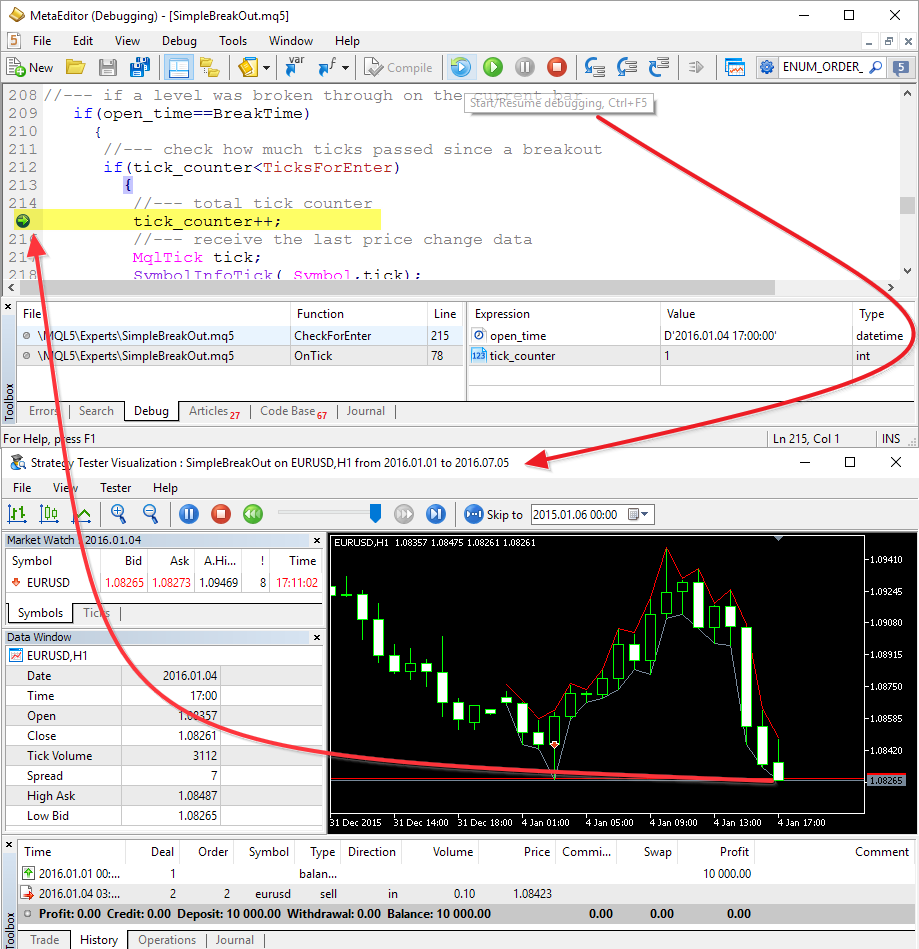
Next step – debugging and "Every tick" mode
If preliminary results are satisfactory, you can continue debugging and analyzing the trading system using more accurate simulation modes. Here is where the strategy debugging in test mode comes in handy allowing you to set breakpoints and check the status of variables as well as execution of built-in conditions. You may stumble upon unpleasant surprises here if you have not considered some nuances of your system beforehand.
Accuracy vs speed
As we can see from the test results in three modes, traders can and should select a tick modeling mode that is most suitable to their trading strategies. If you test your system on a daily timeframe, "Open prices only" mode will most probably suit you best since the high test speed will not interfere with the obtained results.
If you are developing a scalping or arbitrage strategy or if your algorithm is based on indices or real-time synthetic indicators, then you will need "Every tick based on real ticks" mode. Testing will be much more time-consuming but you will obtain the results as close to reality as possible. Keep in mind though that history never repeats itself. Even the most thoroughly selected inputs cannot guarantee success when launching an EA on a real account.
Between the mentioned modes, there are "1 minute OHLC" and "Every tick" modes that are faster and less accurate than "Every tick based on real ticks". Thus, we can formulate the rule describing testing time and accuracy:
The faster the test, the lower the trading simulation accuracy. The higher the price development accuracy, the more time is required to conduct a test.
Trading servers accumulate real tick history for many years, and the MetaTrader 5 strategy tester is capable of downloading it automatically in "Every tick based on real ticks" mode. However, the more reliable the test, the more resources it requires. Therefore, you should always strike a balance between accuracy and speed.
Not all strategies require detailed modeling at the initial stages of development. Reasonable choice of a testing mode will save your time and sort out a large number of unsuitable strategies!
After solving the main task (developing a profitable automated trading system), you can optimize it on real ticks. At this point, the power of MQL5 Cloud Network may come in handy.
Translated from Russian by MetaQuotes Ltd.
Original article: https://www.mql5.com/ru/articles/2612
Warning: All rights to these materials are reserved by MetaQuotes Ltd. Copying or reprinting of these materials in whole or in part is prohibited.

 Graphical Interfaces VIII: The Calendar Control (Chapter 1)
 The checks a trading robot must pass before publication in the Market
- Free trading apps
- Over 8,000 signals for copying
- Economic news for exploring financial markets
You agree to website policy and terms of use
On the last image with the screen of the tester, straight line segments are drawn at the highs and lows of candlesticks. The highs are red and the lows are grey. Can we find out what it is? It doesn't look like indicators, if they are ordinary graphical objects, what is their meaning in this case?
Tried to test on real ticks.
I did not understand which price is real - Bid or Ask ?
There is no doubt that one of them is real.
But where is the other one?
It looks like Ohlc is not really an Ohlc price but the price of 4 time points, namely the price of 0 seconds, 20 seconds, 40 seconds and 59 seconds.
Perhaps it is better to call the price 4 points in 1 minute not 1 minute ohlc. because there are many misunderstandings including those who wrote this article ==> "1 minute OHLC" using only Open, High, Low and Close prices of minute bars;
10$ threw in, started up, eventually after 5 minutes went to -49$ The system absolutely does not take into account what balance, they claim to reserve money and so on, as it is not known how long the process will take, okay it is interrupted at once automatically, but they do not return the money after the reservation, they do not even balance is not calculated discrepancies in cents.