Main currency pairs Spread RSI
- Indicadores
- Versión: 3.8
- Actualizado: 25 abril 2020
- Activaciones: 5

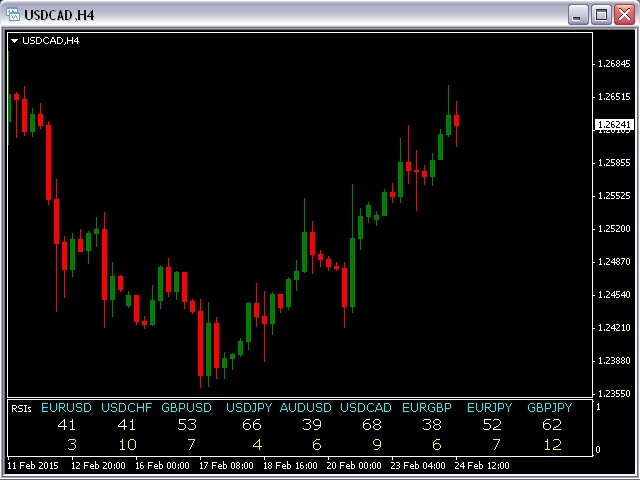
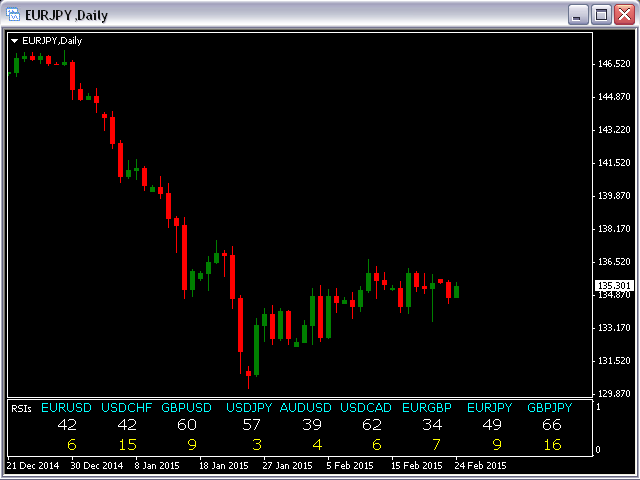
Cuando el precio se mueve rápidamente hacia arriba/abajo, la mayoría de los brokers aumentan el Spread.
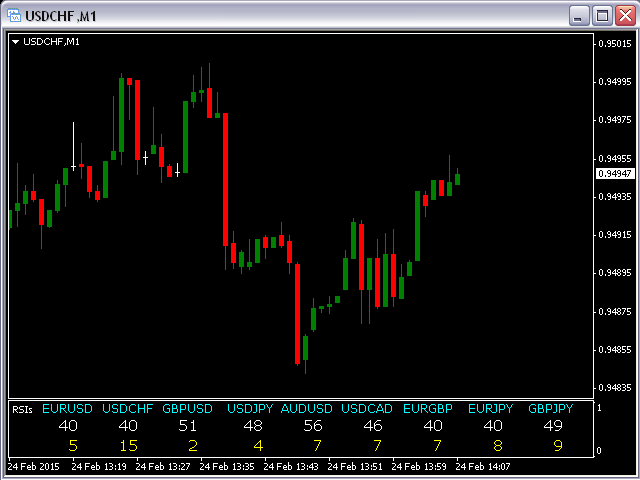
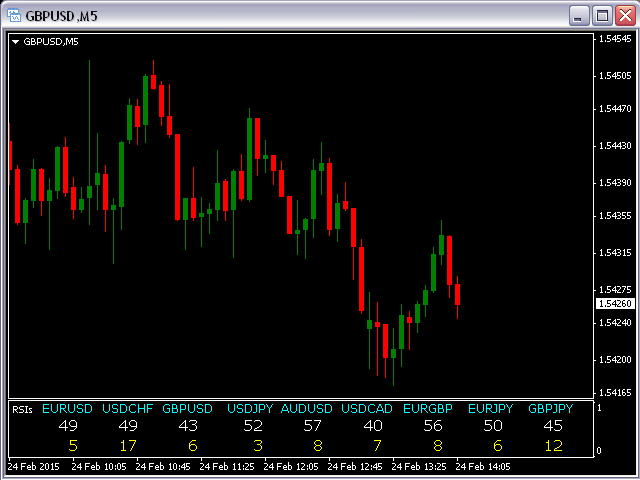
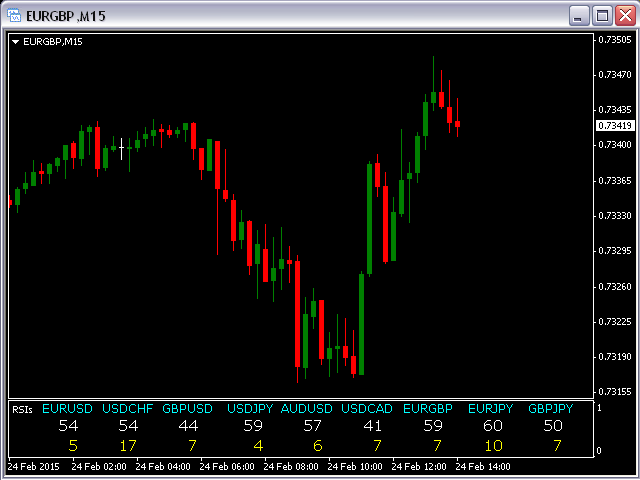
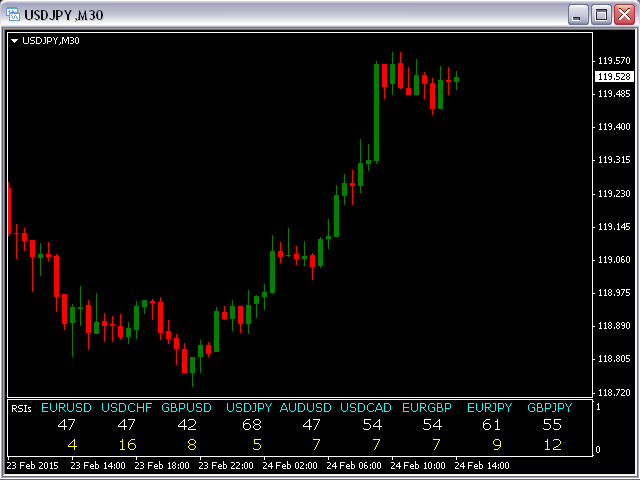
Este indicador mostrará el Spread para 9 pares de divisas de su elección(dígitos amarillos) - usted permite cambiar todos los parámetros de entrada, incluyendo el cambio de nombre de los pares de divisas.
Este indicador también muestra el indicador clásico RSI (Relative Strength Index) para los pares de divisas definidos y será útil para aquellos que aman y saben cómo utilizar no una representación visual, sino digital del indicador.