Main currency pairs Spread RSI
- Indikatoren
- Version: 3.8
- Aktualisiert: 25 April 2020
- Aktivierungen: 5

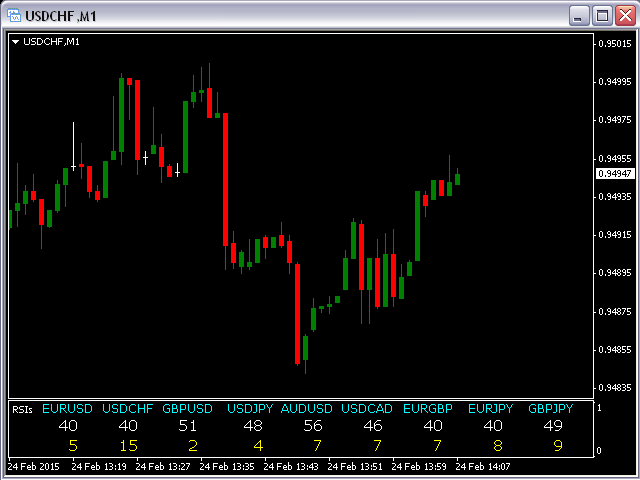
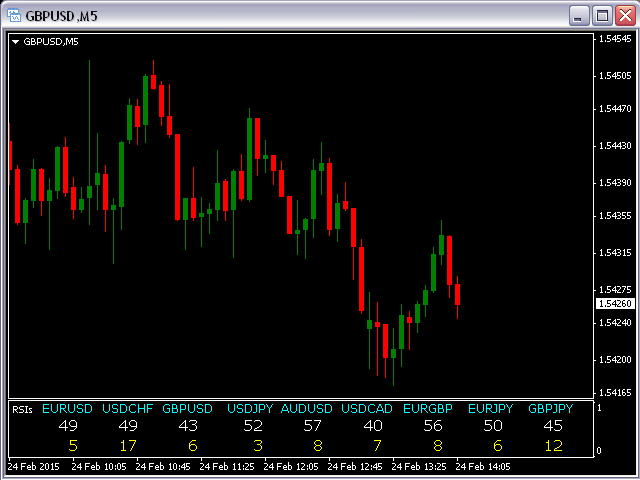
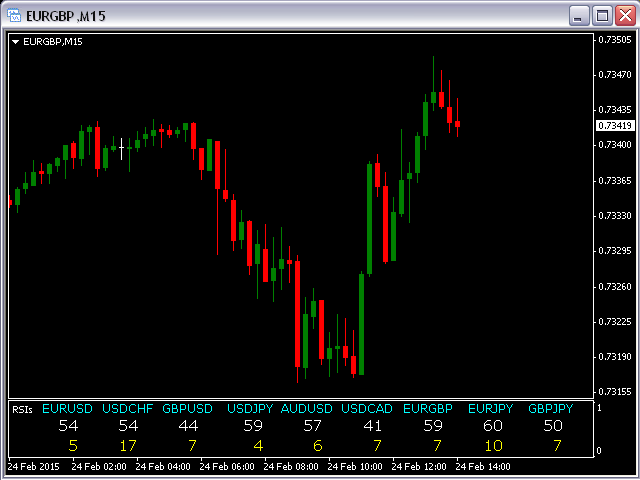
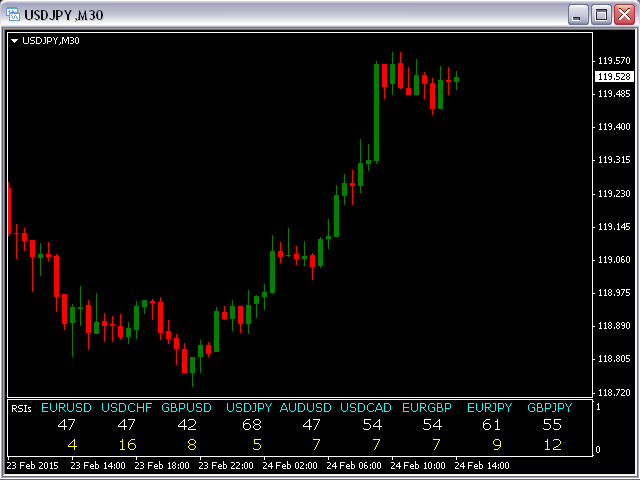
Wenn sich der Preis schnell nach oben/unten bewegt, erhöht die Mehrheit der Broker den Spread.
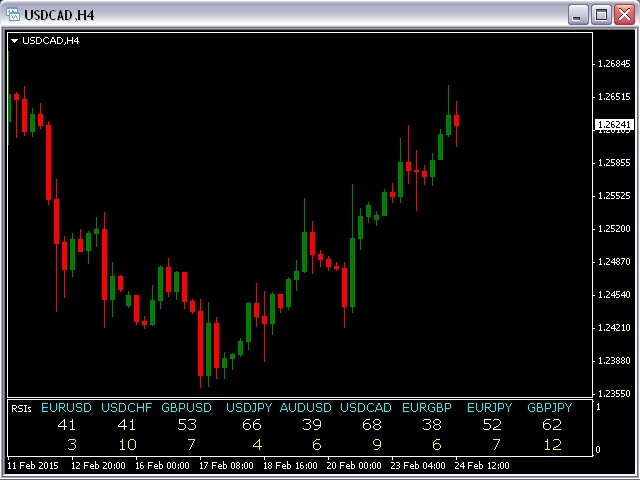
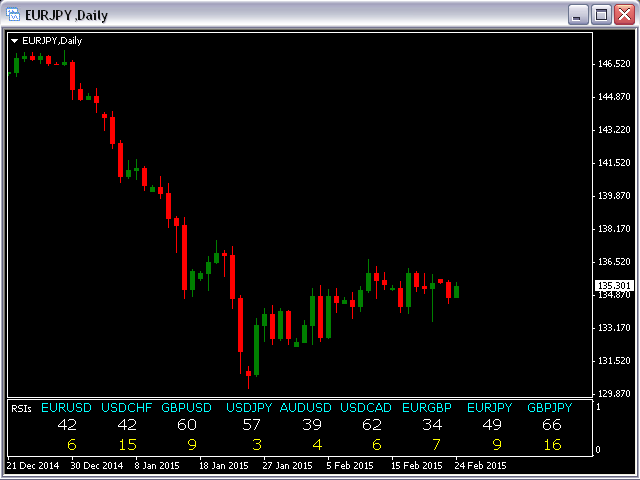
Dieser Indikator zeigt den Spread für 9 Währungspaare nach Ihrer Wahl(gelbe Ziffern) - Sie können alle Eingabeparameter ändern, einschließlich der Änderung des Namens der Währungspaare.
Dieser Indikator zeigt auch den klassischen Indikator RSI (Relative Strength Index) für definierte Währungspaare an und wird für diejenigen hilfreich sein, die es lieben und wissen, wie man nicht eine visuelle, sondern eine digitale Darstellung des Indikators verwendet.