Harmonic Wave
- Indicadores
-
Kaijun Wang
 Cooperation contact QQ: 556024
Cooperation mailbox: 556024@qq.com
Cooperation WeChat: 556024
TGGOUP: https://t.me/+qmlWO6RSTPY1ODc1 - Versión: 1.0
- Activaciones: 5
¡El descuento de compra completa está actualmente en curso!
⭐⭐⭐ ¡El mejor compañero para cualquier trader! ⭐⭐⭐⭐⭐⭐⭐⭐⭐⭐ .
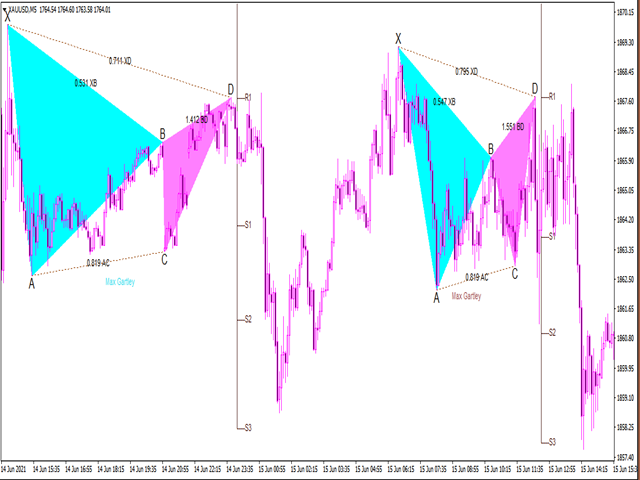
Este indicador es un indicador de mariposa clásico (comercio armónico). Por defecto, puede identificar 20 patrones y dar indicaciones. También puede agregar parámetros de forma personalizada para avisos personalizados, provocando niveles de stop loss y profit apropiados.
El algoritmo incorporado de este indicador es único y es un algoritmo de banda único.
Características del índice
El patrón Gartley, también conocido como Gartley "222", fue propuesto originalmente por HMGartley, el pionero del análisis técnico de patrones americano en 1935. Descubrió la relación de la sección de oro entre 4 segmentos de precios separados, y el propósito es guiar a todos sobre cómo el mercado en intervalos desordenados. En la transacción.
En la actualidad, se han desarrollado muchas formas en su fundamento, y este indicador las categoriza e integra el algoritmo de la banda.
Contenido fundamental
- Contiene 20 patrones de precios
- Historial y juicio del estado actual
- Stop loss y nivel de beneficios
- Correo electrónico/sonido/alerta
ajustes básicos
- Establecer el período de cálculo.
- Establecer el algoritmo de la banda del indicador 1. Sensible 2. Estable
- Establecer la selección del modo de cálculo del índice armónico 1. Algoritmo por defecto Algoritmo por defecto 2. Algoritmo personalizado 3. Se requieren ambos algoritmos
- Nombre de forma personalizado, y XA-B MINXA-B MAX AB-C MIN AB-C MAX BC-D MIN BC-D MAX XA-D MIN XA-D MAX con un total de 8 parámetros, más el nombre de forma, un total de 9 grupos Parámetro, por favor separe con',' en el ajuste. Si no rellena el formato, no se calculará y no pasará.
- Ajustes de color
Ajustes de alarma
- Nuevo formulario genera alarma
- Ventana emergente de alarma
- Envío de email de alarma
- Envío de alerta push
Configuración del color
- Puede establecer los colores ascendentes y descendentes del patrón
- Puede calcular la proporción de texto y otros colores
Cualquier duda, comuníquese