Harmonic Wave
- Indikatoren
-
Kaijun Wang
 Cooperation contact QQ: 556024
Cooperation mailbox: 556024@qq.com
Cooperation WeChat: 556024
TGGOUP: https://t.me/+qmlWO6RSTPY1ODc1 - Version: 1.0
- Aktivierungen: 5
Der volle Einkaufsrabatt ist derzeit in Arbeit!
⭐⭐⭐ Der beste Partner für jeden Trader! ⭐⭐⭐
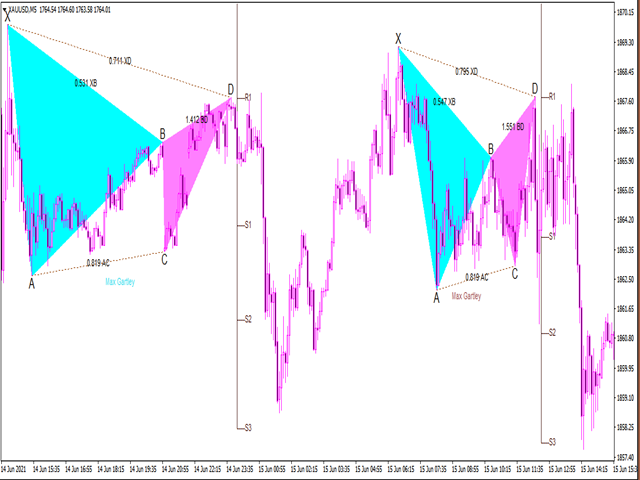
Dieser Indikator ist ein klassischer Schmetterlingsindikator (harmonischer Handel). Standardmäßig kann er 20 Muster erkennen und entsprechende Hinweise geben. Sie können auch benutzerdefinierte Formparameter für benutzerdefinierte Prompts hinzufügen, die geeignete Stop-Loss- und Gewinnniveaus vorgeben.
Der integrierte Algorithmus dieses Indikators ist einzigartig und verfügt über einen einzigartigen Bandalgorithmus.
Index-Eigenschaften
Das Gartley-Muster, auch bekannt als Gartley "222", wurde ursprünglich von HMGartley, dem Pionier der technischen Analyse amerikanischer Muster, im Jahr 1935 vorgeschlagen. Es entdeckte den goldenen Schnitt Beziehung zwischen 4 separaten Preissegmenten, und der Zweck ist es, alle auf, wie der Markt in ungeordneten Intervallen zu führen. Bei der Transaktion.
Derzeit sind viele Formen in seiner Grundlage entwickelt worden, und dieser Indikator kategorisiert sie und integriert den Algorithmus des Bandes.
Fundamentaler Inhalt
- Enthält 20 Preismuster
- Bewertung der Historie und des aktuellen Stands
- Stop-Loss und Gewinnniveau
- E-Mail/Ton/Alarm
Grundeinstellungen
- Legen Sie den Berechnungszeitraum fest.
- Einstellen des Indikatorband-Algorithmus 1. Empfindlich 2. Stabil
- Auswahl des Berechnungsmodus für den harmonischen Index 1. Standard-Algorithmus 2. Benutzerdefinierter Algorithmus 3. Beide Algorithmen sind erforderlich
- Benutzerdefinierter Formname und XA-B MINXA-B MAX AB-C MIN AB-C MAX BC-D MIN BC-D MAX XA-D MIN XA-D MAX mit insgesamt 8 Parametern, plus der Formname, insgesamt 9 Gruppen Parameter, bitte mit',' in der Einstellung trennen. Wenn Sie das Format nicht ausfüllen, wird es nicht berechnet und nicht zugelassen.
- Farbeinstellungen
Alarm-Einstellungen
- Neues Formular erzeugt Alarm
- Alarm-Pop-up-Fenster
- Versand von Alarm-E-Mails
- Push-Alarm senden
Farbeinstellung
- Sie können die ansteigenden und abfallenden Farben des Musters einstellen
- Sie können den Anteil von Text und anderen Farben berechnen
Alle Fragen, kommunizieren Sie mit einander