Cycle Sniper ATR Fibo Channels Scanner
- Indicadores
- Versión: 1.0
- Activaciones: 5

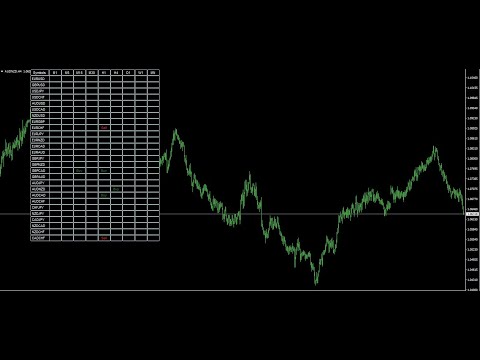
Scanner y Dashboard para Cycle Sniper ATR Fibo Channels Indicator
Como los usuarios saben indicador dibuja Fibonacci Canales y flechas de acuerdo a la configuración del usuario.
Con CS ATR Fibo Canales Scanner, usted tendrá la capacidad de observar el mercado.
- Multi Timeframe
- Multi Instrumento
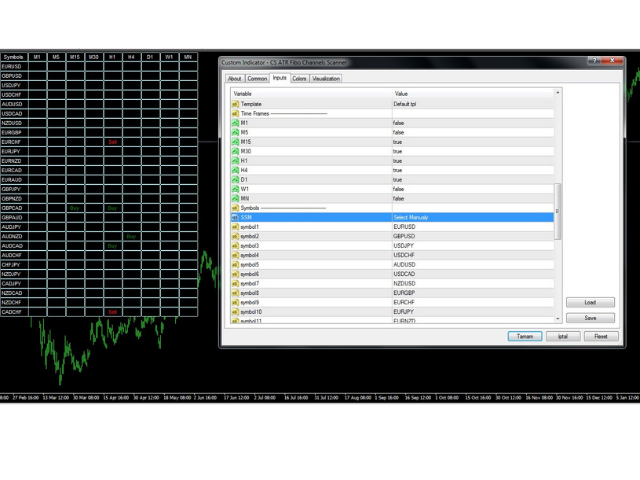
Introduzca sus parámetros para observar (como se explica en Cycle Sniper ATR Fibo Channels Indicator )
- Si elige "Flechas por Niveles ATR", recibirá las posibles flechas de reversión.
- Si elige "Flechas por Nivel Mediano", recibirá los posibles cambios de tendencia y rupturas.
Elija el marco temporal e introduzca los instrumentos que desea escanear.
Si elige "vigilancia del mercado", escaneará los primeros 40 instrumentos en su pestaña de vigilancia del mercado de la terminal MT4.
El escáner enviará alertas y pondrá la información de "compra" o "venta" en el tablero.
Cuando haga clic en una celda con una señal, se abrirá un nuevo gráfico con la plantilla definida por el usuario.
No dude en ponerse en contacto con nosotros para obtener más información.

It is a fabulous indicator I have purchased nearly all Mark's indicators And he is a fabulous teacher He would hold your hand and help you make the best of the indicators I have found it very very helpful in my trading