Market Activity Index MT4
- Indicadores
-
Young Ho Seo
 Harmonic Pattern Indicator - Repainting + Japanese Candlestick Pattern Scanner + Automatic Channel + Many more
https://www.mql5.com/en/market/product/4488 - Versión: 3.2
- Actualizado: 5 diciembre 2021
- Activaciones: 5
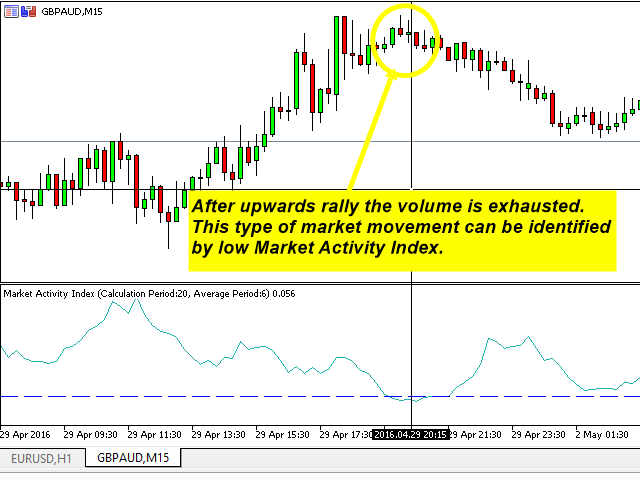
Este innovador indicador técnico fue creado para detectar el periodo de mercado tranquilo antes del comienzo del mercado de alta volatilidad. Como muchos buenos indicadores técnicos, este Índice de Actividad del Mercado es muy estable y es ampliamente aplicable a muchos instrumentos financieros y no financieros sin demasiadas restricciones. El Índice de Actividad del Mercado se puede utilizar mejor para visualizar la forma alternante de mercado de baja y alta volatilidad. Es una herramienta muy útil para captar el mercado tranquilo, pero irónicamente es la herramienta más poderosa para predecir el mercado altamente volátil. Lo mejor del Índice de Actividad del Mercado es que la lectura de este indicador está limitada por su límite superior (1,0) e inferior (0,0), pero el límite inferior nunca divergirá de los movimientos reales de los precios. Esto significa que para la lectura de 0.08 el Índice de Actividad del Mercado no puede ser calculado a partir de un movimiento de precios altamente volátil. Para visualizar lo importante que es este concepto, imagine que el precio puede seguir subiendo incluso después de que la lectura del RSI indique más de 70 de señal de sobrecompra (Esto puede ocurrirle al 99% de los osciladores). Lo mismo puede suceder con el ADX o con la mayoría de los indicadores técnicos. Por ejemplo, la lectura de 25 de ADX todavía se puede calcular incluso si hubo movimiento de precios bastante extrema antes. Se podría decir que se trata de una señal falsa o de una señal retardada. El Índice de Actividad del Mercado no es un indicador mágico, pero hará su trabajo de forma fiable notificando a los operadores la mayoría de las veces el período de mercado tranquilo o lateral. Esta herramienta puede ayudarle a comprender y aprender el ritmo del mercado.
Principio de funcionamiento del Índice de Actividad del Mercado
El Índice de Actividad del Mercado está diseñado para oscilar teóricamente entre 0,0 y 1,0. El nivel 0,0 indica teóricamente un periodo de calma total y el nivel 1,0 indica teóricamente la máxima volatilidad. Sin embargo, tanto 0,0 como 1,0 nunca se alcanzarán en la práctica. En su lugar, puede elegir 0,05 o 0,1 para detectar un periodo lateral o de baja volatilidad. El nivel 0,05 o 0,1 también se corresponde con el valor crítico habitual del 95% o el 90% utilizado en las pruebas de hipótesis estadísticas. Según nuestras observaciones, algunos pares de divisas funcionan mejor con un valor crítico de 0,05 y para otros pares de divisas, el valor crítico de 0,1 funciona mejor. La elección del valor crítico debe hacerse en función de los propios datos de precios.
Variable de entrada para el índice de actividad del mercado
El usuario puede querer ajustar la configuración del Índice de Actividad del Mercado para diferentes pares de divisas. A continuación se explica brevemente cada variable de entrada:
- Usar Gráfico de Fondo Blanco: sólo verdadero o falso
- Periodo de Cálculo: periodo para calcular el Índice de Actividad del Mercado.
- Periodo Medio: periodo para suavizar el Índice de Actividad del Mercado
- Utilizar media ponderada: sólo verdadero o falso (la media ponderada es más sensible que la media no ponderada)
- Valor del Nivel Crítico del Índice: Nivel crítico 0,05 o 0,1
- Anchura del Nivel Crítico del Índice: anchura de la línea del Nivel Crítico
- Color del nivel crítico del índice: color de la línea del nivel crítico
Consideraciones prácticas para el comercio en el mundo real
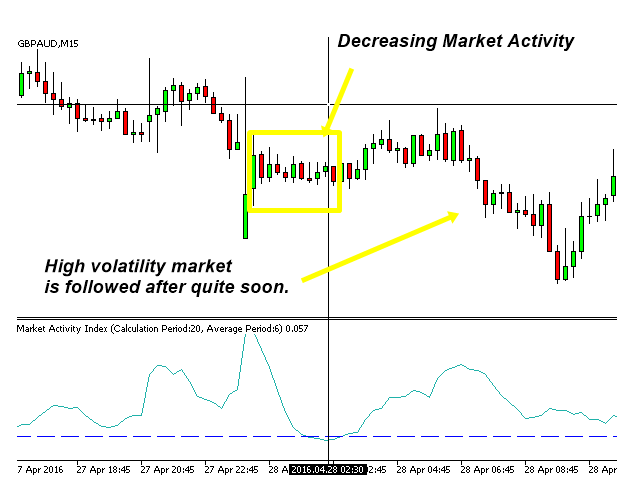
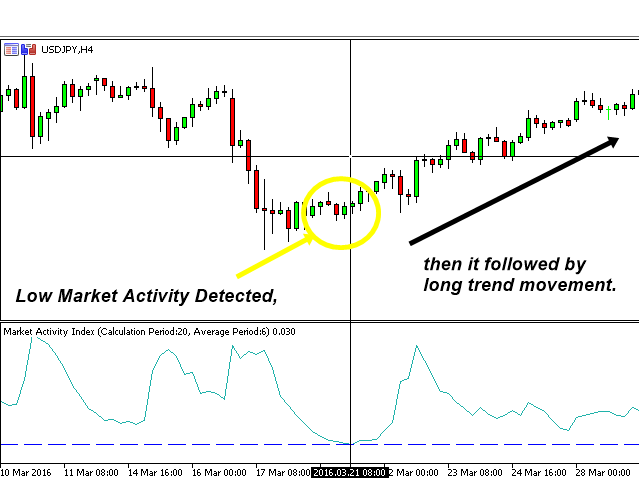
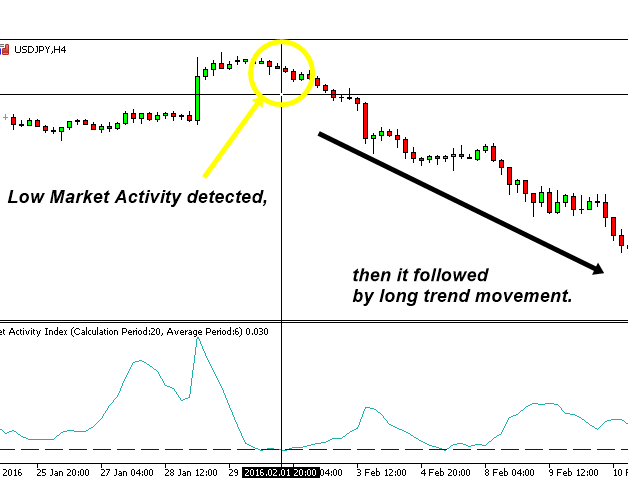
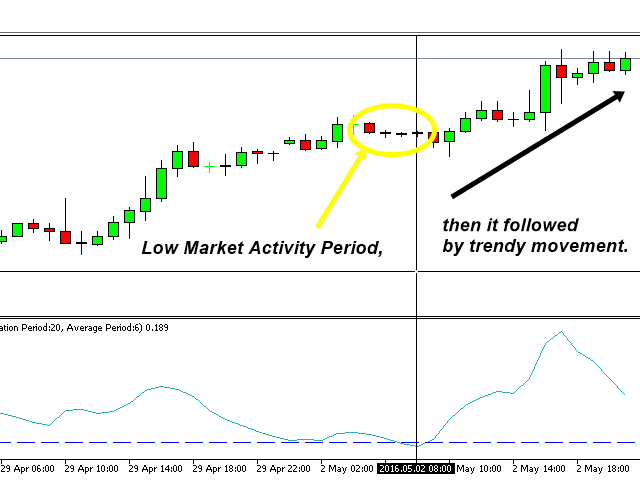
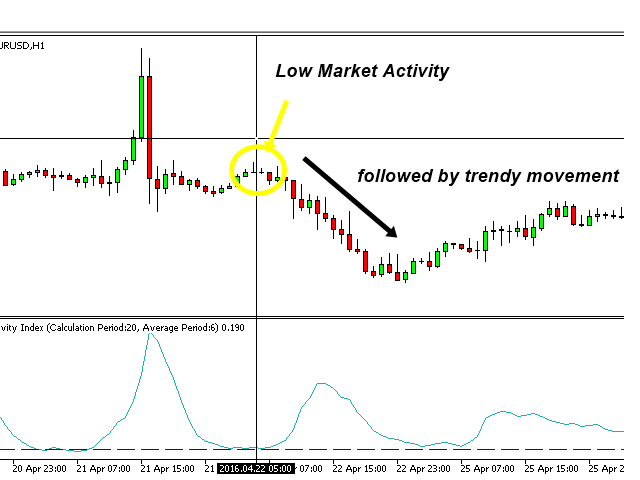
El índice de actividad del mercado puede utilizarse para detectar el periodo de calma del mercado, que también se denomina mercado lateral o mercado de baja volatilidad. En la práctica, este período de calma es seguido por un período de alta volatilidad de manera cíclica. El indicador en sí representa la alternancia de la volatilidad del mercado de forma cuantitativa. Este indicador puede detectar con éxito el inicio de un periodo de alta volatilidad en el mercado. A pesar del hecho de que el Índice de Actividad del Mercado a menudo detecta el punto de inflexión con precisión, el Índice de Actividad del Mercado no está destinado a predecir la dirección del mercado desde su etapa de diseño.
Nota adicional sobre el índice de actividad del mercado
El Índice de Actividad del Mercado es una herramienta para detectar mercados de baja volatilidad o laterales. Sin embargo, no es una herramienta para predecir la dirección del mercado. Si su estrategia de negociación se basa en la dirección, es posible que deba combinarla con otros indicadores técnicos.
Nota Importante
Este producto es el producto fuera de la plataforma en la tienda. Por lo tanto, no tomamos ninguna modificación personal o solicitud de personalización. Para nuestros productos, no proporcionamos ninguna biblioteca de código o cualquier apoyo para su codificación.
It works as stipulated. More features would be great.